Additional documentation available at
[tfbs-footprinting.readthedocs.io](tfbs-footprinting.readthedocs.io)
# 0. Summary
[1. Introduction](https://github.com/thirtysix/TFBS_footprinting3#1-introduction)
- [1.1 Basics](https://github.com/thirtysix/TFBS_footprinting3#11-basics)
- [1.2 Ensembl available species](https://github.com/thirtysix/TFBS_footprinting3#12-ensembl-available-species)
- [1.3 Experimental data](https://github.com/thirtysix/TFBS_footprinting3#13-experimental-data)
- [1.4 Ensembl transcript-ids](https://github.com/thirtysix/TFBS_footprinting3#14-ensembl-transcript-ids)
[2. Installation](https://github.com/thirtysix/TFBS_footprinting3#2-installation)
- [2.1 Conda installation](https://github.com/thirtysix/TFBS_footprinting3#21-conda-installation-recommended)
- [2.2 Pypi installation](https://github.com/thirtysix/TFBS_footprinting3#22-pypi-installation)
- [2.3 Docker installation](https://github.com/thirtysix/TFBS_footprinting3#23-docker-installation)
- [2.4 Requirements](https://github.com/thirtysix/TFBS_footprinting3#24-requirements)
[3. Input](https://github.com/thirtysix/TFBS_footprinting3#3-input)
- [3.1 CSV of Ensembl transcript](https://github.com/thirtysix/TFBS_footprinting3#31-csv-of-ensembl-transcript)
- [3.2 Text file of transcript IDs](https://github.com/thirtysix/TFBS_footprinting3#32-text-file-of-transcript-ids)
- [3.3 Text file TF IDs](https://github.com/thirtysix/TFBS_footprinting3#33-text-file-tf-ids)
[4. Output](https://github.com/thirtysix/TFBS_footprinting3#4-output)
- [4.1 Promoter Figure](https://github.com/thirtysix/TFBS_footprinting3#41-promoter-figure)
- [4.2 Table of predictions](https://github.com/thirtysix/TFBS_footprinting3#42-table-of-predictions)
- [4.3 Additional outputs](https://github.com/thirtysix/TFBS_footprinting3#43-additional-outputs)
[5. Examples](https://github.com/thirtysix/TFBS_footprinting3#5-examples)
- [5.1 TFBS_footprinter3 Use Examples](https://github.com/thirtysix/TFBS_footprinting3#51-tfbs_footprinter3-use-examples)
- [5.2 TFBS_footprinter3 Use Examples (within Docker)](https://github.com/thirtysix/TFBS_footprinting3#52-tfbs_footprinter3-use-examples-within-docker)
- [5.3 Update experimental data files](https://github.com/thirtysix/TFBS_footprinting3#53-update-experimental-data-files)
[6. Parameters](https://github.com/thirtysix/TFBS_footprinting3#6-parameters)
[7. Process](https://github.com/thirtysix/TFBS_footprinting3#7--process)
- [7.1 Steps](https://github.com/thirtysix/TFBS_footprinting3#71-steps)
[8. Troubleshooting](https://github.com/thirtysix/TFBS_footprinting3#8-troubleshooting)
- [8.1 Log file](https://github.com/thirtysix/TFBS_footprinting3#81-log-file)
- [8.2 Docker](https://github.com/thirtysix/TFBS_footprinting3#92-docker)
# 1. Introduction
## 1.1 Basics
**Primary Usage:** Identification of cis-regulatory elements in up to 124 vertebrate species cataloged in the [Ensembl.org](https://www.ensembl.org/index.html) database. Transcription factor binding sites (TFBSs) are initially identified by matrix scoring and then additionally scored on 7 other relevant contextual datapoints (see 1.2). Uses the Ensembl transcript ID (TID) as the basic point of reference for all analyses.
* This work is a derivative of ["Transcription factors"](https://commons.wikimedia.org/wiki/File:Transcription_Factors.svg) by [kelvin13](https://commons.wikimedia.org/wiki/User:Kelvin13), used under [CC BY 3.0](https://creativecommons.org/licenses/by/3.0/)
* * *
## 1.2 Ensembl available species
**Table of species which can be analyzed by tfbs_footprinter3 at this time**
|A-F |G-M |N-P |Q-Z |
|----------------------------|----------------------------|------------------------------|-------------------------------|
|acanthochromis polyacanthus |gadus morhua |nannospalax galili |rattus norvegicus |
|ailuropoda melanoleuca |gallus gallus |neolamprologus brichardi |rhinopithecus bieti |
|amphilophus citrinellus |gambusia affinis |nomascus leucogenys |rhinopithecus roxellana |
|amphiprion ocellaris |gasterosteus aculeatus |ochotona princeps |saimiri boliviensis boliviensis|
|amphiprion percula |gorilla gorilla |octodon degus |scleropages formosus |
|anabas testudineus |haplochromis burtoni |oreochromis niloticus |scophthalmus maximus |
|anas platyrhynchos |heterocephalus glaber female|oryctolagus cuniculus |seriola dumerili |
|anolis carolinensis |heterocephalus glaber male |oryzias latipes hni |seriola lalandi dorsalis |
|aotus nancymaae |hippocampus comes |oryzias latipes hsok |sorex araneus |
|astatotilapia calliptera |homo sapiens |oryzias latipes |stegastes partitus |
|astyanax mexicanus |ictalurus punctatus |oryzias melastigma |sus scrofa |
|bos taurus |ictidomys tridecemlineatus |otolemur garnettii |taeniopygia guttata |
|callithrix jacchus |jaculus jaculus |ovis aries |takifugu rubripes |
|canis familiaris |kryptolebias marmoratus |pan paniscus |tetraodon nigroviridis |
|capra hircus |labrus bergylta |pan troglodytes |tupaia belangeri |
|carlito syrichta |lepisosteus oculatus |panthera pardus |tursiops truncatus |
|cavia aperea |loxodonta africana |panthera tigris altaica |vicugna pacos |
|cavia porcellus |macaca fascicularis |papio anubis |xiphophorus couchianus |
|cebus capucinus |macaca mulatta |paramormyrops kingsleyae |xiphophorus maculatus |
|cercocebus atys |macaca nemestrina |pelodiscus sinensis | |
|chinchilla lanigera |mandrillus leucophaeus |periophthalmus magnuspinnatus | |
|chlorocebus sabaeus |mastacembelus armatus |peromyscus maniculatus bairdii| |
|choloepus hoffmanni |maylandia zebra |poecilia formosa | |
|colobus angolensis palliatus|meleagris gallopavo |poecilia latipinna | |
|cricetulus griseus chok1gshd|mesocricetus auratus |poecilia mexicana | |
|cricetulus griseus crigri |microcebus murinus |poecilia reticulata | |
|cynoglossus semilaevis |microtus ochrogaster |pongo abelii | |
|cyprinodon variegatus |mola mola |procavia capensis | |
|danio rerio |monopterus albus |propithecus coquereli | |
|dasypus novemcinctus |mus caroli |pteropus vampyrus | |
|dipodomys ordii |mus musculus |pundamilia nyererei | |
|echinops telfairi |mus pahari |pygocentrus nattereri | |
|equus caballus |mus spretus | | |
|erinaceus europaeus |mustela putorius furo | | |
|esox lucius |myotis lucifugus | | |
|felis catus | | | |
|ficedula albicollis | | | |
|fukomys damarensis | | | |
|fundulus heteroclitus | | | |
## 1.3 Experimental data
The TFBS footprinting method computationally predicts transcription factor binding sites (TFBSs) in a target species (e.g., homo sapiens, chimpanzee, mouse, zebrafish, etc.) using 575 position weight matrices (PWMs) based on binding data from the JASPAR database. Additional experimental data from a variety of sources is used to support or detract from these predictions:
- Sequence conservation in homologous vertebrate species DNA sequences
- proximity to CAGE-supported transcription start sites (TSSs)
- correlation of expression between target gene and predicted
transcription factor (TF) across 1800+ samples
- proximity to ChIP-Seq determined TFBSs (GTRD project)
- proximity to qualitative trait loci (eQTLs) affecting expression of
the target gene (GTEX project)
- proximity to CpGs
- proximity to ATAC-Seq peaks (ENCODE project)
## 1.4 Ensembl transcript-ids
In order to incorporate several of the experimental datapoints, and for ease of use, the Ensembl transcript ID was chosen as the primary identifier around which TFBS_footprinting analyses would revolve. This allows users to predict TFBSs in the promoters any of 1-80,000 human protein coding transcripts in the Ensembl database, and incorporate expression data from the FANTOM project, and eQTLS from the GTEx project, which has been assigned to these IDs. TFBS predictions can also be made for 123 unique non-human species (including model organisms such as mouse and zebrafish).
# 2. Installation
A video tutorial on how to install the TFBS_footprinting tool and run sample analyses is available:
[](https://www.youtube.com/watch?v=tJaLHKIhksU)
## 2.1 Conda installation (recommended)
The TFBS_footprinting package can be installed directly to your linux system using [Conda](https://anaconda.org/thirtysix/tfbs-footprinting3).
1. Create a conda environment based on python version 3.8, named 'tfbs':
`$ conda create -n tfbs python=3.8`
2. Activate the created conda environment:
`$ conda activate tfbs`
3. Install the TFBS_footprinting3 tool:
`$ conda install -c thirtysix tfbs-footprinting3 -c conda-forge`
4. Install wget with pip:
`$ pip install wget`
## 2.2 Pypi installation
The TFBS_footprinting package can be installed directly to your linux system using [PIP](https://pip.pypa.io/en/stable/installing/) install.
`$ pip install tfbs_footprinting3`
## 2.3 Docker installation (Deprecated, uses Python 2.7)
TFBS_footprinting is now available in a [Docker image](https://hub.docker.com/r/thirtysix/tfbs_footprinting/) which already contains all of the software requirements. This can be used on both Linux and Windows systems.
`$ docker pull thirtysix/tfbs_footprinting`
The Docker installation will have a default RAM allocation that is too low (\~2GB) to run TFBS_footprinting. This setting should be changed to \>6144MB. In Windows this can be adjusted by navigating through: Docker system tray icon\>Settings\>Advanced\>Memory. After changing this value, Docker will restart, which could take several minutes.
## 2.4 Requirements
These requirements are automatically installed by Conda and the PIP installer, and are already present in the Docker image:
- biopython
- numpy
- matplotlib
- httplib2
- msgpack
- wget
# 3. Input
## 3.1 CSV of Ensembl transcript
### IDs and arguments
In this first option a .csv table of Ensembl transcript IDs and optional arguments is used. Except for the first column indicating the Ensembl transcript id, any argument can be left blank which will result in the default value being used. An example of this file is included in the sample_analysis folder and can be downloaded from [Github](https://github.com/thirtysix/TFBS_footprinting/blob/master/sample_analysis/sample_analysis_list.csv).

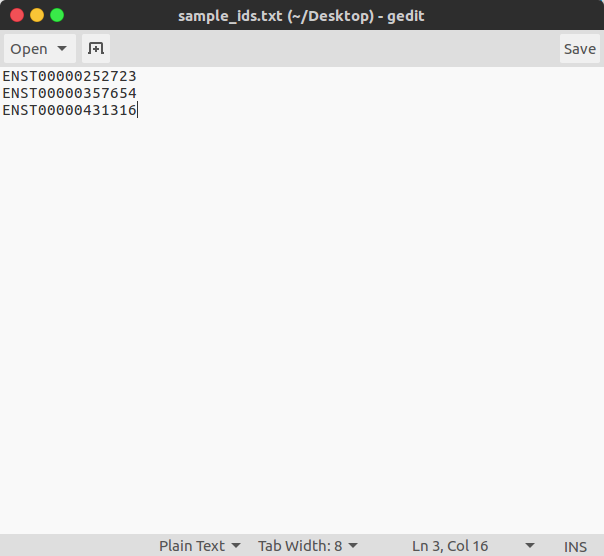
## 3.2 Text file of transcript IDs
In this second option a simple text-file of Ensembl transcript IDs is used. Whatever arguments are provided to the command-line will be applied to analysis of all transcripts indicated in this file. An example of this file is included in the sample_analysis folder and can be downloaded from [Github](https://github.com/thirtysix/TFBS_footprinting/blob/master/sample_analysis/sample_ensembl_ids.txt).
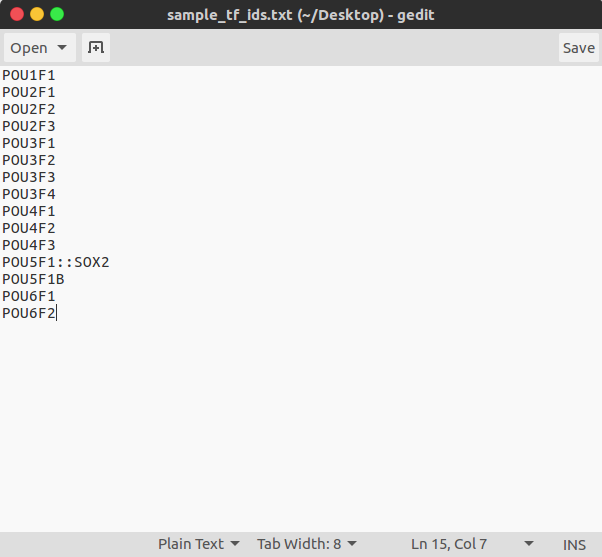
## 3.3 Text file TF IDs
A file of JASPAR TF IDs can be provided which will limit the analysis of TFs to just those contained within. If no file name is provided then the analysis will use all 575 JASPAR TFs in the analysis, in this case the results in the output table can be filtered to just those TFs you wish to focus on. An example of this file, which contains all JASPAR TF IDs, is included in the sample_analysis folder which can be downloaded from [Github](https://github.com/thirtysix/TFBS_footprinting/blob/master/sample_analysis/sample_jaspar_tf_ids.txt).
# 4. Output
## 4.1 Promoter Figure
- **Output name format**
\[Ensembl_transcript_id\]\[nt_before_TSS\]\[nt_after_TSS\]\[species_group\]\[species_coverage\]\[pvalue\].Promoterhisto.svg.
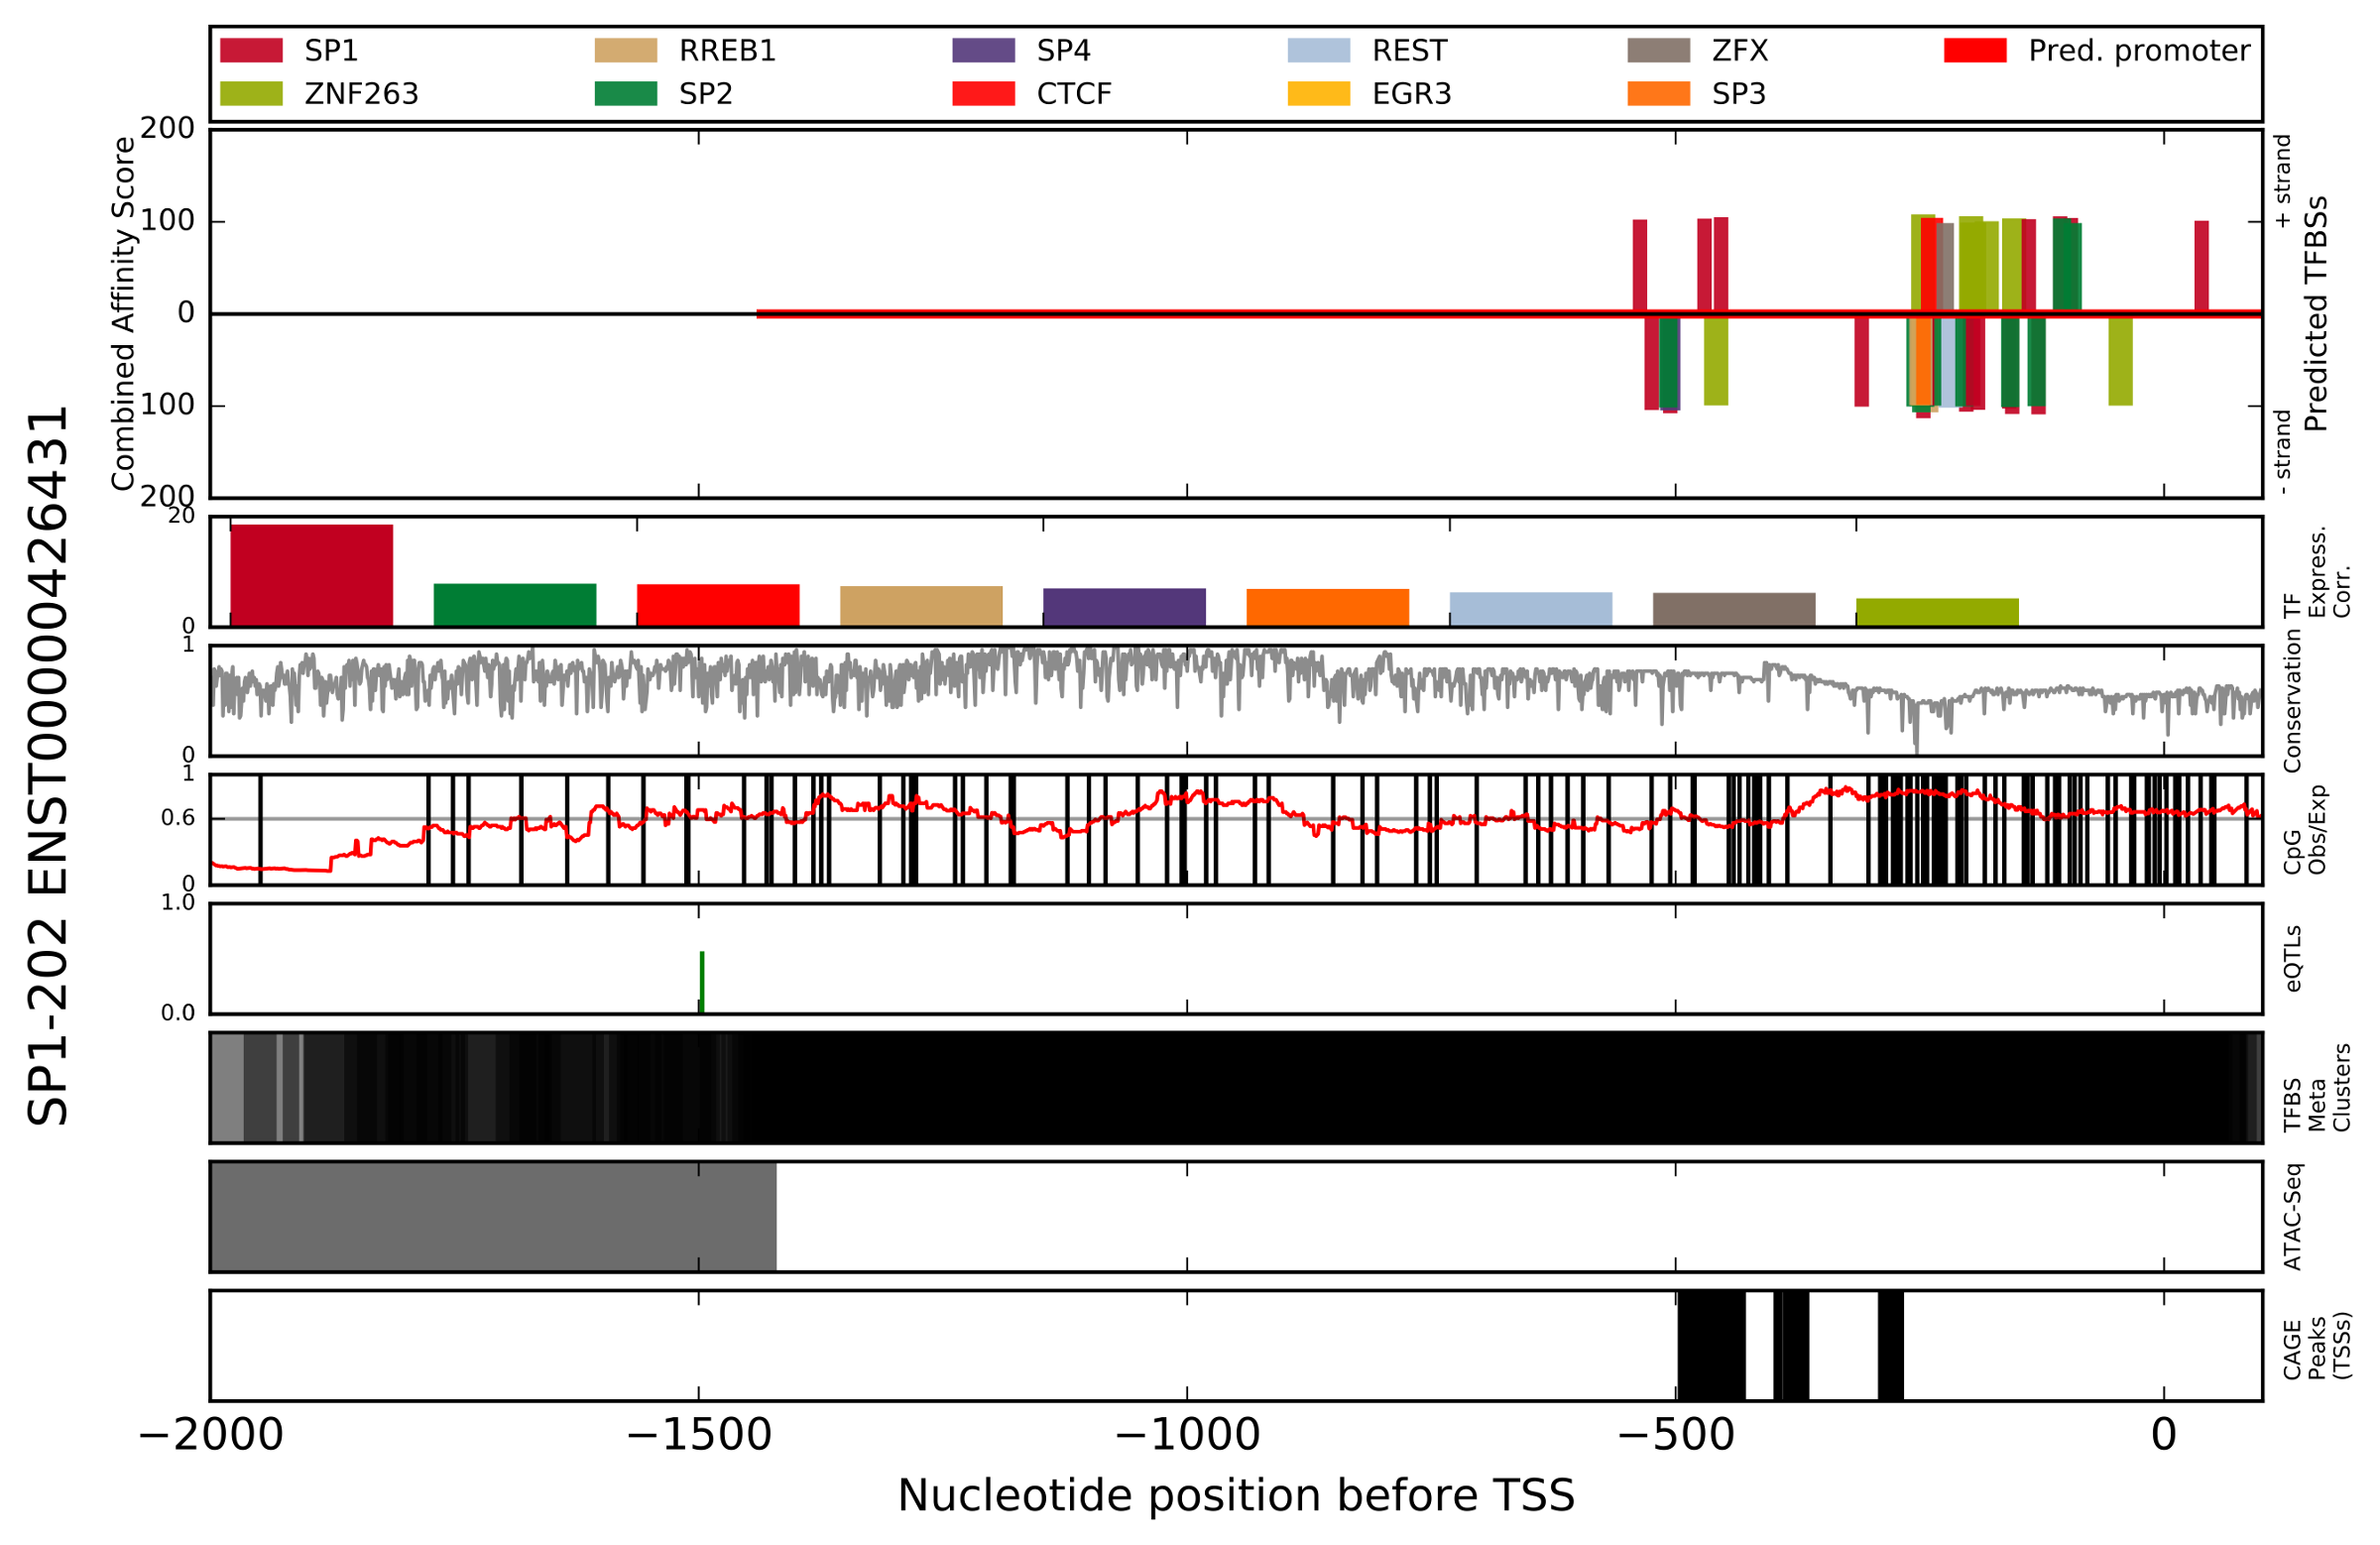
- **Figure Title (left)** - Ensembl gene name and Transcript ID.
- **Predicted TFBSs** - Depicts the region analyzed in this analysis.
Bars displayed on the positive y-axis indicate TFBS predictions made on the positive (+) DNA strand. The legend of colors is located directly above, and correlates colors to the TF which is predicted to bind. Combined affinity score is the summation of scores for the seven characteristics scored by the TFBS Footprinting tool. Using the x-axis values at the bottom of the figure, the x-axis indicates nucleotide position relative to the TSS (e.g., -1000 is 1000 nt upstream of the TSS).
- **TF Expression Correlation** - For the TFs with the highest combined affinity scores, the correlation of expression with the target gene has been determined and is presented in descending order of log-likelihood score. The color legend is the same as the Predicted TFBSs subplot, and is located at the top of the figure.
- **Conservation** - A measure of the conservation at each position.
- **CpG Observed/Expected** - Indidents of CpG (Cytosine-Phosphate-Guanine) are indicated with a vertical black line. A line plot in red indicates the ratio of actual to expected CpGs (by chance alone) in a 200 nt window.
- **eQTLs** - Locations of eQTLs identified in the [gTEX project](https://www.gtexportal.org/home/) which affect the target gene. Green bars on the positive y-axis indicate eQTLs assocaiate with enhanced expression of the target gene, while red bars on the negative y-axis indicate those associated with reduced expression. The magnitude of the bars indicates the projected effect on gene expression.
- **TFBS Meta Clusters** - Locations of TFBS metaclusters representing clusters of experimentally identifed (ENCODE and SRA databases) TFBSs which have been compiled by the [GTRD project](http://gtrd.biouml.org/).
- **ATAC-Seq** - Locations of ATAC-Seq peaks identified by ENCODE experiments representing open chromatin.
- **CAGE peaks (TSSs)** - Locations of TSSs identified by CAGE in the [FANTOM project](http://fantom.gsc.riken.jp/).
## 4.2 Table of predictions
All predicted TFBSs for target transcript, filtered by p-value threshold and sorted by combined affinity score (TFBSs_found.sortedclusters.csv).
- **binding prot** - Gene name of protein predicted to bind.
- **motif** - DNA sequence of target species which is predicted to be bound by the binding protein.
- **strand** - Positive or negative strand of DNA.
- **start** - Location in target species DNA sequence of the start of the motif.
- **end** - Location in target species DNA sequence of the end of the motif.
- **TSS-relative start** - Location relative to the TSS of the start of the motif.
- **TSS-relative end** - Location relative to the TSS of the end of the motif.
- **PWM score** - Log-likelihood score of the prediction of the binding of the TF.
- **p-value** - P-value corresponding to the frame score.
- **combined affinity score** - Summation of all scores for this motif/prediction.
- **species weights sum** - Summation of log-likelihood scores for GERP peaks near the predicted TFBS.
- **cage weights sum** - Summation of log-likehood scores for the CAGE peaks near the predicted TFBS.
- **eqtls weights sum** - Summation of log-likehood scores for the eQTLs peaks near the predicted TFBS.
- **atac weights sum** - Summation of log-likehood scores for the ATAC-Seq peaks near the predicted TFBS.
- **metacluster weights sum** - Summation of log-likehood scores for the metacluster peaks near the predicted TFBS.
- **cpg weight** - Log-likehood score for the CpG obs/exp ratio at the center of the predicted TFBS.
- **corr weight sum** - Summation of log-likehood scores for correlations of expression between transcripts of the predicted TF and those of the target gene.
## 4.3 Additional outputs
- Original target organism target transcript DNA sequence as retrieved from Ensembl (alignment_uncleaned.fasta).
- Cleaned alignment (alignment_cleaned.fasta).
- Regulatory information for the target transcripts user-defined promoter region (regulatory_decoded.json).
- Transcript properties for target transcript (transcript_dict.json).
- All predicted TFBSs for the target species which satisfy p-value threshold (TFBSs_found.all.json).
# 5. Examples
## 5.1 TFBS_footprinter3 Use Examples
**Running the example analyses**
- Change current directory to example directory (can be downloaded directly from this Github repository)
> `$ cd PATH_TO/example`
- Run the example analysis using a .csv of arguments:
> `$ tfbs_footprinter3 -t sample_csv.csv`
- Run the sample analysis using a .txt of Ensembl transcript ids, and minimal arguments:
> `$ tfbs_footprinter3 -t sample_ids.txt`
- Run the sample analysis using a .txt of Ensembl transcript ids, and all arguments:
> `$ tfbs_footprinter3 -t sample_ids.txt -tfs jaspar_tf_ids_selected.txt -pb 900 -pa 100 -tx 10 -p 0.01 -pc 0.01 -update`
## 5.2 TFBS_footprinter3 Use Examples (within Docker; deprecated, uses Python 2.7)
**Running the sample analyses**
1. Within Docker we first need to mount a volume so that the results of the analyis can be viewed on our host computer. It is recommended that you create an empty directory on your host computer:
> `$ docker run -v /ABSOLUTE_PATH_TO/EMPTY_DIR_ON_HOST:/home/sample_analysis/tfbs_results -it thirtysix/tfbs_footprinting bash`
2. Then we move into the pre-existing sample analysis directory in the Docker container to perform the analysis there so that the results generated there will automatically appear in the designated location on our host computer:
> `$ cd ./sample_analysis`
3. Then we can run the sample analysis in Docker in the same way that we would normally use tfbs_footprinter3 (above), e.g., using a .csv of arguments:
> `$ tfbs_footprinter3 -t ./sample_analysis_list.csv`
- Or (again, as above) using a .txt of Ensembl transcript ids, and minimal arguments:
> `$tfbs_footprinter3 -t ./sample_ensembl_ids.txt`
- Or (again, as above) using a .txt of Ensembl transcript ids, and multiple arguments:
> `$ tfbs_footprinter3 -t ./sample_ensembl_ids.txt -tfs ./sample_jaspar_tf_ids.txt -pb 900 -pa 100 -tx 10 -update`
### Example using user-defined files/arguments
1. Within Docker we first need to mount a volume so that we can load your analysis files from your host computer into docker AND save the results of the analysis on our host computer:
> `$ docker run -v /ABSOLUTE_PATH_TO/DIR_ON_HOST/CONTAINING_ANALYSIS_FILES:/home/analysis_dir -it thirtysix/tfbs_footprinting bash`
2. Then we move into your analysis directory in the Docker container to perform the analysis there so that the results generated there will automatically appear in the designated location on our host computer:
> `$ cd ./analysis_dir`
3. Then we can run the sample analysis in Docker in the same way that we would normally use tfbs_footprinter3 (above), e.g., using a .csv of arguments:
> `$ tfbs_footprinter3 -t ./USER_TABLE_OF_ENSEMBL_IDS_AND_ARGS.csv`
- Or (again, as above) using a .txt of Ensembl transcript ids, and minimal arguments:
> `$ tfbs_footprinter3 -t ./USER_LIST_OF_ENSEMBL_IDS.txt`
- Or (again, as above) using a .txt of Ensembl transcript ids, and multiple arguments:
> `$ tfbs_footprinter3 -t ./USER_LIST_OF_ENSEMBL_IDS.txt -tfs ./USER_LIST_OF_TF_NAMES.txt -s homo_sapiens -g mammals -e low -pb 900 -pa 100 -tx 10 -o PATH_TO/Results/ -update`
## 5.3 Update experimental data files
Check the documentation on [ReadTheDocs](https://tfbs-footprinting.readthedocs.io/en/latest/) for new releases.
> `$ tfbs_footprinter3 -update`
# 6. Parameters
**arguments:**
- **\-h, --help**
show this help message and exit.
- **\-\-t_ids_file , -t**
Required for running an analysis. Location of a file containing Ensembl target_species transcript ids. Input options are either a text file of Ensembl transcript ids or a .csv file with individual values set for each parameter.
- **\-\-tf_ids_file , -tfs**
Optional: Location of a file containing a limited list of Jaspar TFs to use in scoring DNA sequence (see sample file tf_ids.txt at https://github.com/thirtysix/TFBS_footprinting) [default: all Jaspar TFs].
- **\-\-promoter_before_tss , -pb**
(0-100,000) [default: 900] - Number (integer) of nucleotides upstream of TSS to include in analysis. If this number is negative the start point will be downstream of the TSS, the end point will then need to be further downstream.
- **\-\-promoter_after_tss , -pa**
(0-100,000) [default: 100] - Number (integer) of nucleotides downstream of TSS to include in analysis. If this number is negative the end point will be upstream of the TSS. The start point will then need to be further upstream.
- **\-\-top_x_tfs , -tx**
(1-20) [default: 10] - Number (integer) of unique TFs to include in output .svg figure.
- **\-\-pval, -p**
PVAL P-value (float) for PWM score cutoff (range: 1 (all results) to 0.0000001; in divisions of 10 (i.e. 1, 0.1, 0.01, 0.001 etc.) [default: 0.01].
- **\-\-pvalc, -pc**
P-value (float) for PWM score cutoff (range: 1 (all results) to 0.0000001; in divisions of 10 (i.e. 1, 0.1, 0.01, 0.001 etc.) [default: 0.01].
- **\-\-exp_data_update, -update**
Download the latest experimental data files for use in analysis. Will run automatically if the "data" directory does not already exist (e.g., first usage).
- **\-\-nofig, -no**
Don't output a figure.
# 7. Process
## 7.1 Steps
### Iterate through each user provided Ensembl transcript id:
**1. Retrieve user-defined DNA sequence region from Ensembl** for promoter of user-provided transcript id, between user-defined TSS-relative start/stop sites.
**2. Generate position weight matrices (PWMs)** from Jaspar position frequency matrices (PFMs).
**3. Score target species DNA sequence** using either all or a user-defined list of PWMs.
**4. Keep predictions with a log-likelihood score greater** than score threshold corresponding to p-value of 0.01, or user-defined p-value.
**5. Generate log-likelihood each of the following for the target DNA sequence region**:
- DNA sequence conservation in homologous vertebrate species DNA sequences
- proximity to CAGE-supported transcription start sites (TSSs)
- correlation of expression between target gene and predicted transcription factor (TF) across 1800 samples
- proximity to ChIP-Seq determined TFBSs (GTRD project)
- proximity to qualitative trait loci (eQTLs) affecting expression of the target gene (GTEX project)
- proximity to CpGs
- proximity to ATAC-Seq peaks (ENCODE project)
**6. Compute 'combined affinity score'** as a sum of scores for all experimental data.
**7. Output predictions table**
**8. Output a vector graphics figure** showing the top 10 (or user-defined) unique TFs mapped onto the promoter of the target transcript, and additional output as described below.
# 8. Troubleshooting
## 9.1 Log file
The first step in troubleshooting any possible errors that might arise is to check the log file. The log file is created in the directory where you initiated the analysis, and it is named \'TFBS_footprinter3.log\'.
**Many relevant events are logged there instead of output to terminal:**
- start time of analysis
- arguments/settings used in analysis
- full queries made to the Ensembl REST system
- warnings from Ensembl REST system regarding exceeding of rate limit
- if given transcript ids are not in the Ensembl system (possibly misformed or deprecated)
- if experimental data used in TFBS prediction has been downloaded
- if there was an error in downloading experimental data
- if results already exist for the current analysis, which are then loaded
- total time of analysis
- if there was an error in retrieving an alignment for the defined region
- if the transcript information file already exists
- if the transcript regulatory information file already exists
## 9.2 Docker (Deprecated, uses Python 2.7)
The Docker installation will have a default RAM allocation that is too low (\~2GB) to run TFBS_footprinting. This setting should be changed to \>6144MB.
In Windows this can be adjusted by navigating through:
**Docker system tray icon\>Settings\>Advanced\>Memory**.
After changing this value Docker will restart, which could take several minutes. If the allocated memory is too low, then the Docker image will terminate and you will see the `$ killed` message in the console.
Raw data
{
"_id": null,
"home_page": "https://github.com/thirtysix/TFBS_footprinting3",
"name": "TFBS-footprinting3",
"maintainer": "",
"docs_url": null,
"requires_python": "",
"maintainer_email": "",
"keywords": "bioinformatics analysis",
"author": "Harlan Barker",
"author_email": "harlan.barker@tuni.fi",
"download_url": "https://files.pythonhosted.org/packages/e7/51/4ddec91398719060f2756891ec2cd44abb689d0521b9819a2f953f5da768/TFBS_footprinting3-0.0.5.tar.gz",
"platform": null,
"description": "\nAdditional documentation available at\n[tfbs-footprinting.readthedocs.io](tfbs-footprinting.readthedocs.io)\n\n# 0. Summary\n\n[1. Introduction](https://github.com/thirtysix/TFBS_footprinting3#1-introduction)\n- [1.1 Basics](https://github.com/thirtysix/TFBS_footprinting3#11-basics)\n- [1.2 Ensembl available species](https://github.com/thirtysix/TFBS_footprinting3#12-ensembl-available-species)\n- [1.3 Experimental data](https://github.com/thirtysix/TFBS_footprinting3#13-experimental-data)\n- [1.4 Ensembl transcript-ids](https://github.com/thirtysix/TFBS_footprinting3#14-ensembl-transcript-ids)\n\n[2. Installation](https://github.com/thirtysix/TFBS_footprinting3#2-installation)\n- [2.1 Conda installation](https://github.com/thirtysix/TFBS_footprinting3#21-conda-installation-recommended)\n- [2.2 Pypi installation](https://github.com/thirtysix/TFBS_footprinting3#22-pypi-installation)\n- [2.3 Docker installation](https://github.com/thirtysix/TFBS_footprinting3#23-docker-installation)\n- [2.4 Requirements](https://github.com/thirtysix/TFBS_footprinting3#24-requirements)\n\n[3. Input](https://github.com/thirtysix/TFBS_footprinting3#3-input)\n- [3.1 CSV of Ensembl transcript](https://github.com/thirtysix/TFBS_footprinting3#31-csv-of-ensembl-transcript)\n- [3.2 Text file of transcript IDs](https://github.com/thirtysix/TFBS_footprinting3#32-text-file-of-transcript-ids)\n- [3.3 Text file TF IDs](https://github.com/thirtysix/TFBS_footprinting3#33-text-file-tf-ids)\n\n[4. Output](https://github.com/thirtysix/TFBS_footprinting3#4-output)\n- [4.1 Promoter Figure](https://github.com/thirtysix/TFBS_footprinting3#41-promoter-figure)\n- [4.2 Table of predictions](https://github.com/thirtysix/TFBS_footprinting3#42-table-of-predictions)\n- [4.3 Additional outputs](https://github.com/thirtysix/TFBS_footprinting3#43-additional-outputs)\n\n[5. Examples](https://github.com/thirtysix/TFBS_footprinting3#5-examples)\n- [5.1 TFBS_footprinter3 Use Examples](https://github.com/thirtysix/TFBS_footprinting3#51-tfbs_footprinter3-use-examples)\n- [5.2 TFBS_footprinter3 Use Examples (within Docker)](https://github.com/thirtysix/TFBS_footprinting3#52-tfbs_footprinter3-use-examples-within-docker)\n- [5.3 Update experimental data files](https://github.com/thirtysix/TFBS_footprinting3#53-update-experimental-data-files)\n\n[6. Parameters](https://github.com/thirtysix/TFBS_footprinting3#6-parameters)\n\n[7. Process](https://github.com/thirtysix/TFBS_footprinting3#7--process)\n- [7.1 Steps](https://github.com/thirtysix/TFBS_footprinting3#71-steps)\n\n\n[8. Troubleshooting](https://github.com/thirtysix/TFBS_footprinting3#8-troubleshooting)\n- [8.1 Log file](https://github.com/thirtysix/TFBS_footprinting3#81-log-file)\n- [8.2 Docker](https://github.com/thirtysix/TFBS_footprinting3#92-docker)\n\n\n\n\n# 1. Introduction\n\n## 1.1 Basics\n\n**Primary Usage:** Identification of cis-regulatory elements in up to 124 vertebrate species cataloged in the [Ensembl.org](https://www.ensembl.org/index.html) database. Transcription factor binding sites (TFBSs) are initially identified by matrix scoring and then additionally scored on 7 other relevant contextual datapoints (see 1.2). Uses the Ensembl transcript ID (TID) as the basic point of reference for all analyses.\n\n* This work is a derivative of [\"Transcription factors\"](https://commons.wikimedia.org/wiki/File:Transcription_Factors.svg) by [kelvin13](https://commons.wikimedia.org/wiki/User:Kelvin13), used under [CC BY 3.0](https://creativecommons.org/licenses/by/3.0/)\n* * *\n\n\n## 1.2 Ensembl available species\n**Table of species which can be analyzed by tfbs_footprinter3 at this time**\n\n|A-F |G-M |N-P |Q-Z |\n|----------------------------|----------------------------|------------------------------|-------------------------------|\n|acanthochromis polyacanthus |gadus morhua |nannospalax galili |rattus norvegicus |\n|ailuropoda melanoleuca |gallus gallus |neolamprologus brichardi |rhinopithecus bieti |\n|amphilophus citrinellus |gambusia affinis |nomascus leucogenys |rhinopithecus roxellana |\n|amphiprion ocellaris |gasterosteus aculeatus |ochotona princeps |saimiri boliviensis boliviensis|\n|amphiprion percula |gorilla gorilla |octodon degus |scleropages formosus |\n|anabas testudineus |haplochromis burtoni |oreochromis niloticus |scophthalmus maximus |\n|anas platyrhynchos |heterocephalus glaber female|oryctolagus cuniculus |seriola dumerili |\n|anolis carolinensis |heterocephalus glaber male |oryzias latipes hni |seriola lalandi dorsalis |\n|aotus nancymaae |hippocampus comes |oryzias latipes hsok |sorex araneus |\n|astatotilapia calliptera |homo sapiens |oryzias latipes |stegastes partitus |\n|astyanax mexicanus |ictalurus punctatus |oryzias melastigma |sus scrofa |\n|bos taurus |ictidomys tridecemlineatus |otolemur garnettii |taeniopygia guttata |\n|callithrix jacchus |jaculus jaculus |ovis aries |takifugu rubripes |\n|canis familiaris |kryptolebias marmoratus |pan paniscus |tetraodon nigroviridis |\n|capra hircus |labrus bergylta |pan troglodytes |tupaia belangeri |\n|carlito syrichta |lepisosteus oculatus |panthera pardus |tursiops truncatus |\n|cavia aperea |loxodonta africana |panthera tigris altaica |vicugna pacos |\n|cavia porcellus |macaca fascicularis |papio anubis |xiphophorus couchianus |\n|cebus capucinus |macaca mulatta |paramormyrops kingsleyae |xiphophorus maculatus |\n|cercocebus atys |macaca nemestrina |pelodiscus sinensis | |\n|chinchilla lanigera |mandrillus leucophaeus |periophthalmus magnuspinnatus | |\n|chlorocebus sabaeus |mastacembelus armatus |peromyscus maniculatus bairdii| |\n|choloepus hoffmanni |maylandia zebra |poecilia formosa | |\n|colobus angolensis palliatus|meleagris gallopavo |poecilia latipinna | |\n|cricetulus griseus chok1gshd|mesocricetus auratus |poecilia mexicana | |\n|cricetulus griseus crigri |microcebus murinus |poecilia reticulata | |\n|cynoglossus semilaevis |microtus ochrogaster |pongo abelii | |\n|cyprinodon variegatus |mola mola |procavia capensis | |\n|danio rerio |monopterus albus |propithecus coquereli | |\n|dasypus novemcinctus |mus caroli |pteropus vampyrus | |\n|dipodomys ordii |mus musculus |pundamilia nyererei | |\n|echinops telfairi |mus pahari |pygocentrus nattereri | |\n|equus caballus |mus spretus | | |\n|erinaceus europaeus |mustela putorius furo | | |\n|esox lucius |myotis lucifugus | | |\n|felis catus | | | |\n|ficedula albicollis | | | |\n|fukomys damarensis | | | |\n|fundulus heteroclitus | | | |\n\n\n\n## 1.3 Experimental data\n\nThe TFBS footprinting method computationally predicts transcription factor binding sites (TFBSs) in a target species (e.g., homo sapiens, chimpanzee, mouse, zebrafish, etc.) using 575 position weight matrices (PWMs) based on binding data from the JASPAR database. Additional experimental data from a variety of sources is used to support or detract from these predictions:\n\n- Sequence conservation in homologous vertebrate species DNA sequences\n- proximity to CAGE-supported transcription start sites (TSSs)\n- correlation of expression between target gene and predicted\n transcription factor (TF) across 1800+ samples\n- proximity to ChIP-Seq determined TFBSs (GTRD project)\n- proximity to qualitative trait loci (eQTLs) affecting expression of\n the target gene (GTEX project)\n- proximity to CpGs\n- proximity to ATAC-Seq peaks (ENCODE project)\n\n## 1.4 Ensembl transcript-ids\n\nIn order to incorporate several of the experimental datapoints, and for ease of use, the Ensembl transcript ID was chosen as the primary identifier around which TFBS_footprinting analyses would revolve. This allows users to predict TFBSs in the promoters any of 1-80,000 human protein coding transcripts in the Ensembl database, and incorporate expression data from the FANTOM project, and eQTLS from the GTEx project, which has been assigned to these IDs. TFBS predictions can also be made for 123 unique non-human species (including model organisms such as mouse and zebrafish).\n\n\n# 2. Installation\n\nA video tutorial on how to install the TFBS_footprinting tool and run sample analyses is available:\n\n[](https://www.youtube.com/watch?v=tJaLHKIhksU)\n\n\n## 2.1 Conda installation (recommended)\n\nThe TFBS_footprinting package can be installed directly to your linux system using [Conda](https://anaconda.org/thirtysix/tfbs-footprinting3).\n\n1. Create a conda environment based on python version 3.8, named 'tfbs':\n\n`$ conda create -n tfbs python=3.8`\n\n2. Activate the created conda environment:\n\n`$ conda activate tfbs`\n\n3. Install the TFBS_footprinting3 tool:\n\n`$ conda install -c thirtysix tfbs-footprinting3 -c conda-forge`\n\n4. Install wget with pip:\n\n`$ pip install wget`\n\n## 2.2 Pypi installation\n\nThe TFBS_footprinting package can be installed directly to your linux system using [PIP](https://pip.pypa.io/en/stable/installing/) install.\n\n`$ pip install tfbs_footprinting3`\n\n## 2.3 Docker installation (Deprecated, uses Python 2.7)\n\nTFBS_footprinting is now available in a [Docker image](https://hub.docker.com/r/thirtysix/tfbs_footprinting/) which already contains all of the software requirements. This can be used on both Linux and Windows systems.\n\n`$ docker pull thirtysix/tfbs_footprinting`\n\nThe Docker installation will have a default RAM allocation that is too low (\\~2GB) to run TFBS_footprinting. This setting should be changed to \\>6144MB. In Windows this can be adjusted by navigating through: Docker system tray icon\\>Settings\\>Advanced\\>Memory. After changing this value, Docker will restart, which could take several minutes.\n\n## 2.4 Requirements\n\nThese requirements are automatically installed by Conda and the PIP installer, and are already present in the Docker image:\n- biopython\n- numpy\n- matplotlib\n- httplib2\n- msgpack\n- wget\n\n# 3. Input\n\n## 3.1 CSV of Ensembl transcript\n### IDs and arguments \nIn this first option a .csv table of Ensembl transcript IDs and optional arguments is used. Except for the first column indicating the Ensembl transcript id, any argument can be left blank which will result in the default value being used. An example of this file is included in the sample_analysis folder and can be downloaded from [Github](https://github.com/thirtysix/TFBS_footprinting/blob/master/sample_analysis/sample_analysis_list.csv).\n\n\n\n## 3.2 Text file of transcript IDs\n\nIn this second option a simple text-file of Ensembl transcript IDs is used. Whatever arguments are provided to the command-line will be applied to analysis of all transcripts indicated in this file. An example of this file is included in the sample_analysis folder and can be downloaded from [Github](https://github.com/thirtysix/TFBS_footprinting/blob/master/sample_analysis/sample_ensembl_ids.txt).\n\n\n\n## 3.3 Text file TF IDs\n\nA file of JASPAR TF IDs can be provided which will limit the analysis of TFs to just those contained within. If no file name is provided then the analysis will use all 575 JASPAR TFs in the analysis, in this case the results in the output table can be filtered to just those TFs you wish to focus on. An example of this file, which contains all JASPAR TF IDs, is included in the sample_analysis folder which can be downloaded from [Github](https://github.com/thirtysix/TFBS_footprinting/blob/master/sample_analysis/sample_jaspar_tf_ids.txt).\n\n\n\n# 4. Output\n\n## 4.1 Promoter Figure\n\n- **Output name format**\n \\[Ensembl_transcript_id\\]\\[nt_before_TSS\\]\\[nt_after_TSS\\]\\[species_group\\]\\[species_coverage\\]\\[pvalue\\].Promoterhisto.svg.\n\n\n\n- **Figure Title (left)** - Ensembl gene name and Transcript ID.\n- **Predicted TFBSs** - Depicts the region analyzed in this analysis.\n Bars displayed on the positive y-axis indicate TFBS predictions made on the positive (+) DNA strand. The legend of colors is located directly above, and correlates colors to the TF which is predicted to bind. Combined affinity score is the summation of scores for the seven characteristics scored by the TFBS Footprinting tool. Using the x-axis values at the bottom of the figure, the x-axis indicates nucleotide position relative to the TSS (e.g., -1000 is 1000 nt upstream of the TSS).\n - **TF Expression Correlation** - For the TFs with the highest combined affinity scores, the correlation of expression with the target gene has been determined and is presented in descending order of log-likelihood score. The color legend is the same as the Predicted TFBSs subplot, and is located at the top of the figure.\n- **Conservation** - A measure of the conservation at each position.\n- **CpG Observed/Expected** - Indidents of CpG (Cytosine-Phosphate-Guanine) are indicated with a vertical black line. A line plot in red indicates the ratio of actual to expected CpGs (by chance alone) in a 200 nt window.\n- **eQTLs** - Locations of eQTLs identified in the [gTEX project](https://www.gtexportal.org/home/) which affect the target gene. Green bars on the positive y-axis indicate eQTLs assocaiate with enhanced expression of the target gene, while red bars on the negative y-axis indicate those associated with reduced expression. The magnitude of the bars indicates the projected effect on gene expression.\n- **TFBS Meta Clusters** - Locations of TFBS metaclusters representing clusters of experimentally identifed (ENCODE and SRA databases) TFBSs which have been compiled by the [GTRD project](http://gtrd.biouml.org/).\n- **ATAC-Seq** - Locations of ATAC-Seq peaks identified by ENCODE experiments representing open chromatin.\n- **CAGE peaks (TSSs)** - Locations of TSSs identified by CAGE in the [FANTOM project](http://fantom.gsc.riken.jp/).\n\n## 4.2 Table of predictions\n\nAll predicted TFBSs for target transcript, filtered by p-value threshold and sorted by combined affinity score (TFBSs_found.sortedclusters.csv).\n\n- **binding prot** - Gene name of protein predicted to bind.\n- **motif** - DNA sequence of target species which is predicted to be bound by the binding protein.\n- **strand** - Positive or negative strand of DNA.\n- **start** - Location in target species DNA sequence of the start of the motif.\n- **end** - Location in target species DNA sequence of the end of the motif.\n- **TSS-relative start** - Location relative to the TSS of the start of the motif.\n- **TSS-relative end** - Location relative to the TSS of the end of the motif.\n- **PWM score** - Log-likelihood score of the prediction of the binding of the TF.\n- **p-value** - P-value corresponding to the frame score.\n- **combined affinity score** - Summation of all scores for this motif/prediction.\n- **species weights sum** - Summation of log-likelihood scores for GERP peaks near the predicted TFBS.\n- **cage weights sum** - Summation of log-likehood scores for the CAGE peaks near the predicted TFBS.\n- **eqtls weights sum** - Summation of log-likehood scores for the eQTLs peaks near the predicted TFBS.\n- **atac weights sum** - Summation of log-likehood scores for the ATAC-Seq peaks near the predicted TFBS.\n- **metacluster weights sum** - Summation of log-likehood scores for the metacluster peaks near the predicted TFBS.\n- **cpg weight** - Log-likehood score for the CpG obs/exp ratio at the center of the predicted TFBS.\n- **corr weight sum** - Summation of log-likehood scores for correlations of expression between transcripts of the predicted TF and those of the target gene.\n\n## 4.3 Additional outputs\n\n- Original target organism target transcript DNA sequence as retrieved from Ensembl (alignment_uncleaned.fasta).\n- Cleaned alignment (alignment_cleaned.fasta).\n- Regulatory information for the target transcripts user-defined promoter region (regulatory_decoded.json).\n- Transcript properties for target transcript (transcript_dict.json).\n- All predicted TFBSs for the target species which satisfy p-value threshold (TFBSs_found.all.json).\n\n# 5. Examples\n\n## 5.1 TFBS_footprinter3 Use Examples\n**Running the example analyses**\n- Change current directory to example directory (can be downloaded directly from this Github repository)\n\n > `$ cd PATH_TO/example`\n\n- Run the example analysis using a .csv of arguments:\n\n > `$ tfbs_footprinter3 -t sample_csv.csv`\n\n- Run the sample analysis using a .txt of Ensembl transcript ids, and minimal arguments:\n\n > `$ tfbs_footprinter3 -t sample_ids.txt`\n\n- Run the sample analysis using a .txt of Ensembl transcript ids, and all arguments:\n\n > `$ tfbs_footprinter3 -t sample_ids.txt -tfs jaspar_tf_ids_selected.txt -pb 900 -pa 100 -tx 10 -p 0.01 -pc 0.01 -update`\n\n## 5.2 TFBS_footprinter3 Use Examples (within Docker; deprecated, uses Python 2.7)\n**Running the sample analyses**\n1. Within Docker we first need to mount a volume so that the results of the analyis can be viewed on our host computer. It is recommended that you create an empty directory on your host computer:\n\n > `$ docker run -v /ABSOLUTE_PATH_TO/EMPTY_DIR_ON_HOST:/home/sample_analysis/tfbs_results -it thirtysix/tfbs_footprinting bash`\n\n2. Then we move into the pre-existing sample analysis directory in the Docker container to perform the analysis there so that the results generated there will automatically appear in the designated location on our host computer:\n\n > `$ cd ./sample_analysis`\n\n3. Then we can run the sample analysis in Docker in the same way that we would normally use tfbs_footprinter3 (above), e.g., using a .csv of arguments:\n\n > `$ tfbs_footprinter3 -t ./sample_analysis_list.csv`\n\n- Or (again, as above) using a .txt of Ensembl transcript ids, and minimal arguments:\n\n > `$tfbs_footprinter3 -t ./sample_ensembl_ids.txt`\n\n- Or (again, as above) using a .txt of Ensembl transcript ids, and multiple arguments:\n\n > `$ tfbs_footprinter3 -t ./sample_ensembl_ids.txt -tfs ./sample_jaspar_tf_ids.txt -pb 900 -pa 100 -tx 10 -update`\n\n### Example using user-defined files/arguments\n\n1. Within Docker we first need to mount a volume so that we can load your analysis files from your host computer into docker AND save the results of the analysis on our host computer:\n\n > `$ docker run -v /ABSOLUTE_PATH_TO/DIR_ON_HOST/CONTAINING_ANALYSIS_FILES:/home/analysis_dir -it thirtysix/tfbs_footprinting bash`\n\n2. Then we move into your analysis directory in the Docker container to perform the analysis there so that the results generated there will automatically appear in the designated location on our host computer:\n\n > `$ cd ./analysis_dir`\n\n3. Then we can run the sample analysis in Docker in the same way that we would normally use tfbs_footprinter3 (above), e.g., using a .csv of arguments:\n\n > `$ tfbs_footprinter3 -t ./USER_TABLE_OF_ENSEMBL_IDS_AND_ARGS.csv`\n\n- Or (again, as above) using a .txt of Ensembl transcript ids, and minimal arguments:\n\n > `$ tfbs_footprinter3 -t ./USER_LIST_OF_ENSEMBL_IDS.txt`\n\n- Or (again, as above) using a .txt of Ensembl transcript ids, and multiple arguments:\n\n > `$ tfbs_footprinter3 -t ./USER_LIST_OF_ENSEMBL_IDS.txt -tfs ./USER_LIST_OF_TF_NAMES.txt -s homo_sapiens -g mammals -e low -pb 900 -pa 100 -tx 10 -o PATH_TO/Results/ -update`\n\n## 5.3 Update experimental data files\n\nCheck the documentation on [ReadTheDocs](https://tfbs-footprinting.readthedocs.io/en/latest/) for new releases.\n\n> `$ tfbs_footprinter3 -update`\n\n# 6. Parameters\n\n**arguments:**\n- **\\-h, --help**\nshow this help message and exit.\n\n- **\\-\\-t_ids_file , -t**\nRequired for running an analysis. Location of a file containing Ensembl target_species transcript ids. Input options are either a text file of Ensembl transcript ids or a .csv file with individual values set for each parameter.\n\n- **\\-\\-tf_ids_file , -tfs**\nOptional: Location of a file containing a limited list of Jaspar TFs to use in scoring DNA sequence (see sample file tf_ids.txt at https://github.com/thirtysix/TFBS_footprinting) [default: all Jaspar TFs].\n\n- **\\-\\-promoter_before_tss , -pb** \n(0-100,000) [default: 900] - Number (integer) of nucleotides upstream of TSS to include in analysis. If this number is negative the start point will be downstream of the TSS, the end point will then need to be further downstream.\n\n- **\\-\\-promoter_after_tss , -pa** \n(0-100,000) [default: 100] - Number (integer) of nucleotides downstream of TSS to include in analysis. If this number is negative the end point will be upstream of the TSS. The start point will then need to be further upstream.\n\n- **\\-\\-top_x_tfs , -tx** \n(1-20) [default: 10] - Number (integer) of unique TFs to include in output .svg figure.\n\n- **\\-\\-pval, -p** \nPVAL P-value (float) for PWM score cutoff (range: 1 (all results) to 0.0000001; in divisions of 10 (i.e. 1, 0.1, 0.01, 0.001 etc.) [default: 0.01].\n\n- **\\-\\-pvalc, -pc**\nP-value (float) for PWM score cutoff (range: 1 (all results) to 0.0000001; in divisions of 10 (i.e. 1, 0.1, 0.01, 0.001 etc.) [default: 0.01].\n\n- **\\-\\-exp_data_update, -update**\nDownload the latest experimental data files for use in analysis. Will run automatically if the \"data\" directory does not already exist (e.g., first usage).\n\n- **\\-\\-nofig, -no**\nDon't output a figure.\n\n\n# 7. Process\n\n## 7.1 Steps\n### Iterate through each user provided Ensembl transcript id:\n\n**1. Retrieve user-defined DNA sequence region from Ensembl** for promoter of user-provided transcript id, between user-defined TSS-relative start/stop sites.\n\n**2. Generate position weight matrices (PWMs)** from Jaspar position frequency matrices (PFMs). \n\n**3. Score target species DNA sequence** using either all or a user-defined list of PWMs.\n\n**4. Keep predictions with a log-likelihood score greater** than score threshold corresponding to p-value of 0.01, or user-defined p-value. \n\n**5. Generate log-likelihood each of the following for the target DNA sequence region**:\n\n- DNA sequence conservation in homologous vertebrate species DNA sequences\n\n- proximity to CAGE-supported transcription start sites (TSSs)\n\n- correlation of expression between target gene and predicted transcription factor (TF) across 1800 samples\n\n- proximity to ChIP-Seq determined TFBSs (GTRD project)\n\n- proximity to qualitative trait loci (eQTLs) affecting expression of the target gene (GTEX project)\n\n- proximity to CpGs\n\n- proximity to ATAC-Seq peaks (ENCODE project) \n\n**6. Compute 'combined affinity score'** as a sum of scores for all experimental data. \n\n**7. Output predictions table** \n\n**8. Output a vector graphics figure** showing the top 10 (or user-defined) unique TFs mapped onto the promoter of the target transcript, and additional output as described below.\n\n\n\n# 8. Troubleshooting\n\n## 9.1 Log file\n\nThe first step in troubleshooting any possible errors that might arise is to check the log file. The log file is created in the directory where you initiated the analysis, and it is named \\'TFBS_footprinter3.log\\'.\n\n**Many relevant events are logged there instead of output to terminal:**\n- start time of analysis\n- arguments/settings used in analysis\n- full queries made to the Ensembl REST system\n- warnings from Ensembl REST system regarding exceeding of rate limit\n- if given transcript ids are not in the Ensembl system (possibly misformed or deprecated)\n- if experimental data used in TFBS prediction has been downloaded\n- if there was an error in downloading experimental data\n- if results already exist for the current analysis, which are then loaded\n- total time of analysis\n- if there was an error in retrieving an alignment for the defined region\n- if the transcript information file already exists\n- if the transcript regulatory information file already exists\n\n## 9.2 Docker (Deprecated, uses Python 2.7)\n\nThe Docker installation will have a default RAM allocation that is too low (\\~2GB) to run TFBS_footprinting. This setting should be changed to \\>6144MB.\n\nIn Windows this can be adjusted by navigating through:\n\n**Docker system tray icon\\>Settings\\>Advanced\\>Memory**.\n\nAfter changing this value Docker will restart, which could take several minutes. If the allocated memory is too low, then the Docker image will terminate and you will see the `$ killed` message in the console.\n\n",
"bugtrack_url": null,
"license": "MIT",
"summary": "Tool for identifying conserved TFBSs in vertebrate species.",
"version": "0.0.5",
"project_urls": {
"Homepage": "https://github.com/thirtysix/TFBS_footprinting3"
},
"split_keywords": [
"bioinformatics",
"analysis"
],
"urls": [
{
"comment_text": "",
"digests": {
"blake2b_256": "a1cd6b2353f1cff80e5592de477a3cb7de49e8509f6577ac731bd461e9c398a0",
"md5": "3e679d96a492de3aa0e308729a78719a",
"sha256": "3eb2bde4e0792ce0bf980e347f9bb387db38ca7a6cb710d95eb7d86f2b0ea6f5"
},
"downloads": -1,
"filename": "TFBS_footprinting3-0.0.5-py3-none-any.whl",
"has_sig": false,
"md5_digest": "3e679d96a492de3aa0e308729a78719a",
"packagetype": "bdist_wheel",
"python_version": "py3",
"requires_python": null,
"size": 147449,
"upload_time": "2023-11-14T19:25:59",
"upload_time_iso_8601": "2023-11-14T19:25:59.867675Z",
"url": "https://files.pythonhosted.org/packages/a1/cd/6b2353f1cff80e5592de477a3cb7de49e8509f6577ac731bd461e9c398a0/TFBS_footprinting3-0.0.5-py3-none-any.whl",
"yanked": false,
"yanked_reason": null
},
{
"comment_text": "",
"digests": {
"blake2b_256": "e7514ddec91398719060f2756891ec2cd44abb689d0521b9819a2f953f5da768",
"md5": "5eec879f385a07d6b7d912ab4f792808",
"sha256": "a473549019c910f61689723eee5cff2835d2dddd89399ea92b1aea074e056037"
},
"downloads": -1,
"filename": "TFBS_footprinting3-0.0.5.tar.gz",
"has_sig": false,
"md5_digest": "5eec879f385a07d6b7d912ab4f792808",
"packagetype": "sdist",
"python_version": "source",
"requires_python": null,
"size": 3886991,
"upload_time": "2023-11-14T19:26:08",
"upload_time_iso_8601": "2023-11-14T19:26:08.212065Z",
"url": "https://files.pythonhosted.org/packages/e7/51/4ddec91398719060f2756891ec2cd44abb689d0521b9819a2f953f5da768/TFBS_footprinting3-0.0.5.tar.gz",
"yanked": false,
"yanked_reason": null
}
],
"upload_time": "2023-11-14 19:26:08",
"github": true,
"gitlab": false,
"bitbucket": false,
"codeberg": false,
"github_user": "thirtysix",
"github_project": "TFBS_footprinting3",
"travis_ci": false,
"coveralls": false,
"github_actions": false,
"lcname": "tfbs-footprinting3"
}

