# Bar Chart Race
[](https://pypi.org/project/bar_chart_race)
[](LICENSE)
Make animated bar chart races in Python with matplotlib.
## Official Documentation
Visit the [bar_chart_race official documentation](https://www.dexplo.org/bar_chart_race) for detailed usage instructions.
## Installation
Install with either:
* `pip install bar_chart_race`
* `conda install -c conda-forge bar_chart_race`
## Quickstart
Must begin with a pandas DataFrame containing 'wide' data where:
* Every row represents a single period of time
* Each column holds the value for a particular category
* The index contains the time component (optional)
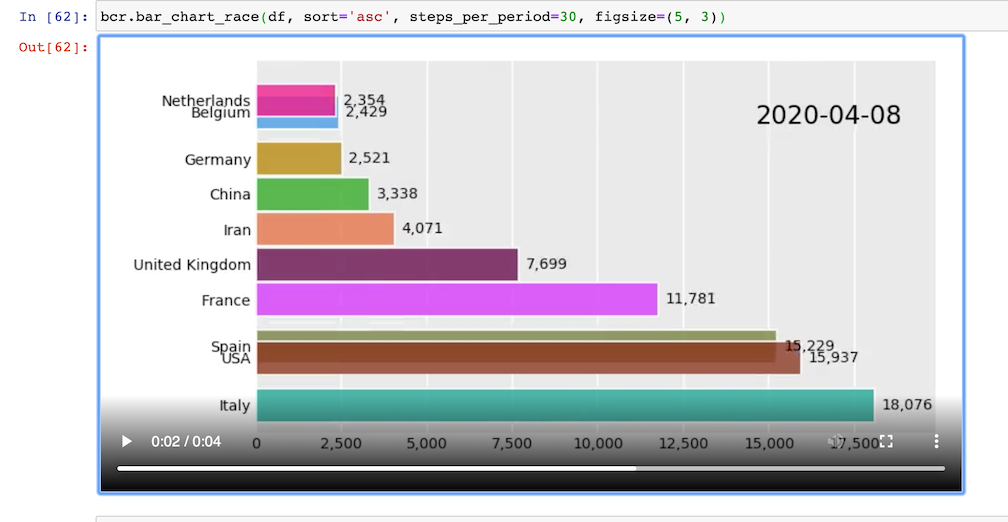
The data below is an example of properly formatted data. It shows total deaths from COVID-19 for several countries by date.

### Main function - `bar_chart_race`
There is one main function, **`bar_chart_race`**, which we use to recreate the above video. All parameters are shown with their default value except for `filename` and `title`.
```python
import bar_chart_race as bcr
df = bcr.load_dataset('covid19_tutorial')
bcr.bar_chart_race(
df=df,
filename='covid19_horiz.mp4',
orientation='h',
sort='desc',
n_bars=6,
fixed_order=False,
fixed_max=True,
steps_per_period=10,
interpolate_period=False,
label_bars=True,
bar_size=.95,
period_label={'x': .99, 'y': .25, 'ha': 'right', 'va': 'center'},
period_fmt='%B %d, %Y',
period_summary_func=lambda v, r: {'x': .99, 'y': .18,
's': f'Total deaths: {v.nlargest(6).sum():,.0f}',
'ha': 'right', 'size': 8, 'family': 'Courier New'},
perpendicular_bar_func='median',
period_length=500,
figsize=(5, 3),
dpi=144,
cmap='dark12',
title='COVID-19 Deaths by Country',
title_size='',
bar_label_size=7,
tick_label_size=7,
shared_fontdict={'family' : 'Helvetica', 'color' : '.1'},
scale='linear',
writer=None,
fig=None,
bar_kwargs={'alpha': .7},
filter_column_colors=False)
```
### Save animation to disk or return HTML
Leave the `filename` parameter as `None` to return the animation as HTML. If you are running a Jupyter Notebook, it will automatically be embedded into it.
```python
bcr.bar_chart_race(df=df, filename=None)
```
### Customization
There are many options to customize the bar chart race to get the animation you desire. Below, we have an animation where the maximum x-value and order of the bars are set for the entire duration. A custom summary label and perpendicular bar of median is also added.
```python
def period_summary(values, ranks):
top2 = values.nlargest(2)
leader = top2.index[0]
lead = top2.iloc[0] - top2.iloc[1]
s = f'{leader} by {lead:.0f}'
return {'s': s, 'x': .95, 'y': .07, 'ha': 'right', 'size': 8}
bcr.bar_chart_race(df_baseball, period_length=1000,
fixed_max=True, fixed_order=True, n_bars=10,
figsize=(5, 3), period_fmt='Season {x:,.0f}',
title='Top 10 Home Run Hitters by Season Played')
```

Raw data
{
"_id": null,
"home_page": "https://github.com/dexplo/bar_chart_race",
"name": "bar-chart-race",
"maintainer": "",
"docs_url": null,
"requires_python": ">=3.6",
"maintainer_email": "",
"keywords": "visualization animation bar chart race matplotlib pandas",
"author": "Ted Petrou",
"author_email": "petrou.theodore@gmail.com",
"download_url": "https://files.pythonhosted.org/packages/95/de/a7143a557e82e28310f4ca6eb7d42f6bfd76dcf7bb731ae58a41afb8b330/bar_chart_race-0.1.0.tar.gz",
"platform": "",
"description": "# Bar Chart Race\n\n[](https://pypi.org/project/bar_chart_race)\n[](LICENSE)\n\nMake animated bar chart races in Python with matplotlib.\n\n\n\n## Official Documentation\n\nVisit the [bar_chart_race official documentation](https://www.dexplo.org/bar_chart_race) for detailed usage instructions.\n\n## Installation\n\nInstall with either:\n\n* `pip install bar_chart_race`\n* `conda install -c conda-forge bar_chart_race`\n\n## Quickstart\n\nMust begin with a pandas DataFrame containing 'wide' data where:\n\n* Every row represents a single period of time\n* Each column holds the value for a particular category\n* The index contains the time component (optional)\n\nThe data below is an example of properly formatted data. It shows total deaths from COVID-19 for several countries by date.\n\n\n\n### Main function - `bar_chart_race`\n\nThere is one main function, **`bar_chart_race`**, which we use to recreate the above video. All parameters are shown with their default value except for `filename` and `title`.\n\n```python\nimport bar_chart_race as bcr\ndf = bcr.load_dataset('covid19_tutorial')\nbcr.bar_chart_race(\n df=df,\n filename='covid19_horiz.mp4',\n orientation='h',\n sort='desc',\n n_bars=6,\n fixed_order=False,\n fixed_max=True,\n steps_per_period=10,\n interpolate_period=False,\n label_bars=True,\n bar_size=.95,\n period_label={'x': .99, 'y': .25, 'ha': 'right', 'va': 'center'},\n period_fmt='%B %d, %Y',\n period_summary_func=lambda v, r: {'x': .99, 'y': .18,\n 's': f'Total deaths: {v.nlargest(6).sum():,.0f}',\n 'ha': 'right', 'size': 8, 'family': 'Courier New'},\n perpendicular_bar_func='median',\n period_length=500,\n figsize=(5, 3),\n dpi=144,\n cmap='dark12',\n title='COVID-19 Deaths by Country',\n title_size='',\n bar_label_size=7,\n tick_label_size=7,\n shared_fontdict={'family' : 'Helvetica', 'color' : '.1'},\n scale='linear',\n writer=None,\n fig=None,\n bar_kwargs={'alpha': .7},\n filter_column_colors=False) \n```\n\n### Save animation to disk or return HTML\n\nLeave the `filename` parameter as `None` to return the animation as HTML. If you are running a Jupyter Notebook, it will automatically be embedded into it.\n\n```python\nbcr.bar_chart_race(df=df, filename=None)\n```\n\n\n\n### Customization\n\nThere are many options to customize the bar chart race to get the animation you desire. Below, we have an animation where the maximum x-value and order of the bars are set for the entire duration. A custom summary label and perpendicular bar of median is also added.\n\n```python\ndef period_summary(values, ranks):\n top2 = values.nlargest(2)\n leader = top2.index[0]\n lead = top2.iloc[0] - top2.iloc[1]\n s = f'{leader} by {lead:.0f}'\n return {'s': s, 'x': .95, 'y': .07, 'ha': 'right', 'size': 8}\n\nbcr.bar_chart_race(df_baseball, period_length=1000,\n fixed_max=True, fixed_order=True, n_bars=10,\n figsize=(5, 3), period_fmt='Season {x:,.0f}',\n title='Top 10 Home Run Hitters by Season Played')\n```\n\n\n\n",
"bugtrack_url": null,
"license": "MIT",
"summary": "Create animated bar chart races using matplotlib",
"version": "0.1.0",
"project_urls": {
"Homepage": "https://github.com/dexplo/bar_chart_race"
},
"split_keywords": [
"visualization",
"animation",
"bar",
"chart",
"race",
"matplotlib",
"pandas"
],
"urls": [
{
"comment_text": "",
"digests": {
"blake2b_256": "0901f6d1a1a0978b39560843c54be7349804d7d2faef0a869acd7c8a6fc920b0",
"md5": "33ba1654364d291b09ecdd5117338460",
"sha256": "e5233f3e4e92029e02d2c0ef8de89c16eed384ab07f9a7413041b5d2122477df"
},
"downloads": -1,
"filename": "bar_chart_race-0.1.0-py3-none-any.whl",
"has_sig": false,
"md5_digest": "33ba1654364d291b09ecdd5117338460",
"packagetype": "bdist_wheel",
"python_version": "py3",
"requires_python": ">=3.6",
"size": 156823,
"upload_time": "2020-06-01T15:36:42",
"upload_time_iso_8601": "2020-06-01T15:36:42.643211Z",
"url": "https://files.pythonhosted.org/packages/09/01/f6d1a1a0978b39560843c54be7349804d7d2faef0a869acd7c8a6fc920b0/bar_chart_race-0.1.0-py3-none-any.whl",
"yanked": false,
"yanked_reason": null
},
{
"comment_text": "",
"digests": {
"blake2b_256": "95dea7143a557e82e28310f4ca6eb7d42f6bfd76dcf7bb731ae58a41afb8b330",
"md5": "93b4fab89700b1baec41ac6a6a75c4ac",
"sha256": "4c5554d0991548e43ce9226a28b8dae5a7f7a9955f5523ba36364d61d4701b1b"
},
"downloads": -1,
"filename": "bar_chart_race-0.1.0.tar.gz",
"has_sig": false,
"md5_digest": "93b4fab89700b1baec41ac6a6a75c4ac",
"packagetype": "sdist",
"python_version": "source",
"requires_python": ">=3.6",
"size": 154978,
"upload_time": "2020-06-01T15:36:44",
"upload_time_iso_8601": "2020-06-01T15:36:44.878784Z",
"url": "https://files.pythonhosted.org/packages/95/de/a7143a557e82e28310f4ca6eb7d42f6bfd76dcf7bb731ae58a41afb8b330/bar_chart_race-0.1.0.tar.gz",
"yanked": false,
"yanked_reason": null
}
],
"upload_time": "2020-06-01 15:36:44",
"github": true,
"gitlab": false,
"bitbucket": false,
"codeberg": false,
"github_user": "dexplo",
"github_project": "bar_chart_race",
"travis_ci": false,
"coveralls": false,
"github_actions": true,
"lcname": "bar-chart-race"
}

