# MatChart
MatChart is a convenient one-line wrapper around *matplotlib* plotting library.
## Usage
```python
from matchart import plot
plot([x1, y1], [y2], [x3, y3], y4, ...,
# common parameters
kind='plot',
show: bool = True,
block: Optional[bool] = None,
context: bool = False,
clear_on_error: bool = True,
# plotter explict parameters
label: ClippedArguments = None,
color: CycledArguments = None,
marker: ClippedArguments = None,
linestyle: ClippedArguments = None,
linewidth: ClippedArguments = None,
markersize: ClippedArguments = None,
# figure and axes parameters
legend: Optional[bool] = None,
legend_kwargs: Optional[Dict[str, Any]] = None,
title: Optional[str] = None,
title_kwargs: Optional[Dict[str, Any]] = None,
xlabel: Optional[str] = None,
xlabel_kwargs: Optional[Dict[str, Any]] = None,
ylabel: Optional[str] = None,
ylabel_kwargs: Optional[Dict[str, Any]] = None,
limit: Union[Tuple[Any, Any, Any, Any], bool] = True,
xticks: Optional[Union[Iterable, Dict[str, Any], bool]] = None,
yticks: Optional[Union[Iterable, Dict[str, Any], bool]] = None,
ticks: Optional[Dict[str, Union[Iterable, Dict[str, Any], bool]]] = None,
figsize: Tuple[float, float] = (10, 8),
dpi: float = 100,
subplots_kwargs: Optional[Dict[str, Any]] = None,
grid: Optional[bool] = False,
grid_kwargs: Optional[Dict[str, Any]] = None,
theme = 'seaborn-v0_8-deep',
# plotter rest parameters
** plotter_kwargs
) -> Tuple[Figure, Axes, List[Artist]]
```
`kind` - pyplot [function name](https://matplotlib.org/stable/plot_types/index.html), e.g. _plot_ or _scatter_.
`show` - whether to show plot or just to draw it.
`block` - whether to block running code when showing plot or just display windows and run next lines. By default, detected from environment.
`context` - delay showing plot by using context manager (see below).
`clear_on_error` - whether to clean up on any error.
`label`, `color`, `marker`, `linestyle`, `linewidth`, `markersize` and rest `plotter_kwargs` - plotter parameters. Can differ per kind. See [common parameters](https://matplotlib.org/stable/api/_as_gen/matplotlib.pyplot.plot.html) for `kind='plot'`. Can be `list` or `tuple` to define per-dataset values. Values can also be `None` or even clipped to skip definition for particular dataset.
`legend` - set `True`, `False` or `None` to autodetect. `legend_kwargs` - [additional parameters](https://matplotlib.org/stable/api/_as_gen/matplotlib.axes.Axes.legend.html).
`title` - plot's title. `title_kwargs` - [additional parameters](https://matplotlib.org/stable/api/_as_gen/matplotlib.axes.Axes.set_title.html).
`xlabel` - horizontal axis label. `xlabel_kwargs` - [additional parameters](https://matplotlib.org/stable/api/_as_gen/matplotlib.axes.Axes.set_xlabel.html).
`ylabel` - vertical axis label. `ylabel_kwargs` - [additional parameters](https://matplotlib.org/stable/api/_as_gen/matplotlib.axes.Axes.set_ylabel.html).
`limit` - set `True` to autodetect 2D plot's borders or `False` to use default matplot's behaviour. Set to `(left, right, bottom, top)` to use [custom borders](https://matplotlib.org/stable/api/_as_gen/matplotlib.axes.Axes.set_ylim.html).
`ticks`, `xticks`, `yticks` - set [corresponding ticks](https://matplotlib.org/stable/api/_as_gen/matplotlib.pyplot.xticks.html). Can be `False` to disable ticks. Can be dictionary of kwargs. Can be array-like value to define ticks locations. Argument `xticks` defines ticks for X axis, `yticks` - for Y axis. Alternatively argument `ticks` can be defined as dictionary with keys `'x'` or `'y'` containing same values as `xticks` and `yticks` arguments. Argument `xticks` must be used solely.
`figsize` - plot's size as `(width, height)` in inches. By default, is overriden with *10x8*.
`dpi` - plot's resolution in dots-per-inch.
`subplots_kwargs` - [additional plot's parameters](https://matplotlib.org/stable/api/_as_gen/matplotlib.pyplot.subplots.html) and [Figure's parameters](https://matplotlib.org/stable/api/_as_gen/matplotlib.pyplot.figure.html#matplotlib.pyplot.figure).
`grid` - plot's [grid visibility](https://matplotlib.org/stable/api/_as_gen/matplotlib.pyplot.grid.html) with `grid_kwargs` as additional parameters.
`theme` - plot's [style](https://matplotlib.org/stable/api/style_api.html#matplotlib.style.use). By default is overriden with *seaborn-v0_8-deep*.
## Examples
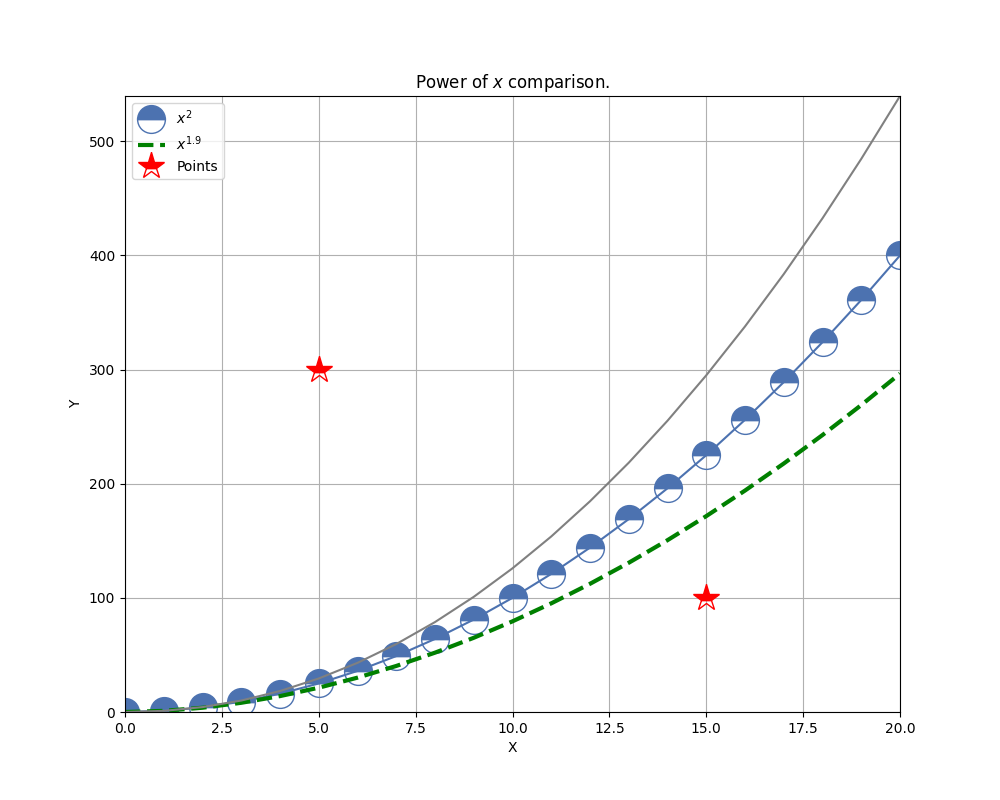
### Just plot something
Firstly prepare data:
```python
import numpy as np
x1 = np.arange(21)
y1 = x1 ** 2
y2 = x1 ** 1.9
x3 = 5, 15
y3 = 300, 100
y4 = x1 ** 2.1
```
Then plot data:
```python
from matchart import plot
plot([x1, y1], [y2], [x3, y3], y4,
label=['$x^{2}$', '$x^{1.9}$', 'Points'],
xlabel='X', ylabel='Y',
title='Power of $x$ comparison.',
grid=True,
color=[None, 'green', 'red', 'gray'],
marker=['o', None, '*'],
linestyle=[None, '--'],
linewidth=[None, 3, 0],
markersize=20,
fillstyle='top')
```
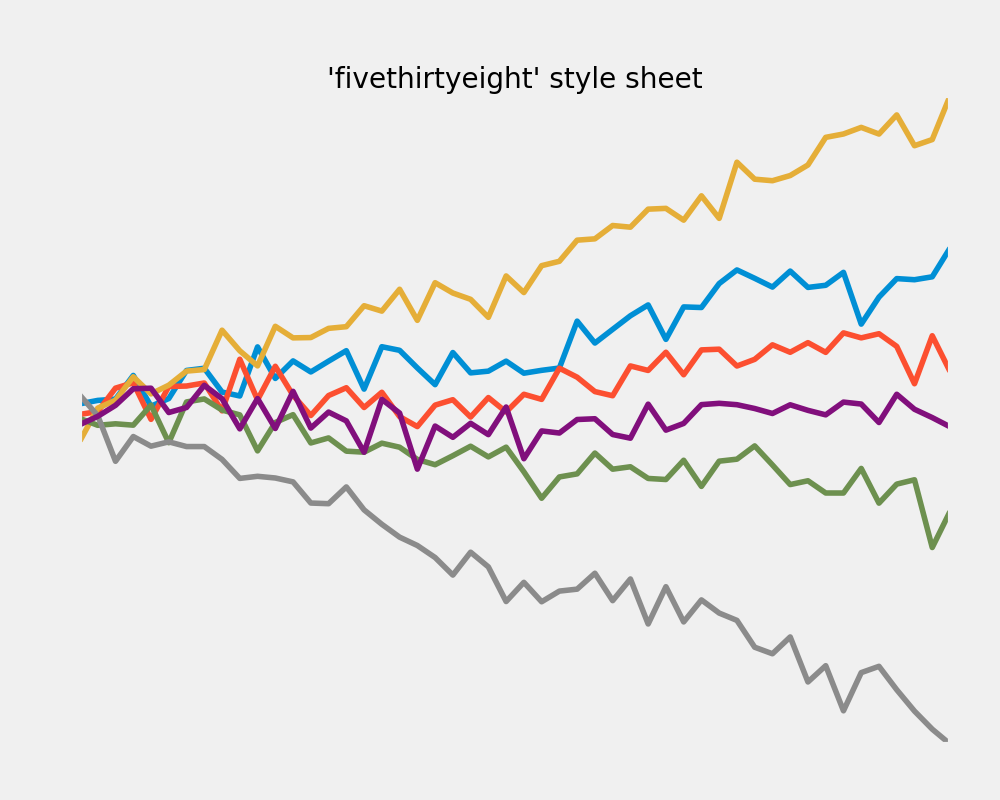
### Migrate from matplotlib simple
Let's take [FiveThirtyEight style sheet example](https://matplotlib.org/stable/gallery/style_sheets/fivethirtyeight.html#sphx-glr-gallery-style-sheets-fivethirtyeight-py):
```python
import matplotlib.pyplot as plt
import numpy as np
plt.style.use('fivethirtyeight')
x = np.linspace(0, 10)
np.random.seed(19680801) # Fixing random state for reproducibility
fig, ax = plt.subplots()
ax.plot(x, np.sin(x) + x + np.random.randn(50))
ax.plot(x, np.sin(x) + 0.5 * x + np.random.randn(50))
ax.plot(x, np.sin(x) + 2 * x + np.random.randn(50))
ax.plot(x, np.sin(x) - 0.5 * x + np.random.randn(50))
ax.plot(x, np.sin(x) - 2 * x + np.random.randn(50))
ax.plot(x, np.sin(x) + np.random.randn(50))
ax.set_title("'fivethirtyeight' style sheet")
plt.show()
```
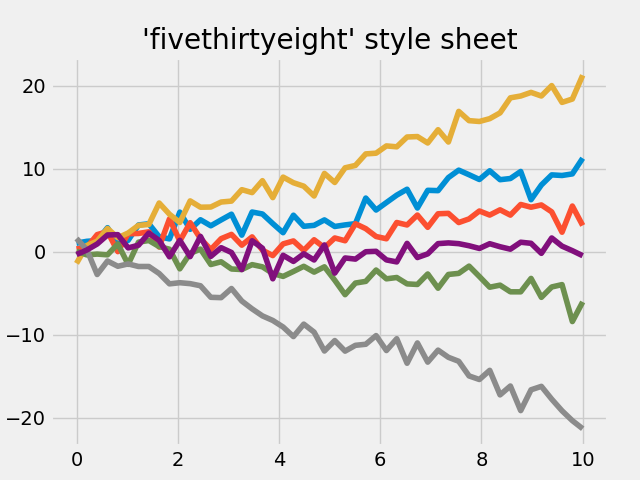
and rewrite it with MatChart:
```python
from matchart import plot
import numpy as np
x = np.linspace(0, 10)
np.random.seed(19680801) # Fixing random state for reproducibility
plot([x, np.sin(x) + x + np.random.randn(50)],
[x, np.sin(x) + 0.5 * x + np.random.randn(50)],
[x, np.sin(x) + 2 * x + np.random.randn(50)],
[x, np.sin(x) - 0.5 * x + np.random.randn(50)],
[x, np.sin(x) - 2 * x + np.random.randn(50)],
[x, np.sin(x) + np.random.randn(50)],
title="'fivethirtyeight' style sheet",
theme='fivethirtyeight')
```
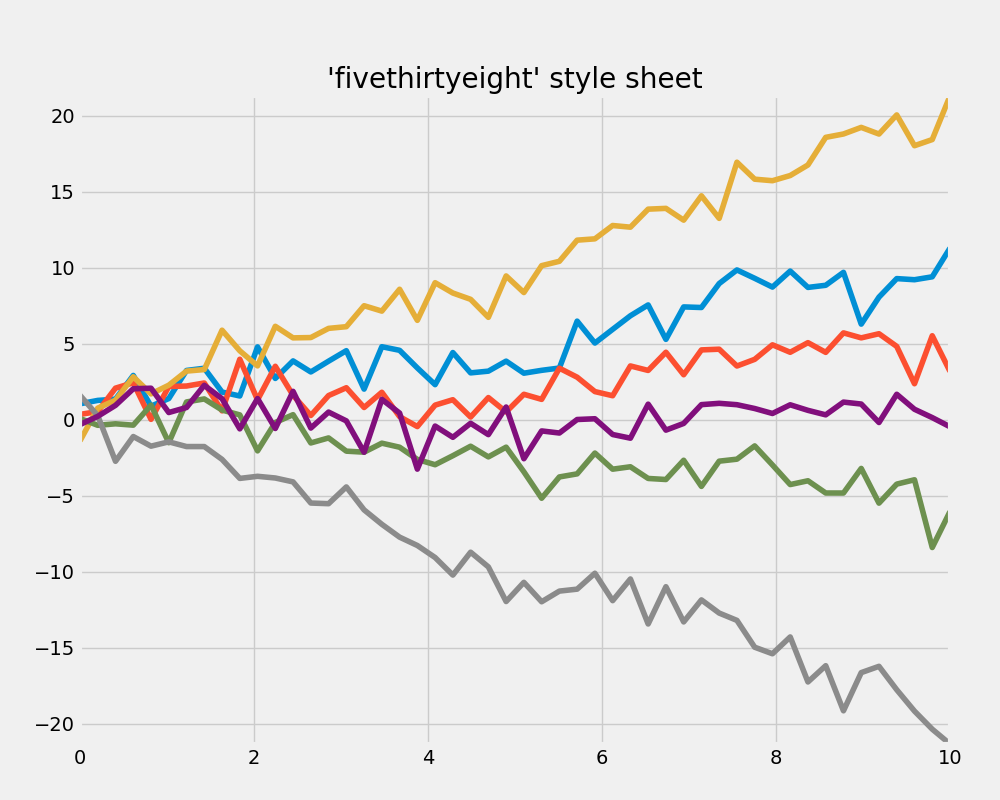
*Note that default figure size differs.*
### Migrate from matplotlib stackplot
Let's take [stackplots example](https://matplotlib.org/stable/gallery/lines_bars_and_markers/stackplot_demo.html#sphx-glr-gallery-lines-bars-and-markers-stackplot-demo-py):
```python
import matplotlib.pyplot as plt
# data from United Nations World Population Prospects (Revision 2019)
# https://population.un.org/wpp/, license: CC BY 3.0 IGO
year = [1950, 1960, 1970, 1980, 1990, 2000, 2010, 2018]
population_by_continent = {
'africa' : [228, 284, 365, 477, 631, 814, 1044, 1275],
'americas': [340, 425, 519, 619, 727, 840, 943, 1006],
'asia' : [1394, 1686, 2120, 2625, 3202, 3714, 4169, 4560],
'europe' : [220, 253, 276, 295, 310, 303, 294, 293],
'oceania' : [12, 15, 19, 22, 26, 31, 36, 39],
}
fig, ax = plt.subplots()
ax.stackplot(year, population_by_continent.values(),
labels=population_by_continent.keys(), alpha=0.8)
ax.legend(loc='upper left')
ax.set_title('World population')
ax.set_xlabel('Year')
ax.set_ylabel('Number of people (millions)')
plt.show()
```
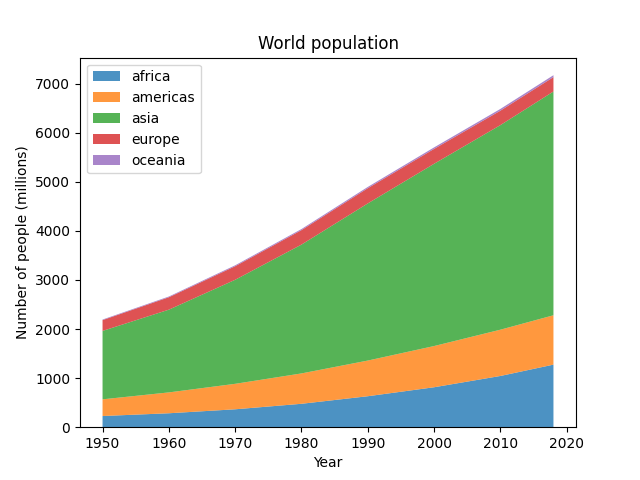
and rewrite it with MatChart:
```python
from matchart import plot
# data from United Nations World Population Prospects (Revision 2019)
# https://population.un.org/wpp/, license: CC BY 3.0 IGO
year = [1950, 1960, 1970, 1980, 1990, 2000, 2010, 2018]
population_by_continent = {
'africa' : [228, 284, 365, 477, 631, 814, 1044, 1275],
'americas': [340, 425, 519, 619, 727, 840, 943, 1006],
'asia' : [1394, 1686, 2120, 2625, 3202, 3714, 4169, 4560],
'europe' : [220, 253, 276, 295, 310, 303, 294, 293],
'oceania' : [12, 15, 19, 22, 26, 31, 36, 39],
}
plot([year, population_by_continent.values()],
kind='stackplot',
labels=population_by_continent.keys(),
alpha=0.8,
legend=True,
legend_kwargs=dict(loc='upper left'),
limit=False,
title='World population',
xlabel='Year',
ylabel='Number of people (millions)')
```
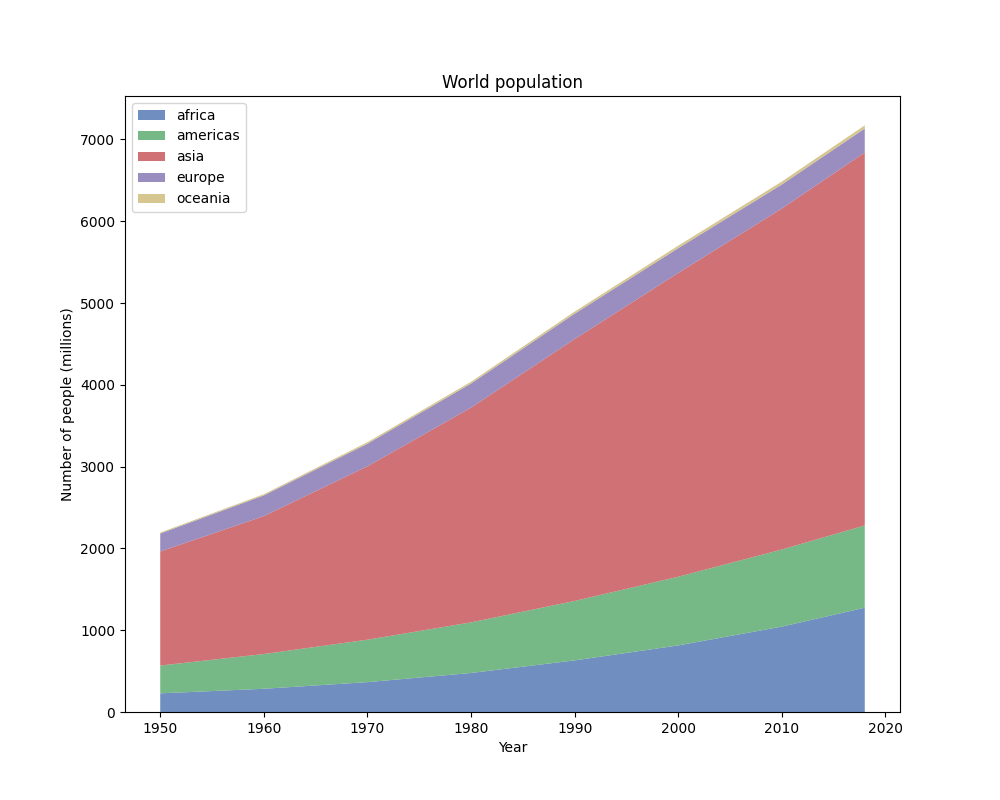
*Note that default figure size and theme differ.*
### Customization of plots
Let's take FiveThirtyEight style sheet example above and customize it before showing.
Imagine now we want to remove X and Y axes.
#### Straightforward solution (not bad)
To do the trick we can:
1. only draw plot with `show=False`;
2. customize figure with *matplotlib* stuff;
3. show plot with `matplotlib.pyplot.show()`.
```python
from matchart import plot
import numpy as np
from matplotlib import pyplot as plt
x = np.linspace(0, 10)
np.random.seed(19680801) # Fixing random state for reproducibility
fig, ax, arts = plot(
[x, np.sin(x) + x + np.random.randn(50)],
[x, np.sin(x) + 0.5 * x + np.random.randn(50)],
[x, np.sin(x) + 2 * x + np.random.randn(50)],
[x, np.sin(x) - 0.5 * x + np.random.randn(50)],
[x, np.sin(x) - 2 * x + np.random.randn(50)],
[x, np.sin(x) + np.random.randn(50)],
title="'fivethirtyeight' style sheet",
theme='fivethirtyeight',
show=False)
ax.xaxis.set_visible(False)
ax.yaxis.set_visible(False)
plt.show()
```
#### Clever solution (better)
To solve such kind of problems there is *context manager* support:
1. draw plot with `context=True`;
2. customize figure with *matplotlib* stuff within context manager.
```python
from matchart import plot
import numpy as np
x = np.linspace(0, 10)
np.random.seed(19680801) # Fixing random state for reproducibility
with plot(
[x, np.sin(x) + x + np.random.randn(50)],
[x, np.sin(x) + 0.5 * x + np.random.randn(50)],
[x, np.sin(x) + 2 * x + np.random.randn(50)],
[x, np.sin(x) - 0.5 * x + np.random.randn(50)],
[x, np.sin(x) - 2 * x + np.random.randn(50)],
[x, np.sin(x) + np.random.randn(50)],
title="'fivethirtyeight' style sheet",
theme='fivethirtyeight',
context=True) as results:
ax = results[1]
ax.xaxis.set_visible(False)
ax.yaxis.set_visible(False)
```
#### The best solution
Specially for lazy people there is special alias to be used within *context manager*:
1. draw plot with `matchart.cplot()`;
2. customize figure with *matplotlib* stuff within context manager.
```python
from matchart import cplot
import numpy as np
x = np.linspace(0, 10)
np.random.seed(19680801) # Fixing random state for reproducibility
with cplot(
[x, np.sin(x) + x + np.random.randn(50)],
[x, np.sin(x) + 0.5 * x + np.random.randn(50)],
[x, np.sin(x) + 2 * x + np.random.randn(50)],
[x, np.sin(x) - 0.5 * x + np.random.randn(50)],
[x, np.sin(x) - 2 * x + np.random.randn(50)],
[x, np.sin(x) + np.random.randn(50)],
title="'fivethirtyeight' style sheet",
theme='fivethirtyeight') as plotter:
plotter.axis.xaxis.set_visible(False)
plotter.axis.yaxis.set_visible(False)
```
Now you can customize plots just adding literally one letter.
# Changelog
**1.1.5**:
* Add getters to context plotter.
**1.1.4**:
* Add ticks control parameters.
* Add automatic cleanup on any error (parameter `clear_on_error`).
**1.1.3**:
* Add `context` parameter and alias `matchart.cplot(...)` to delay plot showing within context manager.
* Add `block` parameter of [matplotlib's show function](https://matplotlib.org/stable/api/_as_gen/matplotlib.pyplot.show.html#matplotlib.pyplot.show).
* Small enhancements and bugs fixes.
Raw data
{
"_id": null,
"home_page": null,
"name": "matchart",
"maintainer": null,
"docs_url": null,
"requires_python": ">=3.6",
"maintainer_email": null,
"keywords": "plot,chart,diagram,matplotlib,visualization",
"author": null,
"author_email": "baterflyrity <baterflyrity@yandex.ru>",
"download_url": "https://files.pythonhosted.org/packages/63/18/3e9aa3993e88793576043ce2cb8afa21cc8df39b29a2edad2ee1045519eb/matchart-1.1.5.tar.gz",
"platform": null,
"description": "# MatChart\n\nMatChart is a convenient one-line wrapper around *matplotlib* plotting library.\n\n## Usage\n\n```python\nfrom matchart import plot\n\nplot([x1, y1], [y2], [x3, y3], y4, ...,\n\t# common parameters\n\tkind='plot',\n\tshow: bool = True,\n\tblock: Optional[bool] = None,\n\tcontext: bool = False,\n\tclear_on_error: bool = True,\n\t\n\t# plotter explict parameters\n\tlabel: ClippedArguments = None,\n\tcolor: CycledArguments = None,\n\tmarker: ClippedArguments = None,\n\tlinestyle: ClippedArguments = None,\n\tlinewidth: ClippedArguments = None,\n\tmarkersize: ClippedArguments = None,\n\t\n\t# figure and axes parameters\n\tlegend: Optional[bool] = None,\n\tlegend_kwargs: Optional[Dict[str, Any]] = None,\n\ttitle: Optional[str] = None,\n\ttitle_kwargs: Optional[Dict[str, Any]] = None,\n\txlabel: Optional[str] = None,\n\txlabel_kwargs: Optional[Dict[str, Any]] = None,\n\tylabel: Optional[str] = None,\n\tylabel_kwargs: Optional[Dict[str, Any]] = None,\n\tlimit: Union[Tuple[Any, Any, Any, Any], bool] = True,\n\txticks: Optional[Union[Iterable, Dict[str, Any], bool]] = None,\n\tyticks: Optional[Union[Iterable, Dict[str, Any], bool]] = None,\n\tticks: Optional[Dict[str, Union[Iterable, Dict[str, Any], bool]]] = None,\n\tfigsize: Tuple[float, float] = (10, 8),\n\tdpi: float = 100,\n\tsubplots_kwargs: Optional[Dict[str, Any]] = None,\n\tgrid: Optional[bool] = False,\n\tgrid_kwargs: Optional[Dict[str, Any]] = None,\n\ttheme = 'seaborn-v0_8-deep',\n\n\t# plotter rest parameters\n\t** plotter_kwargs \n) -> Tuple[Figure, Axes, List[Artist]]\n```\n\n`kind` - pyplot [function name](https://matplotlib.org/stable/plot_types/index.html), e.g. _plot_ or _scatter_.\n\n`show` - whether to show plot or just to draw it.\n\n`block` - whether to block running code when showing plot or just display windows and run next lines. By default, detected from environment.\n\n`context` - delay showing plot by using context manager (see below).\n\n`clear_on_error` - whether to clean up on any error.\n\n`label`, `color`, `marker`, `linestyle`, `linewidth`, `markersize` and rest `plotter_kwargs` - plotter parameters. Can differ per kind. See [common parameters](https://matplotlib.org/stable/api/_as_gen/matplotlib.pyplot.plot.html) for `kind='plot'`. Can be `list` or `tuple` to define per-dataset values. Values can also be `None` or even clipped to skip definition for particular dataset.\n\n`legend` - set `True`, `False` or `None` to autodetect. `legend_kwargs` - [additional parameters](https://matplotlib.org/stable/api/_as_gen/matplotlib.axes.Axes.legend.html).\n\n`title` - plot's title. `title_kwargs` - [additional parameters](https://matplotlib.org/stable/api/_as_gen/matplotlib.axes.Axes.set_title.html).\n\n`xlabel` - horizontal axis label. `xlabel_kwargs` - [additional parameters](https://matplotlib.org/stable/api/_as_gen/matplotlib.axes.Axes.set_xlabel.html).\n\n`ylabel` - vertical axis label. `ylabel_kwargs` - [additional parameters](https://matplotlib.org/stable/api/_as_gen/matplotlib.axes.Axes.set_ylabel.html).\n\n`limit` - set `True` to autodetect 2D plot's borders or `False` to use default matplot's behaviour. Set to `(left, right, bottom, top)` to use [custom borders](https://matplotlib.org/stable/api/_as_gen/matplotlib.axes.Axes.set_ylim.html).\n\n`ticks`, `xticks`, `yticks` - set [corresponding ticks](https://matplotlib.org/stable/api/_as_gen/matplotlib.pyplot.xticks.html). Can be `False` to disable ticks. Can be dictionary of kwargs. Can be array-like value to define ticks locations. Argument `xticks` defines ticks for X axis, `yticks` - for Y axis. Alternatively argument `ticks` can be defined as dictionary with keys `'x'` or `'y'` containing same values as `xticks` and `yticks` arguments. Argument `xticks` must be used solely.\n\n`figsize` - plot's size as `(width, height)` in inches. By default, is overriden with *10x8*.\n\n`dpi` - plot's resolution in dots-per-inch.\n\n`subplots_kwargs` - [additional plot's parameters](https://matplotlib.org/stable/api/_as_gen/matplotlib.pyplot.subplots.html) and [Figure's parameters](https://matplotlib.org/stable/api/_as_gen/matplotlib.pyplot.figure.html#matplotlib.pyplot.figure).\n\n`grid` - plot's [grid visibility](https://matplotlib.org/stable/api/_as_gen/matplotlib.pyplot.grid.html) with `grid_kwargs` as additional parameters.\n\n`theme` - plot's [style](https://matplotlib.org/stable/api/style_api.html#matplotlib.style.use). By default is overriden with *seaborn-v0_8-deep*.\n\n## Examples\n\n### Just plot something\n\nFirstly prepare data:\n\n```python\nimport numpy as np\n\nx1 = np.arange(21)\ny1 = x1 ** 2\ny2 = x1 ** 1.9\nx3 = 5, 15\ny3 = 300, 100\ny4 = x1 ** 2.1\n```\n\nThen plot data:\n\n```python\nfrom matchart import plot\n\nplot([x1, y1], [y2], [x3, y3], y4,\n\t label=['$x^{2}$', '$x^{1.9}$', 'Points'],\n\t xlabel='X', ylabel='Y',\n\t title='Power of $x$ comparison.',\n\t grid=True,\n\t color=[None, 'green', 'red', 'gray'],\n\t marker=['o', None, '*'],\n\t linestyle=[None, '--'],\n\t linewidth=[None, 3, 0],\n\t markersize=20,\n\t fillstyle='top')\n```\n\n\n\n### Migrate from matplotlib simple\n\nLet's take [FiveThirtyEight style sheet example](https://matplotlib.org/stable/gallery/style_sheets/fivethirtyeight.html#sphx-glr-gallery-style-sheets-fivethirtyeight-py):\n\n```python\nimport matplotlib.pyplot as plt\nimport numpy as np\n\nplt.style.use('fivethirtyeight')\n\nx = np.linspace(0, 10)\nnp.random.seed(19680801) # Fixing random state for reproducibility\n\nfig, ax = plt.subplots()\nax.plot(x, np.sin(x) + x + np.random.randn(50))\nax.plot(x, np.sin(x) + 0.5 * x + np.random.randn(50))\nax.plot(x, np.sin(x) + 2 * x + np.random.randn(50))\nax.plot(x, np.sin(x) - 0.5 * x + np.random.randn(50))\nax.plot(x, np.sin(x) - 2 * x + np.random.randn(50))\nax.plot(x, np.sin(x) + np.random.randn(50))\nax.set_title(\"'fivethirtyeight' style sheet\")\nplt.show()\n```\n\n\n\nand rewrite it with MatChart:\n\n```python\nfrom matchart import plot\nimport numpy as np\n\nx = np.linspace(0, 10)\nnp.random.seed(19680801) # Fixing random state for reproducibility\n\nplot([x, np.sin(x) + x + np.random.randn(50)],\n\t [x, np.sin(x) + 0.5 * x + np.random.randn(50)],\n\t [x, np.sin(x) + 2 * x + np.random.randn(50)],\n\t [x, np.sin(x) - 0.5 * x + np.random.randn(50)],\n\t [x, np.sin(x) - 2 * x + np.random.randn(50)],\n\t [x, np.sin(x) + np.random.randn(50)],\n\t title=\"'fivethirtyeight' style sheet\",\n\t theme='fivethirtyeight')\n```\n\n\n\n*Note that default figure size differs.*\n\n### Migrate from matplotlib stackplot\n\nLet's take [stackplots example](https://matplotlib.org/stable/gallery/lines_bars_and_markers/stackplot_demo.html#sphx-glr-gallery-lines-bars-and-markers-stackplot-demo-py):\n\n```python\nimport matplotlib.pyplot as plt\n\n# data from United Nations World Population Prospects (Revision 2019)\n# https://population.un.org/wpp/, license: CC BY 3.0 IGO\nyear = [1950, 1960, 1970, 1980, 1990, 2000, 2010, 2018]\npopulation_by_continent = {\n\t'africa' : [228, 284, 365, 477, 631, 814, 1044, 1275],\n\t'americas': [340, 425, 519, 619, 727, 840, 943, 1006],\n\t'asia' : [1394, 1686, 2120, 2625, 3202, 3714, 4169, 4560],\n\t'europe' : [220, 253, 276, 295, 310, 303, 294, 293],\n\t'oceania' : [12, 15, 19, 22, 26, 31, 36, 39],\n}\n\nfig, ax = plt.subplots()\nax.stackplot(year, population_by_continent.values(),\n\t\t\t labels=population_by_continent.keys(), alpha=0.8)\nax.legend(loc='upper left')\nax.set_title('World population')\nax.set_xlabel('Year')\nax.set_ylabel('Number of people (millions)')\n\nplt.show()\n```\n\n\n\nand rewrite it with MatChart:\n\n```python\nfrom matchart import plot\n\n# data from United Nations World Population Prospects (Revision 2019)\n# https://population.un.org/wpp/, license: CC BY 3.0 IGO\nyear = [1950, 1960, 1970, 1980, 1990, 2000, 2010, 2018]\npopulation_by_continent = {\n\t'africa' : [228, 284, 365, 477, 631, 814, 1044, 1275],\n\t'americas': [340, 425, 519, 619, 727, 840, 943, 1006],\n\t'asia' : [1394, 1686, 2120, 2625, 3202, 3714, 4169, 4560],\n\t'europe' : [220, 253, 276, 295, 310, 303, 294, 293],\n\t'oceania' : [12, 15, 19, 22, 26, 31, 36, 39],\n}\n\nplot([year, population_by_continent.values()],\n\t kind='stackplot',\n\t labels=population_by_continent.keys(),\n\t alpha=0.8,\n\t legend=True,\n\t legend_kwargs=dict(loc='upper left'),\n\t limit=False,\n\t title='World population',\n\t xlabel='Year',\n\t ylabel='Number of people (millions)')\n```\n\n\n\n*Note that default figure size and theme differ.*\n\n### Customization of plots\n\nLet's take FiveThirtyEight style sheet example above and customize it before showing.\n\nImagine now we want to remove X and Y axes.\n\n\n\n#### Straightforward solution (not bad)\n\nTo do the trick we can:\n\n1. only draw plot with `show=False`;\n2. customize figure with *matplotlib* stuff;\n3. show plot with `matplotlib.pyplot.show()`.\n\n```python\nfrom matchart import plot\nimport numpy as np\nfrom matplotlib import pyplot as plt\n\nx = np.linspace(0, 10)\nnp.random.seed(19680801) # Fixing random state for reproducibility\n\nfig, ax, arts = plot(\n\t\t[x, np.sin(x) + x + np.random.randn(50)],\n\t\t[x, np.sin(x) + 0.5 * x + np.random.randn(50)],\n\t\t[x, np.sin(x) + 2 * x + np.random.randn(50)],\n\t\t[x, np.sin(x) - 0.5 * x + np.random.randn(50)],\n\t\t[x, np.sin(x) - 2 * x + np.random.randn(50)],\n\t\t[x, np.sin(x) + np.random.randn(50)],\n\t\ttitle=\"'fivethirtyeight' style sheet\",\n\t\ttheme='fivethirtyeight',\n\t\tshow=False)\nax.xaxis.set_visible(False)\nax.yaxis.set_visible(False)\nplt.show()\n```\n\n#### Clever solution (better)\n\nTo solve such kind of problems there is *context manager* support:\n\n1. draw plot with `context=True`;\n2. customize figure with *matplotlib* stuff within context manager.\n\n```python\nfrom matchart import plot\nimport numpy as np\n\nx = np.linspace(0, 10)\nnp.random.seed(19680801) # Fixing random state for reproducibility\n\nwith plot(\n\t\t[x, np.sin(x) + x + np.random.randn(50)],\n\t\t[x, np.sin(x) + 0.5 * x + np.random.randn(50)],\n\t\t[x, np.sin(x) + 2 * x + np.random.randn(50)],\n\t\t[x, np.sin(x) - 0.5 * x + np.random.randn(50)],\n\t\t[x, np.sin(x) - 2 * x + np.random.randn(50)],\n\t\t[x, np.sin(x) + np.random.randn(50)],\n\t\ttitle=\"'fivethirtyeight' style sheet\",\n\t\ttheme='fivethirtyeight',\n\t\tcontext=True) as results:\n\tax = results[1]\n\tax.xaxis.set_visible(False)\n\tax.yaxis.set_visible(False)\n```\n\n#### The best solution\n\nSpecially for lazy people there is special alias to be used within *context manager*:\n\n1. draw plot with `matchart.cplot()`;\n2. customize figure with *matplotlib* stuff within context manager.\n\n```python\nfrom matchart import cplot\nimport numpy as np\n\nx = np.linspace(0, 10)\nnp.random.seed(19680801) # Fixing random state for reproducibility\n\nwith cplot(\n\t\t[x, np.sin(x) + x + np.random.randn(50)],\n\t\t[x, np.sin(x) + 0.5 * x + np.random.randn(50)],\n\t\t[x, np.sin(x) + 2 * x + np.random.randn(50)],\n\t\t[x, np.sin(x) - 0.5 * x + np.random.randn(50)],\n\t\t[x, np.sin(x) - 2 * x + np.random.randn(50)],\n\t\t[x, np.sin(x) + np.random.randn(50)],\n\t\ttitle=\"'fivethirtyeight' style sheet\",\n\t\ttheme='fivethirtyeight') as plotter:\n\tplotter.axis.xaxis.set_visible(False)\n\tplotter.axis.yaxis.set_visible(False)\n```\n\nNow you can customize plots just adding literally one letter.\n\n# Changelog\n\n**1.1.5**:\n\n* Add getters to context plotter.\n\n**1.1.4**:\n\n* Add ticks control parameters.\n* Add automatic cleanup on any error (parameter `clear_on_error`).\n\n**1.1.3**:\n\n* Add `context` parameter and alias `matchart.cplot(...)` to delay plot showing within context manager.\n* Add `block` parameter of [matplotlib's show function](https://matplotlib.org/stable/api/_as_gen/matplotlib.pyplot.show.html#matplotlib.pyplot.show).\n* Small enhancements and bugs fixes.\n\n",
"bugtrack_url": null,
"license": null,
"summary": "Convenient plotting wrapper around matplotlib.",
"version": "1.1.5",
"project_urls": {
"Home": "https://github.com/baterflyrity/matchart",
"Issues": "https://github.com/baterflyrity/matchart/issues"
},
"split_keywords": [
"plot",
"chart",
"diagram",
"matplotlib",
"visualization"
],
"urls": [
{
"comment_text": null,
"digests": {
"blake2b_256": "5f523bc5831d5b0f164316363bf7f42fb02e8972da1554d0358d0c9d0fe7b178",
"md5": "9f3ddedab65a1a7670f9c77ec9f5f0bc",
"sha256": "d521ab4573deb90b4ab84b5ee806d194825d49845c688c603ebf6df3b114eb6c"
},
"downloads": -1,
"filename": "matchart-1.1.5-py3-none-any.whl",
"has_sig": false,
"md5_digest": "9f3ddedab65a1a7670f9c77ec9f5f0bc",
"packagetype": "bdist_wheel",
"python_version": "py3",
"requires_python": ">=3.6",
"size": 7217,
"upload_time": "2023-11-23T10:47:32",
"upload_time_iso_8601": "2023-11-23T10:47:32.906297Z",
"url": "https://files.pythonhosted.org/packages/5f/52/3bc5831d5b0f164316363bf7f42fb02e8972da1554d0358d0c9d0fe7b178/matchart-1.1.5-py3-none-any.whl",
"yanked": false,
"yanked_reason": null
},
{
"comment_text": null,
"digests": {
"blake2b_256": "63183e9aa3993e88793576043ce2cb8afa21cc8df39b29a2edad2ee1045519eb",
"md5": "cd87128fad327dfd0753bd7bec9b0bbe",
"sha256": "094f7558ada87d784f705e28dc09cb6e34a49e6502d4428c1bc3951e15c7d8aa"
},
"downloads": -1,
"filename": "matchart-1.1.5.tar.gz",
"has_sig": false,
"md5_digest": "cd87128fad327dfd0753bd7bec9b0bbe",
"packagetype": "sdist",
"python_version": "source",
"requires_python": ">=3.6",
"size": 414178,
"upload_time": "2023-11-23T10:47:42",
"upload_time_iso_8601": "2023-11-23T10:47:42.214041Z",
"url": "https://files.pythonhosted.org/packages/63/18/3e9aa3993e88793576043ce2cb8afa21cc8df39b29a2edad2ee1045519eb/matchart-1.1.5.tar.gz",
"yanked": false,
"yanked_reason": null
}
],
"upload_time": "2023-11-23 10:47:42",
"github": true,
"gitlab": false,
"bitbucket": false,
"codeberg": false,
"github_user": "baterflyrity",
"github_project": "matchart",
"travis_ci": false,
"coveralls": false,
"github_actions": false,
"requirements": [],
"lcname": "matchart"
}

