# Matplotlib Format Pi
## [DOCS](https://k-donn.github.io/format-pi)
## Branches
### Master
| Version | Upload Status | Downloads |
| :-------------------------------------------------------------------------------------------------------------------- | :--------------------------------------------------------------------------------------------------------------------------------------------------------------------------------------------------------------------------------------------------------- | :----------------------------------------------------------------------------------------------------------------------------- |
| [](https://badge.fury.io/py/matplot-fmt-pi) |  | [](https://pepy.tech/project/matplot-fmt-pi/month) |
### Release
| Version | Upload Status | Size |
| :----------------------------------------------------------------------------------------------------------------------------------------------------- | :---------------------------------------------------------------------------------------------------------------------------------------------------------------------------------------------------------------------------------------------------------------------------- | :----------------------------------------------------------------------------------------------- |
| [](https://github.com/k-donn/format-pi/tree/release) |  |  |
Format multiples of pi as strings on Matplotlib axes.
The `MultiplePi` class creates a [Locator](https://matplotlib.org/api/ticker_api.html?highlight=locator#matplotlib.ticker.MultipleLocator) to place ticks at desired multiples and a [Formatter](https://matplotlib.org/api/ticker_api.html?highlight=locator#matplotlib.ticker.FuncFormatter) to format all tick labels.
The base (π or τ) can be divided by any Natural Number.
Multiples of one-π or one-τ can be placed/formatted too. (2π, 3π, 2τ, 3τ, etc.)
## Installing
```bash
pip install matplot-fmt-pi
```
## Examples
```python
from matplot_fmt_pi.ticker import MultiplePi
```
Simply, the instance can be asssigned a denominator of pi then passed to matplotlib.
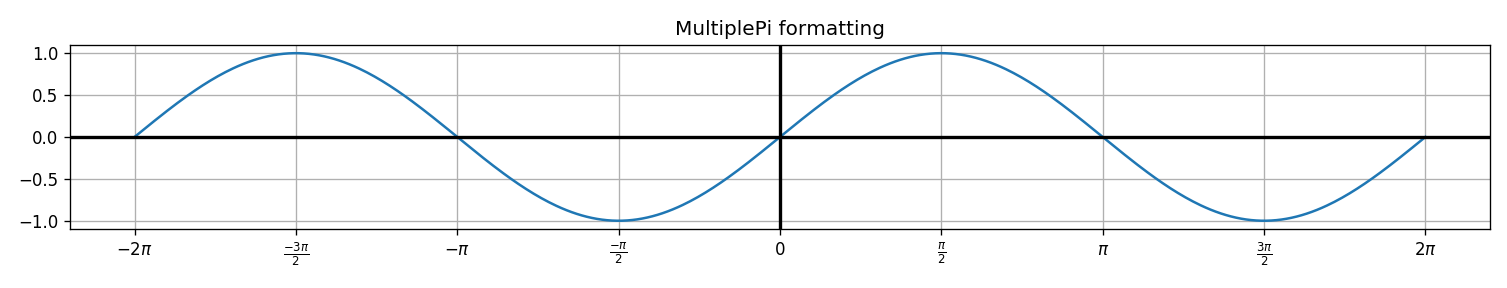
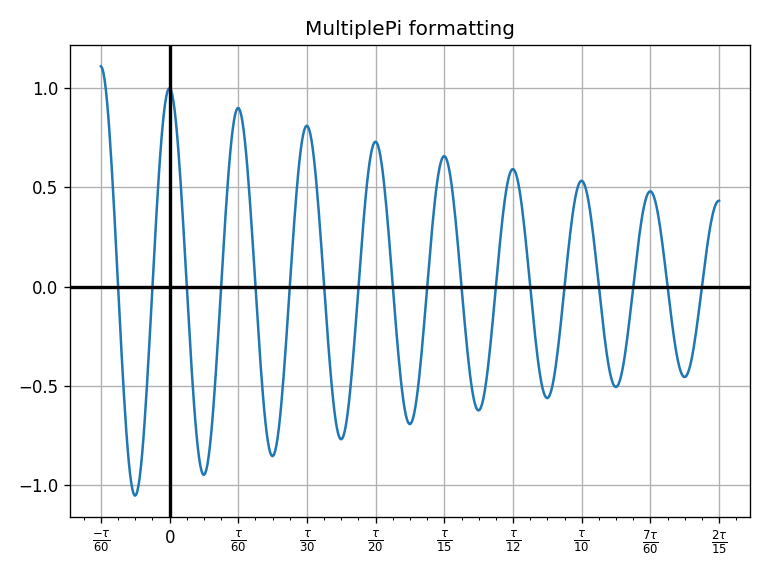
The parameters can also be modified to adjust the output to something more sophisticated.
## Running Examples
Clone, then from the repo,
```bash
cd examples/
python *.py
```
Put the repo's directory in the python path to import the `matplot_fmt_pi` folder not the installed package.
```bash
PYTHONPATH=/home/user/py-pros/format-pi python examples/pi_graph.py
```
## Todo
- [ ] Add testing option once installed (Like `numpy.test()`)
- [ ] Windows `make.bat`?
## Meta

Inspired by [this](https://stackoverflow.com/questions/40642061/how-to-set-axis-ticks-in-multiples-of-pi-python-matplotlib) post on StackOverflow.
Raw data
{
"_id": null,
"home_page": "https://github.com/k-donn/format-pi",
"name": "matplot-fmt-pi",
"maintainer": "",
"docs_url": null,
"requires_python": "",
"maintainer_email": "",
"keywords": "matplotlib,formatter,locator,axes ticks,numbers,radians,multiples,of,pi",
"author": "k-donn",
"author_email": "k-donn@github.com",
"download_url": "https://files.pythonhosted.org/packages/cd/55/c607ba84a34470d23bf64fe12625b87864a54b35f7ff82ce9224e6275bac/matplot-fmt-pi-2.1.0.tar.gz",
"platform": null,
"description": "# Matplotlib Format Pi\n\n## [DOCS](https://k-donn.github.io/format-pi)\n\n## Branches\n\n### Master\n\n| Version | Upload Status | Downloads |\n| :-------------------------------------------------------------------------------------------------------------------- | :--------------------------------------------------------------------------------------------------------------------------------------------------------------------------------------------------------------------------------------------------------- | :----------------------------------------------------------------------------------------------------------------------------- |\n| [](https://badge.fury.io/py/matplot-fmt-pi) |  | [](https://pepy.tech/project/matplot-fmt-pi/month) |\n\n### Release\n\n| Version | Upload Status | Size |\n| :----------------------------------------------------------------------------------------------------------------------------------------------------- | :---------------------------------------------------------------------------------------------------------------------------------------------------------------------------------------------------------------------------------------------------------------------------- | :----------------------------------------------------------------------------------------------- |\n| [](https://github.com/k-donn/format-pi/tree/release) |  |  |\n\nFormat multiples of pi as strings on Matplotlib axes.\n\nThe `MultiplePi` class creates a [Locator](https://matplotlib.org/api/ticker_api.html?highlight=locator#matplotlib.ticker.MultipleLocator) to place ticks at desired multiples and a [Formatter](https://matplotlib.org/api/ticker_api.html?highlight=locator#matplotlib.ticker.FuncFormatter) to format all tick labels.\n\nThe base (\u03c0 or \u03c4) can be divided by any Natural Number.\n\nMultiples of one-\u03c0 or one-\u03c4 can be placed/formatted too. (2\u03c0, 3\u03c0, 2\u03c4, 3\u03c4, etc.)\n\n## Installing\n\n```bash\npip install matplot-fmt-pi\n```\n\n## Examples\n\n```python\nfrom matplot_fmt_pi.ticker import MultiplePi\n```\n\nSimply, the instance can be asssigned a denominator of pi then passed to matplotlib.\n\n\n\nThe parameters can also be modified to adjust the output to something more sophisticated.\n\n\n\n\n\n## Running Examples\n\nClone, then from the repo,\n\n```bash\ncd examples/\npython *.py\n```\n\nPut the repo's directory in the python path to import the `matplot_fmt_pi` folder not the installed package.\n\n```bash\nPYTHONPATH=/home/user/py-pros/format-pi python examples/pi_graph.py\n```\n\n## Todo\n\n- [ ] Add testing option once installed (Like `numpy.test()`)\n- [ ] Windows `make.bat`?\n\n## Meta\n\n\n\nInspired by [this](https://stackoverflow.com/questions/40642061/how-to-set-axis-ticks-in-multiples-of-pi-python-matplotlib) post on StackOverflow.\n\n\n",
"bugtrack_url": null,
"license": "MIT",
"summary": "Format numbers as multiples of Pi",
"version": "2.1.0",
"project_urls": {
"Homepage": "https://github.com/k-donn/format-pi"
},
"split_keywords": [
"matplotlib",
"formatter",
"locator",
"axes ticks",
"numbers",
"radians",
"multiples",
"of",
"pi"
],
"urls": [
{
"comment_text": "",
"digests": {
"blake2b_256": "879ea6355c947711e279d9c098e5a3b40d34cae23ae44016fd9a85696dfe22df",
"md5": "9622a149189e9b9d8f632dac6eae3124",
"sha256": "efb36d32db015f37f57e1aaa7fa9ef0c2ca1884441c1d34ce50042c0498b62fa"
},
"downloads": -1,
"filename": "matplot_fmt_pi-2.1.0-py3-none-any.whl",
"has_sig": false,
"md5_digest": "9622a149189e9b9d8f632dac6eae3124",
"packagetype": "bdist_wheel",
"python_version": "py3",
"requires_python": null,
"size": 6792,
"upload_time": "2023-06-06T00:23:36",
"upload_time_iso_8601": "2023-06-06T00:23:36.915407Z",
"url": "https://files.pythonhosted.org/packages/87/9e/a6355c947711e279d9c098e5a3b40d34cae23ae44016fd9a85696dfe22df/matplot_fmt_pi-2.1.0-py3-none-any.whl",
"yanked": false,
"yanked_reason": null
},
{
"comment_text": "",
"digests": {
"blake2b_256": "cd55c607ba84a34470d23bf64fe12625b87864a54b35f7ff82ce9224e6275bac",
"md5": "6f6c42c6973a63ba62c62d18ba3ac62a",
"sha256": "c0d598209c0581e5e9e38051134516c3f59c744a7e4efce26dbd9f108bd2f6cf"
},
"downloads": -1,
"filename": "matplot-fmt-pi-2.1.0.tar.gz",
"has_sig": false,
"md5_digest": "6f6c42c6973a63ba62c62d18ba3ac62a",
"packagetype": "sdist",
"python_version": "source",
"requires_python": null,
"size": 6575,
"upload_time": "2023-06-06T00:23:37",
"upload_time_iso_8601": "2023-06-06T00:23:37.967562Z",
"url": "https://files.pythonhosted.org/packages/cd/55/c607ba84a34470d23bf64fe12625b87864a54b35f7ff82ce9224e6275bac/matplot-fmt-pi-2.1.0.tar.gz",
"yanked": false,
"yanked_reason": null
}
],
"upload_time": "2023-06-06 00:23:37",
"github": true,
"gitlab": false,
"bitbucket": false,
"codeberg": false,
"github_user": "k-donn",
"github_project": "format-pi",
"travis_ci": false,
"coveralls": false,
"github_actions": true,
"lcname": "matplot-fmt-pi"
}

