# termplotlib
[](https://pypi.org/project/termplotlib)
[](https://pypi.org/pypi/termplotlib/)
[](https://github.com/nschloe/termplotlib)
[](https://pypistats.org/packages/termplotlib)
[](https://github.com/nschloe/termplotlib/actions?query=workflow%3Aci)
[](https://codecov.io/gh/nschloe/termplotlib)
[](https://lgtm.com/projects/g/nschloe/termplotlib)
[](https://github.com/psf/black)
termplotlib is a Python library for all your terminal plotting needs. It aims to work
like [matplotlib](https://matplotlib.org/).
### Line plots
For line plots, termplotlib relies on [gnuplot](http://www.gnuplot.info/).
With that installed, the code
```python
import termplotlib as tpl
import numpy as np
x = np.linspace(0, 2 * np.pi, 10)
y = np.sin(x)
fig = tpl.figure()
fig.plot(x, y, label="data", width=50, height=15)
fig.show()
```
produces
<!--pytest-codeblocks:expected-output-->
```
1 +---------------------------------------+
0.8 | ** ** |
0.6 | * ** data ******* |
0.4 | ** |
0.2 |* ** |
0 | ** |
| * |
-0.2 | ** ** |
-0.4 | ** * |
-0.6 | ** |
-0.8 | **** ** |
-1 +---------------------------------------+
0 1 2 3 4 5 6 7
```
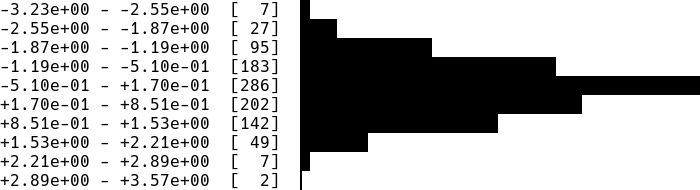
### Horizontal histograms
```python
import termplotlib as tpl
import numpy as np
rng = np.random.default_rng(123)
sample = rng.standard_normal(size=1000)
counts, bin_edges = np.histogram(sample)
fig = tpl.figure()
fig.hist(counts, bin_edges, orientation="horizontal", force_ascii=False)
fig.show()
```
produces
Horizontal bar charts are covered as well. This
```python
import termplotlib as tpl
fig = tpl.figure()
fig.barh([3, 10, 5, 2], ["Cats", "Dogs", "Cows", "Geese"], force_ascii=True)
fig.show()
```
produces
<!--pytest-codeblocks:expected-output-->
```
Cats [ 3] ************
Dogs [10] ****************************************
Cows [ 5] ********************
Geese [ 2] ********
```
### Vertical histograms
```python
import termplotlib as tpl
import numpy as np
rng = np.random.default_rng(123)
sample = rng.standard_normal(size=1000)
counts, bin_edges = np.histogram(sample, bins=40)
fig = tpl.figure()
fig.hist(counts, bin_edges, grid=[15, 25], force_ascii=False)
fig.show()
```
produces

### Tables
Support for tables has moved over to
[termtables](https://github.com/nschloe/termtables).
### Installation
termplotlib is [available from the Python Package
Index](https://pypi.org/project/termplotlib/), so simply do
```
pip install termplotlib
```
to install.
### Testing
To run the termplotlib unit tests, check out this repository and type
```
pytest
```
### Similar projects
* [asciichart](https://github.com/kroitor/asciichart)
* [bashplotlib](https://github.com/glamp/bashplotlib)
* [plotext](https://github.com/piccolomo/plotext)
* [plotille](https://github.com/tammoippen/plotille)
Raw data
{
"_id": null,
"home_page": "https://github.com/nschloe/termplotlib",
"name": "termplotlib",
"maintainer": "",
"docs_url": null,
"requires_python": ">=3.7",
"maintainer_email": "",
"keywords": "graphics,plotting,terminal,ascii,matplotlib",
"author": "Nico Schl\u00f6mer",
"author_email": "nico.schloemer@gmail.com",
"download_url": "https://files.pythonhosted.org/packages/b4/60/8a74d2503dd64975402c7b8d00f6e201e8cbba5348282433fa5fb8d41b67/termplotlib-0.3.9.tar.gz",
"platform": "",
"description": "# termplotlib\n\n[](https://pypi.org/project/termplotlib)\n[](https://pypi.org/pypi/termplotlib/)\n[](https://github.com/nschloe/termplotlib)\n[](https://pypistats.org/packages/termplotlib)\n\n[](https://github.com/nschloe/termplotlib/actions?query=workflow%3Aci)\n[](https://codecov.io/gh/nschloe/termplotlib)\n[](https://lgtm.com/projects/g/nschloe/termplotlib)\n[](https://github.com/psf/black)\n\ntermplotlib is a Python library for all your terminal plotting needs. It aims to work\nlike [matplotlib](https://matplotlib.org/).\n\n\n### Line plots\n\nFor line plots, termplotlib relies on [gnuplot](http://www.gnuplot.info/).\nWith that installed, the code\n```python\nimport termplotlib as tpl\nimport numpy as np\n\nx = np.linspace(0, 2 * np.pi, 10)\ny = np.sin(x)\n\nfig = tpl.figure()\nfig.plot(x, y, label=\"data\", width=50, height=15)\nfig.show()\n```\nproduces\n<!--pytest-codeblocks:expected-output-->\n```\n 1 +---------------------------------------+\n 0.8 | ** ** |\n 0.6 | * ** data ******* |\n 0.4 | ** |\n 0.2 |* ** |\n 0 | ** |\n | * |\n -0.2 | ** ** |\n -0.4 | ** * |\n -0.6 | ** |\n -0.8 | **** ** |\n -1 +---------------------------------------+\n 0 1 2 3 4 5 6 7\n```\n\n### Horizontal histograms\n\n```python\nimport termplotlib as tpl\nimport numpy as np\n\nrng = np.random.default_rng(123)\nsample = rng.standard_normal(size=1000)\ncounts, bin_edges = np.histogram(sample)\n\nfig = tpl.figure()\nfig.hist(counts, bin_edges, orientation=\"horizontal\", force_ascii=False)\nfig.show()\n```\nproduces\n\n\n\nHorizontal bar charts are covered as well. This\n```python\nimport termplotlib as tpl\n\nfig = tpl.figure()\nfig.barh([3, 10, 5, 2], [\"Cats\", \"Dogs\", \"Cows\", \"Geese\"], force_ascii=True)\nfig.show()\n```\nproduces\n<!--pytest-codeblocks:expected-output-->\n```\nCats [ 3] ************\nDogs [10] ****************************************\nCows [ 5] ********************\nGeese [ 2] ********\n```\n\n### Vertical histograms\n\n```python\nimport termplotlib as tpl\nimport numpy as np\n\nrng = np.random.default_rng(123)\nsample = rng.standard_normal(size=1000)\ncounts, bin_edges = np.histogram(sample, bins=40)\nfig = tpl.figure()\nfig.hist(counts, bin_edges, grid=[15, 25], force_ascii=False)\nfig.show()\n```\nproduces\n\n\n\n\n### Tables\n\nSupport for tables has moved over to\n[termtables](https://github.com/nschloe/termtables).\n\n\n### Installation\n\ntermplotlib is [available from the Python Package\nIndex](https://pypi.org/project/termplotlib/), so simply do\n```\npip install termplotlib\n```\nto install.\n\n\n### Testing\n\nTo run the termplotlib unit tests, check out this repository and type\n```\npytest\n```\n\n### Similar projects\n\n * [asciichart](https://github.com/kroitor/asciichart)\n * [bashplotlib](https://github.com/glamp/bashplotlib)\n * [plotext](https://github.com/piccolomo/plotext)\n * [plotille](https://github.com/tammoippen/plotille)\n\n\n",
"bugtrack_url": null,
"license": "GPL-3.0-or-later",
"summary": "Python plotting for the command line",
"version": "0.3.9",
"project_urls": {
"Code": "https://github.com/nschloe/termplotlib",
"Funding": "https://github.com/sponsors/nschloe",
"Homepage": "https://github.com/nschloe/termplotlib",
"Issues": "https://github.com/nschloe/termplotlib/issues"
},
"split_keywords": [
"graphics",
"plotting",
"terminal",
"ascii",
"matplotlib"
],
"urls": [
{
"comment_text": "",
"digests": {
"blake2b_256": "69d0ea24907a6d1e3c5e40ff5b58920552c3e1e4e73181a8583d5bd9d5217305",
"md5": "9d224fee7b788b1b41190bf1939ef861",
"sha256": "827bec59e0de24dfe265b9d9a4adc4df8335aa98f49c1122bd53ced9b72c5206"
},
"downloads": -1,
"filename": "termplotlib-0.3.9-py3-none-any.whl",
"has_sig": false,
"md5_digest": "9d224fee7b788b1b41190bf1939ef861",
"packagetype": "bdist_wheel",
"python_version": "py3",
"requires_python": ">=3.7",
"size": 21535,
"upload_time": "2021-09-23T09:11:37",
"upload_time_iso_8601": "2021-09-23T09:11:37.108156Z",
"url": "https://files.pythonhosted.org/packages/69/d0/ea24907a6d1e3c5e40ff5b58920552c3e1e4e73181a8583d5bd9d5217305/termplotlib-0.3.9-py3-none-any.whl",
"yanked": false,
"yanked_reason": null
},
{
"comment_text": "",
"digests": {
"blake2b_256": "b4608a74d2503dd64975402c7b8d00f6e201e8cbba5348282433fa5fb8d41b67",
"md5": "8f8858a70743582d2af1cc8bcb6c20c8",
"sha256": "c04cbd67ac61753eac9162a99cbe87c379d4c5daf720af1df55f4423c094203e"
},
"downloads": -1,
"filename": "termplotlib-0.3.9.tar.gz",
"has_sig": false,
"md5_digest": "8f8858a70743582d2af1cc8bcb6c20c8",
"packagetype": "sdist",
"python_version": "source",
"requires_python": ">=3.7",
"size": 24517,
"upload_time": "2021-09-23T09:11:38",
"upload_time_iso_8601": "2021-09-23T09:11:38.420721Z",
"url": "https://files.pythonhosted.org/packages/b4/60/8a74d2503dd64975402c7b8d00f6e201e8cbba5348282433fa5fb8d41b67/termplotlib-0.3.9.tar.gz",
"yanked": false,
"yanked_reason": null
}
],
"upload_time": "2021-09-23 09:11:38",
"github": true,
"gitlab": false,
"bitbucket": false,
"codeberg": false,
"github_user": "nschloe",
"github_project": "termplotlib",
"travis_ci": false,
"coveralls": false,
"github_actions": true,
"tox": true,
"lcname": "termplotlib"
}

