# CafePlotter


[](https://pypi.python.org/pypi/cafeplotter)
[](https://github.com/moshi4/CafePlotter/actions/workflows/ci.yml)
## Table of contents
- [Overview](#overview)
- [Installation](#installation)
- [Usage](#usage)
- [Output Contents](#output-contents)
## Overview
CAFE (Computational Analysis of gene Family Evolution) is a software to analyze changes in gene family size in a way
that accounts for phylogenetic history and provides a statistical foundation for evolutionary inferences.
[CAFE5](https://github.com/hahnlab/CAFE5) currently does not provide tools to visualize Expansion/Contraction of gene families on phylogenetic tree.
To solve this issue, I developed CafePlotter, a tool for plotting CAFE5 gene family expansion/contraction result.
## Installation
`Python 3.8 or later` is required for installation.
**Install PyPI package:**
pip install cafeplotter
## Usage
### Basic Command
cafeplotter -i [CAFE5 result directory] -o [Output directory]
### Options
General Options:
-i IN, --indir IN CAFE5 result directory as input
-o OUT, --outdir OUT Output directory for plotting CAFE5 result
--format Output image format ('png'[default]|'jpg'|'svg'|'pdf')
-v, --version Print version information
-h, --help Show this help message and exit
Figure Appearence Options:
--fig_height Figure height per leaf node of tree (Default: 0.5)
--fig_width Figure width (Default: 8.0)
--leaf_label_size Leaf label size (Default: 12)
--count_label_size Gene count label size (Default: 8)
--innode_label_size Internal node label size (Default: 0)
--p_label_size Branch p-value label size (Default: 0)
--ignore_branch_length Ignore branch length for plotting tree (Default: OFF)
--expansion_color Plot color of gene family expansion (Default: 'red')
--contraction_color Plot color of gene family contraction (Default: 'blue')
--dpi Figure DPI (Default: 300)
### Example Command
User can download example dataset ([singlelambda.zip](https://github.com/moshi4/CafePlotter/raw/main/examples/singlelambda.zip)):
cafeplotter -i ./examples/singlelambda -o ./singlelambda_plot --ignore_branch_length
## Output Contents
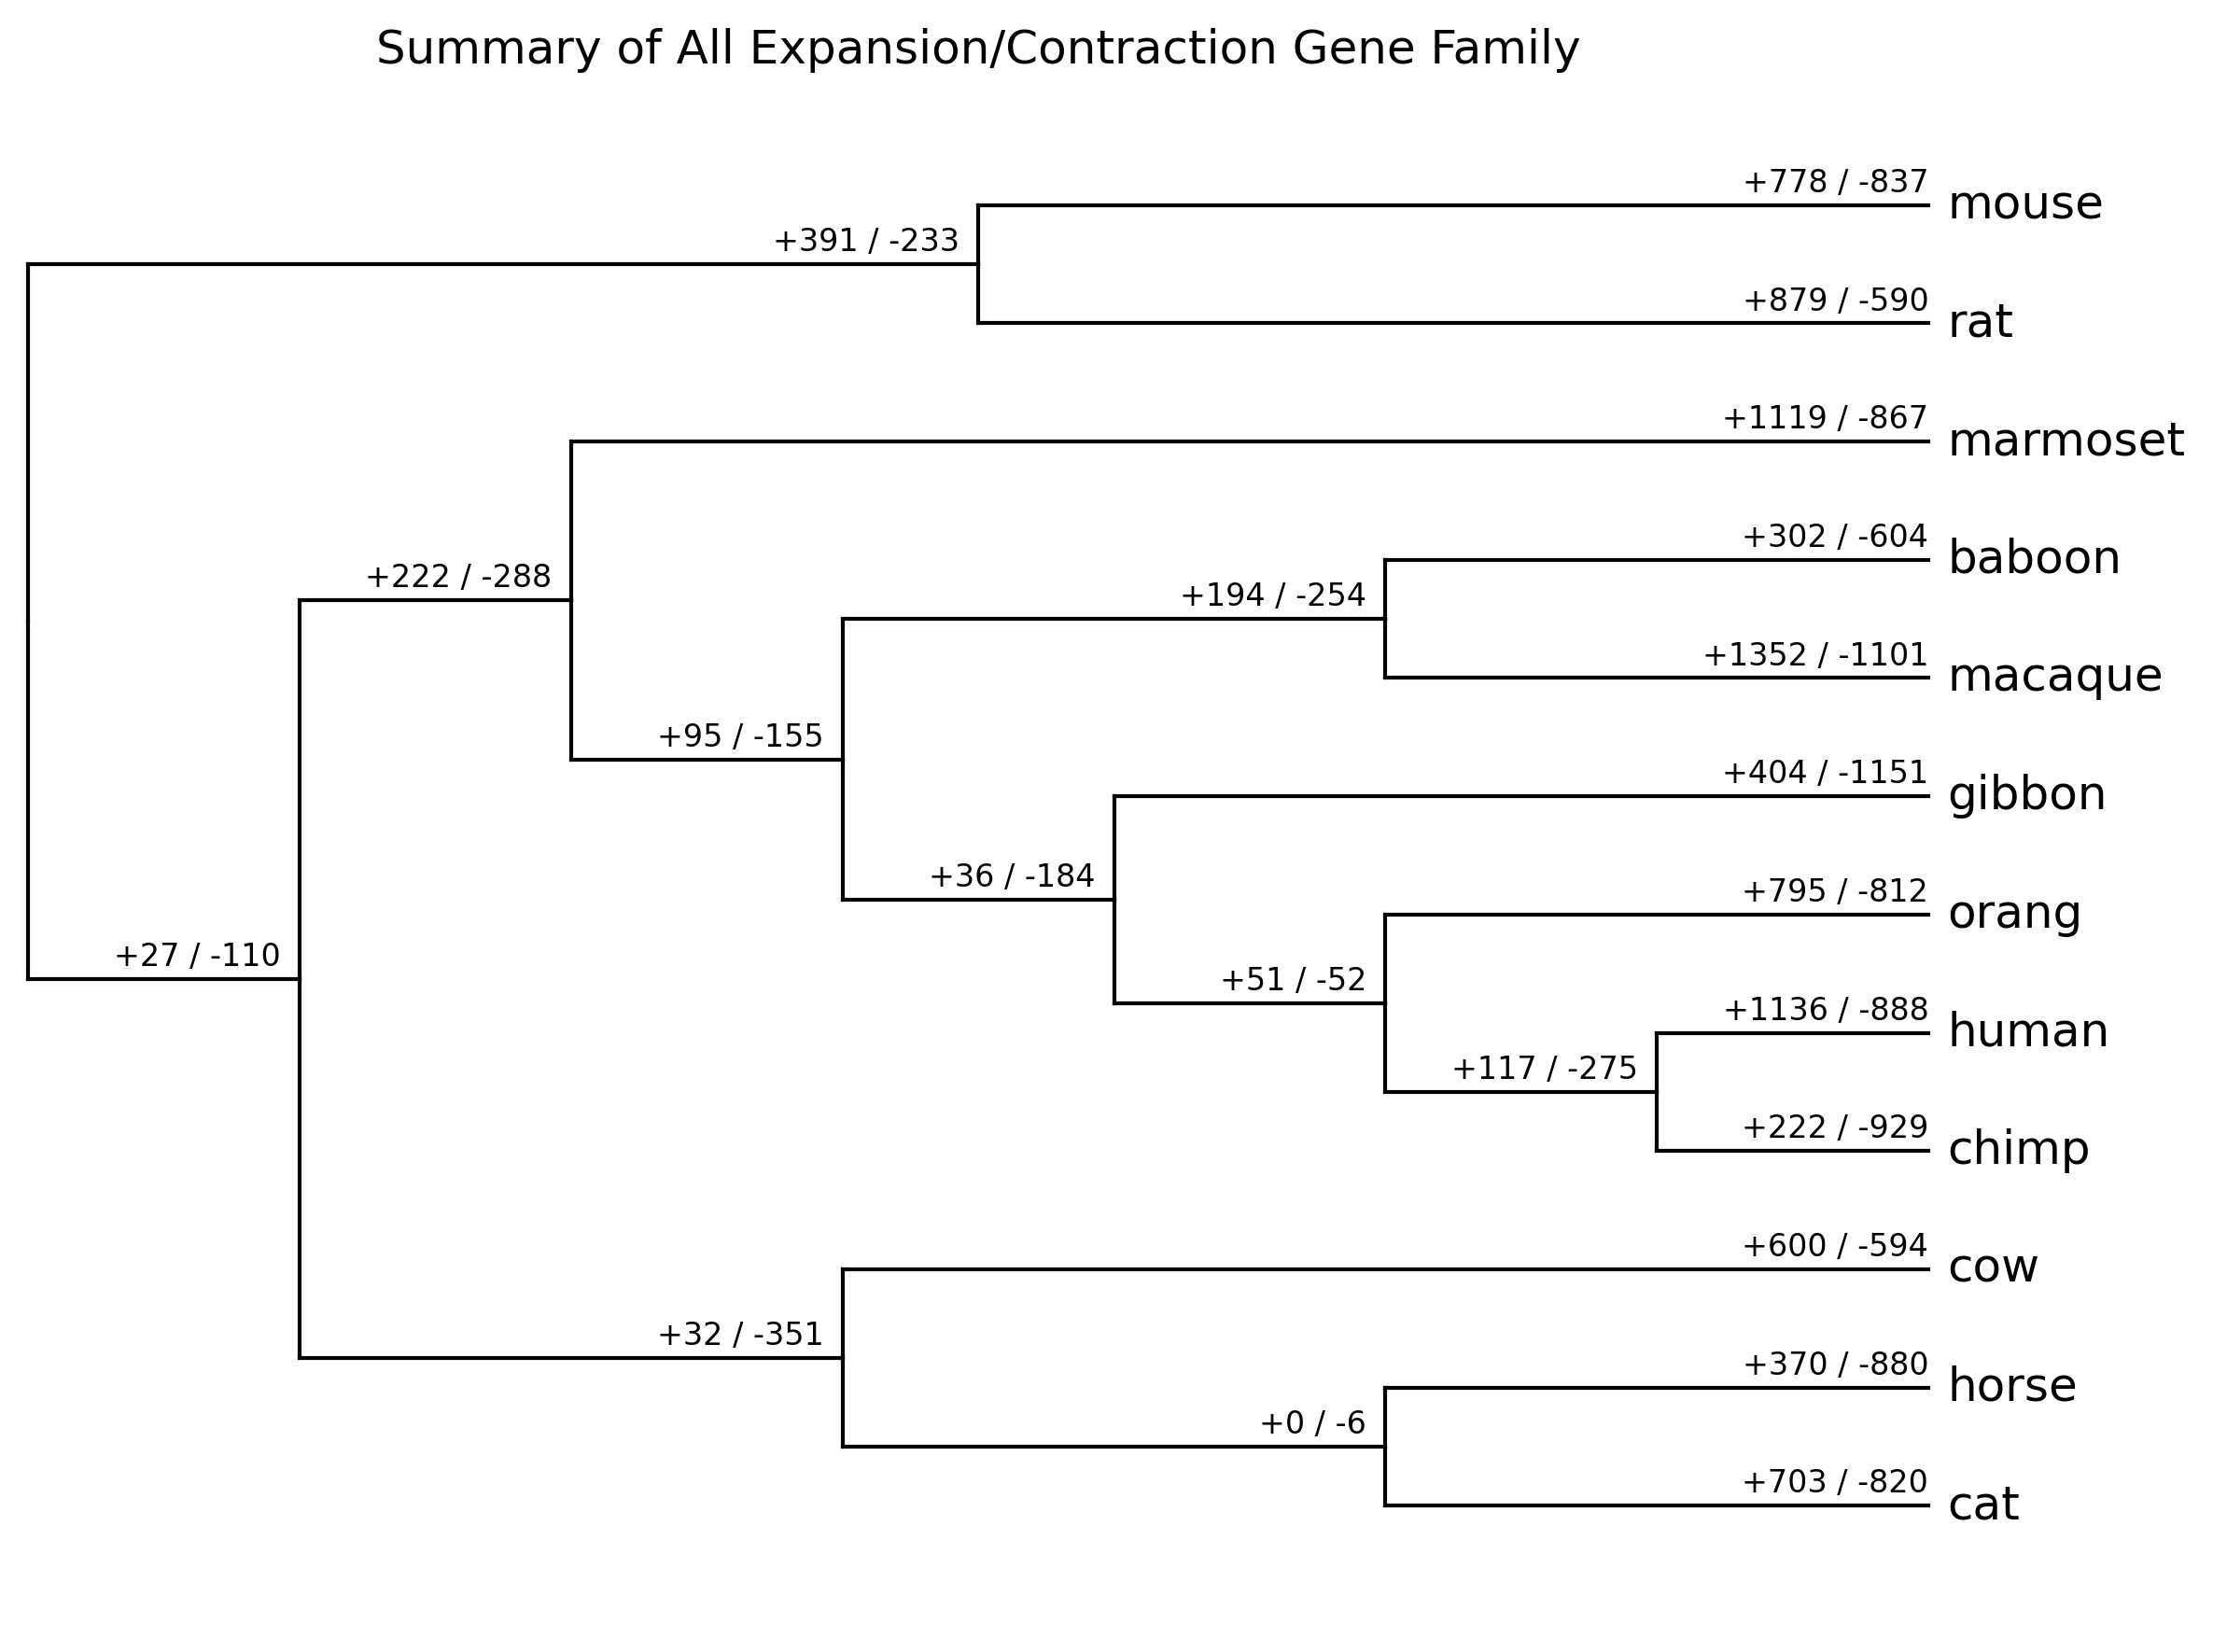
- **summary_all_gene_family.[png|jpg|svg|pdf]**
Summary of all expansion/contraction gene family result (from `*_clade_result.txt`)
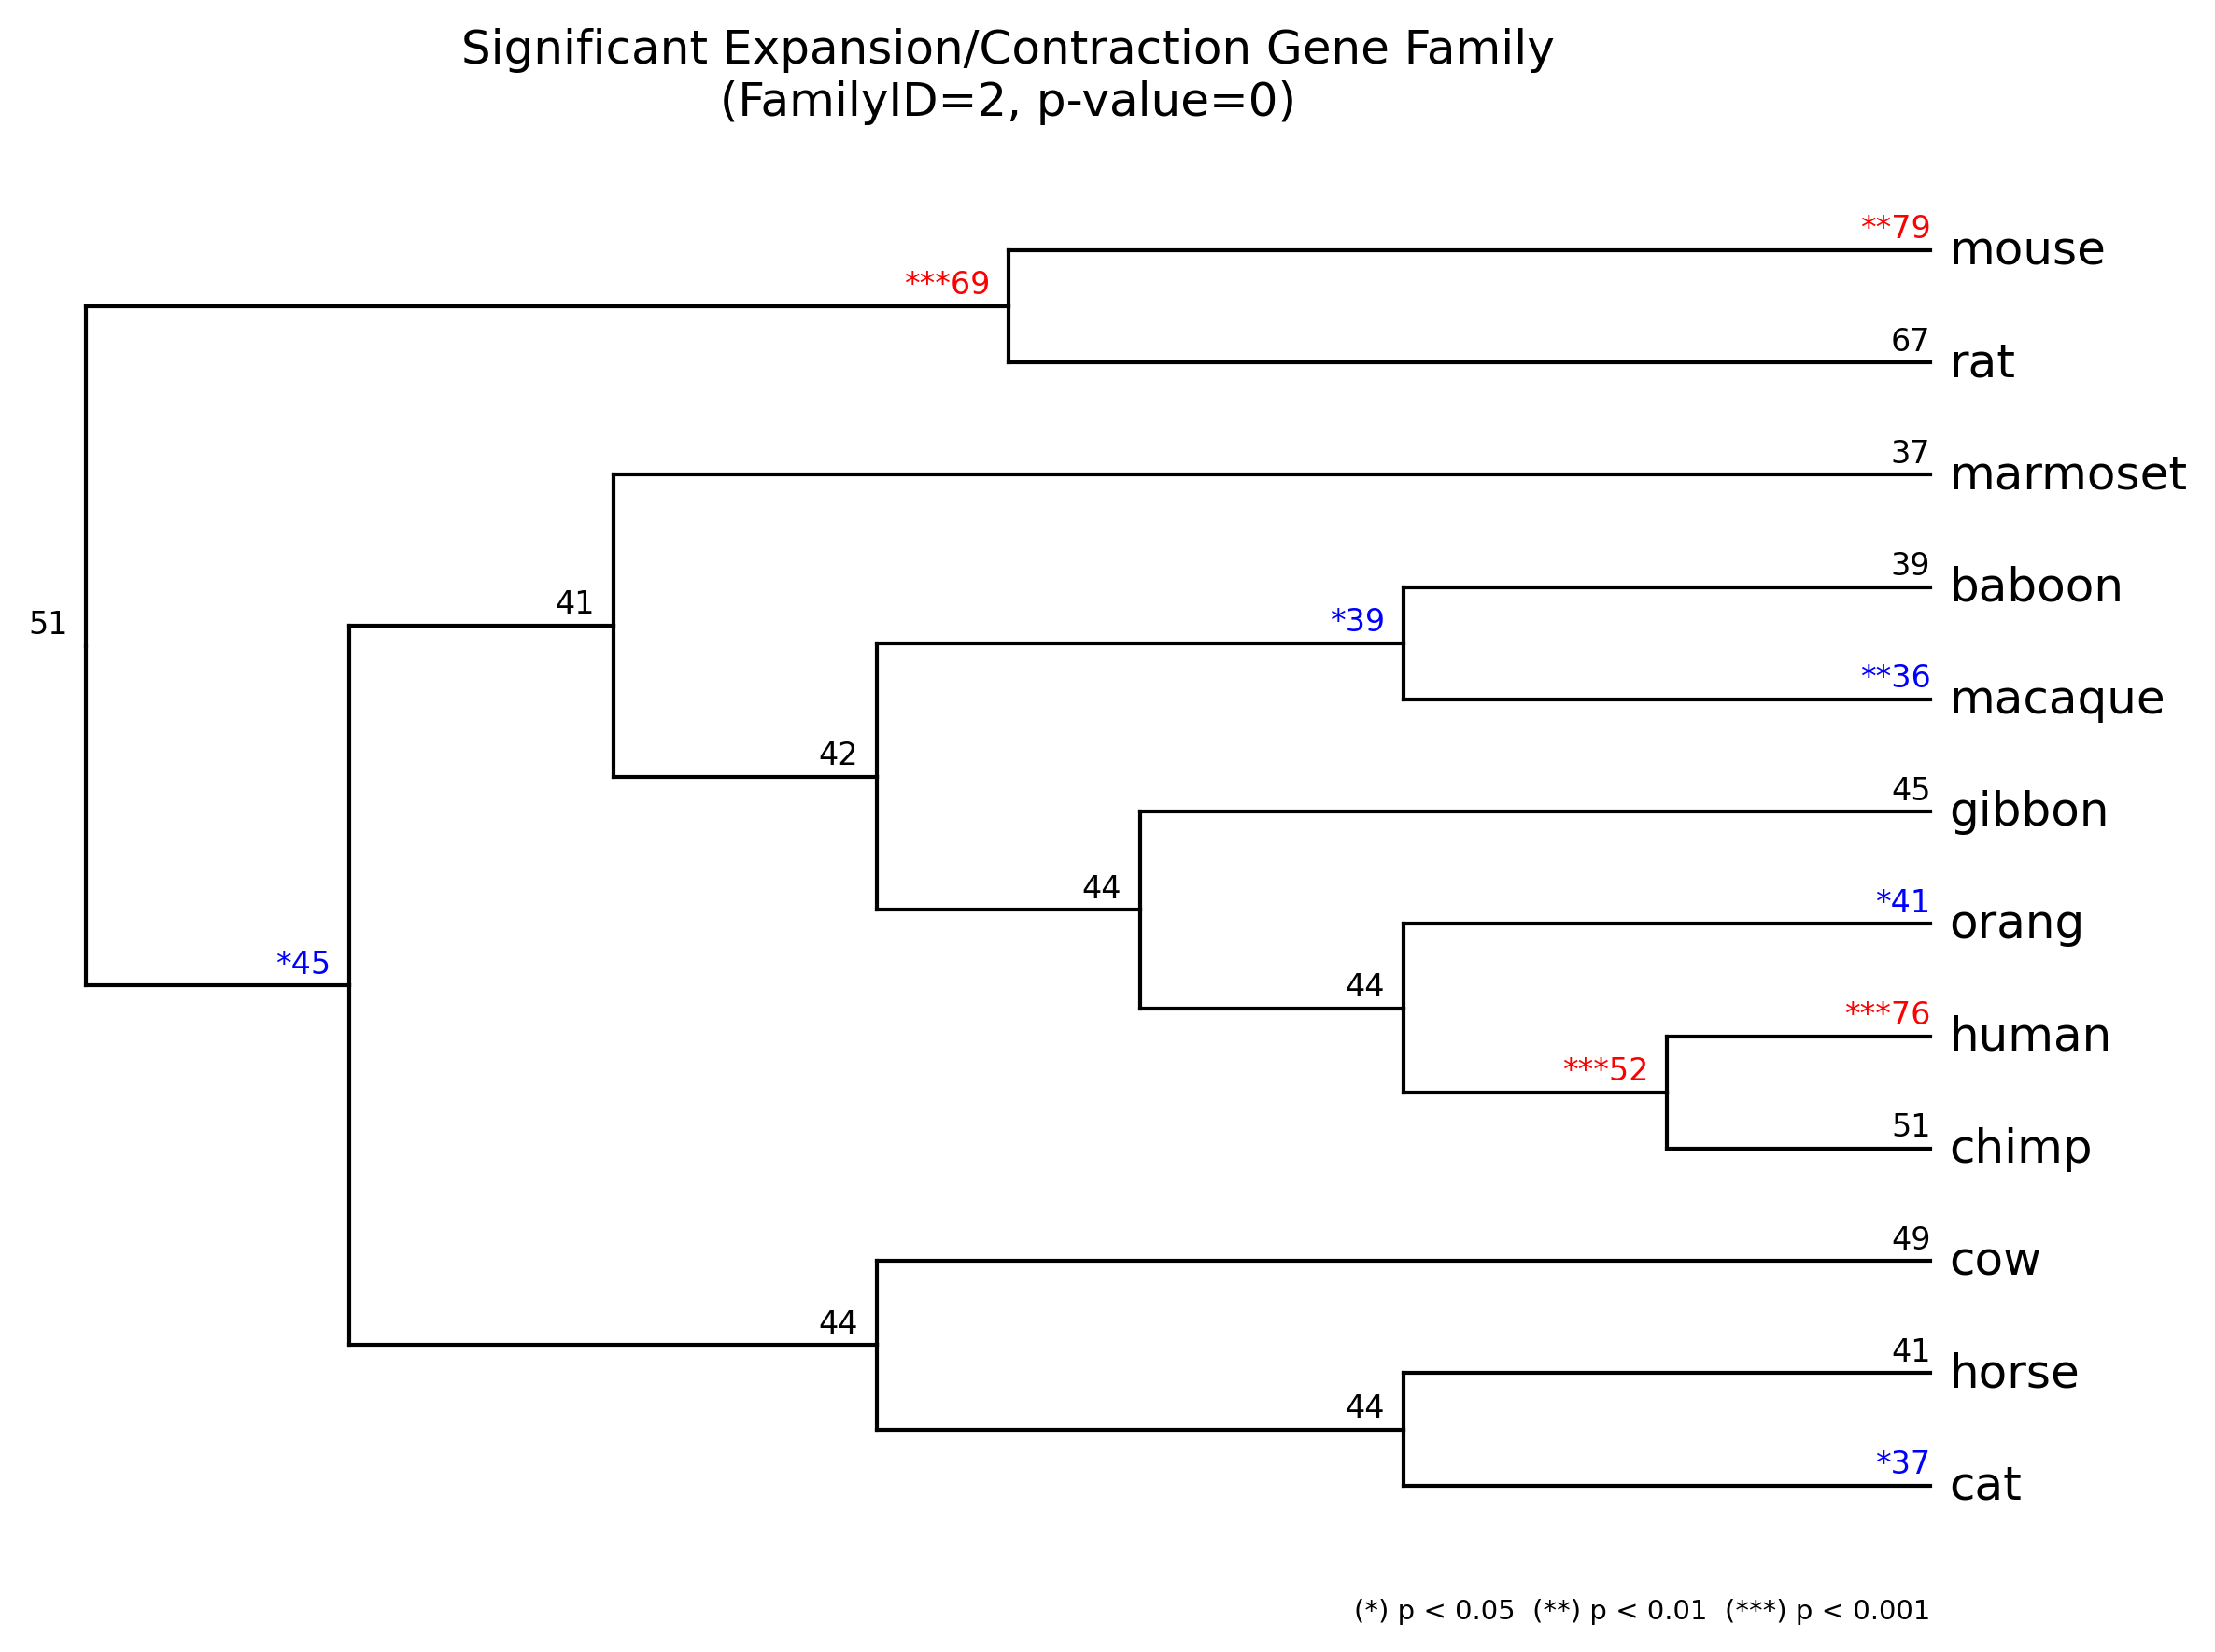
- **gene_family/{FamilyID}_gene_family.[png|jpg|svg|pdf]**
Significant expansion(*red*)/contraction(*blue*) gene family result
- **result_summary.tsv** ([example](https://raw.githubusercontent.com/moshi4/CafePlotter/main/examples/result_summary.tsv))
Significant expansion/contraction result summary for each family and taxon
Raw data
{
"_id": null,
"home_page": "https://github.com/moshi4/CafePlotter/",
"name": "cafeplotter",
"maintainer": "",
"docs_url": null,
"requires_python": ">=3.8.1",
"maintainer_email": "",
"keywords": "bioinformatics,phylogenetics,molecular-evolution,visualization,matplotlib",
"author": "moshi4",
"author_email": "",
"download_url": "https://files.pythonhosted.org/packages/61/ad/606104fa23f01c3c65c4e8c510006d3c0228d50496d0188e43c2e0b90a3a/cafeplotter-0.2.0.tar.gz",
"platform": null,
"description": "# CafePlotter\n\n\n\n\n[](https://pypi.python.org/pypi/cafeplotter)\n[](https://github.com/moshi4/CafePlotter/actions/workflows/ci.yml)\n\n## Table of contents\n\n- [Overview](#overview)\n- [Installation](#installation)\n- [Usage](#usage)\n- [Output Contents](#output-contents)\n\n## Overview\n\nCAFE (Computational Analysis of gene Family Evolution) is a software to analyze changes in gene family size in a way\nthat accounts for phylogenetic history and provides a statistical foundation for evolutionary inferences.\n\n[CAFE5](https://github.com/hahnlab/CAFE5) currently does not provide tools to visualize Expansion/Contraction of gene families on phylogenetic tree.\nTo solve this issue, I developed CafePlotter, a tool for plotting CAFE5 gene family expansion/contraction result.\n\n## Installation\n\n`Python 3.8 or later` is required for installation.\n\n**Install PyPI package:**\n\n pip install cafeplotter\n\n## Usage\n\n### Basic Command\n\n cafeplotter -i [CAFE5 result directory] -o [Output directory]\n\n### Options\n\n General Options:\n -i IN, --indir IN CAFE5 result directory as input\n -o OUT, --outdir OUT Output directory for plotting CAFE5 result\n --format Output image format ('png'[default]|'jpg'|'svg'|'pdf')\n -v, --version Print version information\n -h, --help Show this help message and exit\n\n Figure Appearence Options:\n --fig_height Figure height per leaf node of tree (Default: 0.5)\n --fig_width Figure width (Default: 8.0)\n --leaf_label_size Leaf label size (Default: 12)\n --count_label_size Gene count label size (Default: 8)\n --innode_label_size Internal node label size (Default: 0)\n --p_label_size Branch p-value label size (Default: 0)\n --ignore_branch_length Ignore branch length for plotting tree (Default: OFF)\n --expansion_color Plot color of gene family expansion (Default: 'red')\n --contraction_color Plot color of gene family contraction (Default: 'blue')\n --dpi Figure DPI (Default: 300)\n\n### Example Command\n\nUser can download example dataset ([singlelambda.zip](https://github.com/moshi4/CafePlotter/raw/main/examples/singlelambda.zip)):\n\n cafeplotter -i ./examples/singlelambda -o ./singlelambda_plot --ignore_branch_length\n\n## Output Contents\n\n- **summary_all_gene_family.[png|jpg|svg|pdf]** \n Summary of all expansion/contraction gene family result (from `*_clade_result.txt`)\n\n \n\n- **gene_family/{FamilyID}_gene_family.[png|jpg|svg|pdf]** \n Significant expansion(*red*)/contraction(*blue*) gene family result \n\n \n\n- **result_summary.tsv** ([example](https://raw.githubusercontent.com/moshi4/CafePlotter/main/examples/result_summary.tsv)) \n Significant expansion/contraction result summary for each family and taxon\n",
"bugtrack_url": null,
"license": "MIT",
"summary": "A tool for plotting CAFE5 gene family expansion/contraction result",
"version": "0.2.0",
"project_urls": {
"Homepage": "https://github.com/moshi4/CafePlotter/",
"Repository": "https://github.com/moshi4/CafePlotter/"
},
"split_keywords": [
"bioinformatics",
"phylogenetics",
"molecular-evolution",
"visualization",
"matplotlib"
],
"urls": [
{
"comment_text": "",
"digests": {
"blake2b_256": "e0e568b5b62408f84947e645407f46942b07688392989c9a469e8df87c3e554a",
"md5": "f836913c2d629f85f1d690781358869f",
"sha256": "be91a0479b0abfa65987abf83d26ba36079d2f0d1992302de67ca798ba6c3b44"
},
"downloads": -1,
"filename": "cafeplotter-0.2.0-py3-none-any.whl",
"has_sig": false,
"md5_digest": "f836913c2d629f85f1d690781358869f",
"packagetype": "bdist_wheel",
"python_version": "py3",
"requires_python": ">=3.8.1",
"size": 14137,
"upload_time": "2023-09-22T12:59:35",
"upload_time_iso_8601": "2023-09-22T12:59:35.861741Z",
"url": "https://files.pythonhosted.org/packages/e0/e5/68b5b62408f84947e645407f46942b07688392989c9a469e8df87c3e554a/cafeplotter-0.2.0-py3-none-any.whl",
"yanked": false,
"yanked_reason": null
},
{
"comment_text": "",
"digests": {
"blake2b_256": "61ad606104fa23f01c3c65c4e8c510006d3c0228d50496d0188e43c2e0b90a3a",
"md5": "88e5c3701090378f4552f9600c9b413a",
"sha256": "a03551158d7d991514c7f53f88dd92c49e0935ae9a344f1a1c95c8d79505bb85"
},
"downloads": -1,
"filename": "cafeplotter-0.2.0.tar.gz",
"has_sig": false,
"md5_digest": "88e5c3701090378f4552f9600c9b413a",
"packagetype": "sdist",
"python_version": "source",
"requires_python": ">=3.8.1",
"size": 362426,
"upload_time": "2023-09-22T12:59:36",
"upload_time_iso_8601": "2023-09-22T12:59:36.954497Z",
"url": "https://files.pythonhosted.org/packages/61/ad/606104fa23f01c3c65c4e8c510006d3c0228d50496d0188e43c2e0b90a3a/cafeplotter-0.2.0.tar.gz",
"yanked": false,
"yanked_reason": null
}
],
"upload_time": "2023-09-22 12:59:36",
"github": true,
"gitlab": false,
"bitbucket": false,
"codeberg": false,
"github_user": "moshi4",
"github_project": "CafePlotter",
"travis_ci": false,
"coveralls": false,
"github_actions": true,
"lcname": "cafeplotter"
}

