# phyTreeViz


[](https://pypi.python.org/pypi/phytreeviz)
[](https://github.com/moshi4/phyTreeViz/actions/workflows/ci.yml)
## Table of contents
- [Overview](#overview)
- [Installation](#installation)
- [API Usage](#api-usage)
- [CLI Usage](#cli-usage)
## Overview
phyTreeViz is a simple and minimal phylogenetic tree visualization python package implemented based on matplotlib.
This package was developed to enhance phylogenetic tree visualization functionality of BioPython.
phyTreeViz is intended to provide a simple and easy-to-use phylogenetic tree visualization function without complexity.
Therefore, if you need complex tree annotations, I recommend using [ete](https://github.com/etetoolkit/ete) or [ggtree](https://github.com/YuLab-SMU/ggtree).
## Installation
`Python 3.8 or later` is required for installation.
**Install PyPI package:**
pip install phytreeviz
## API Usage
Only simple example usage is described in this section.
For more details, please see [Getting Started](https://moshi4.github.io/phyTreeViz/getting_started/) and [API Docs](https://moshi4.github.io/phyTreeViz/api-docs/treeviz/).
### API Example
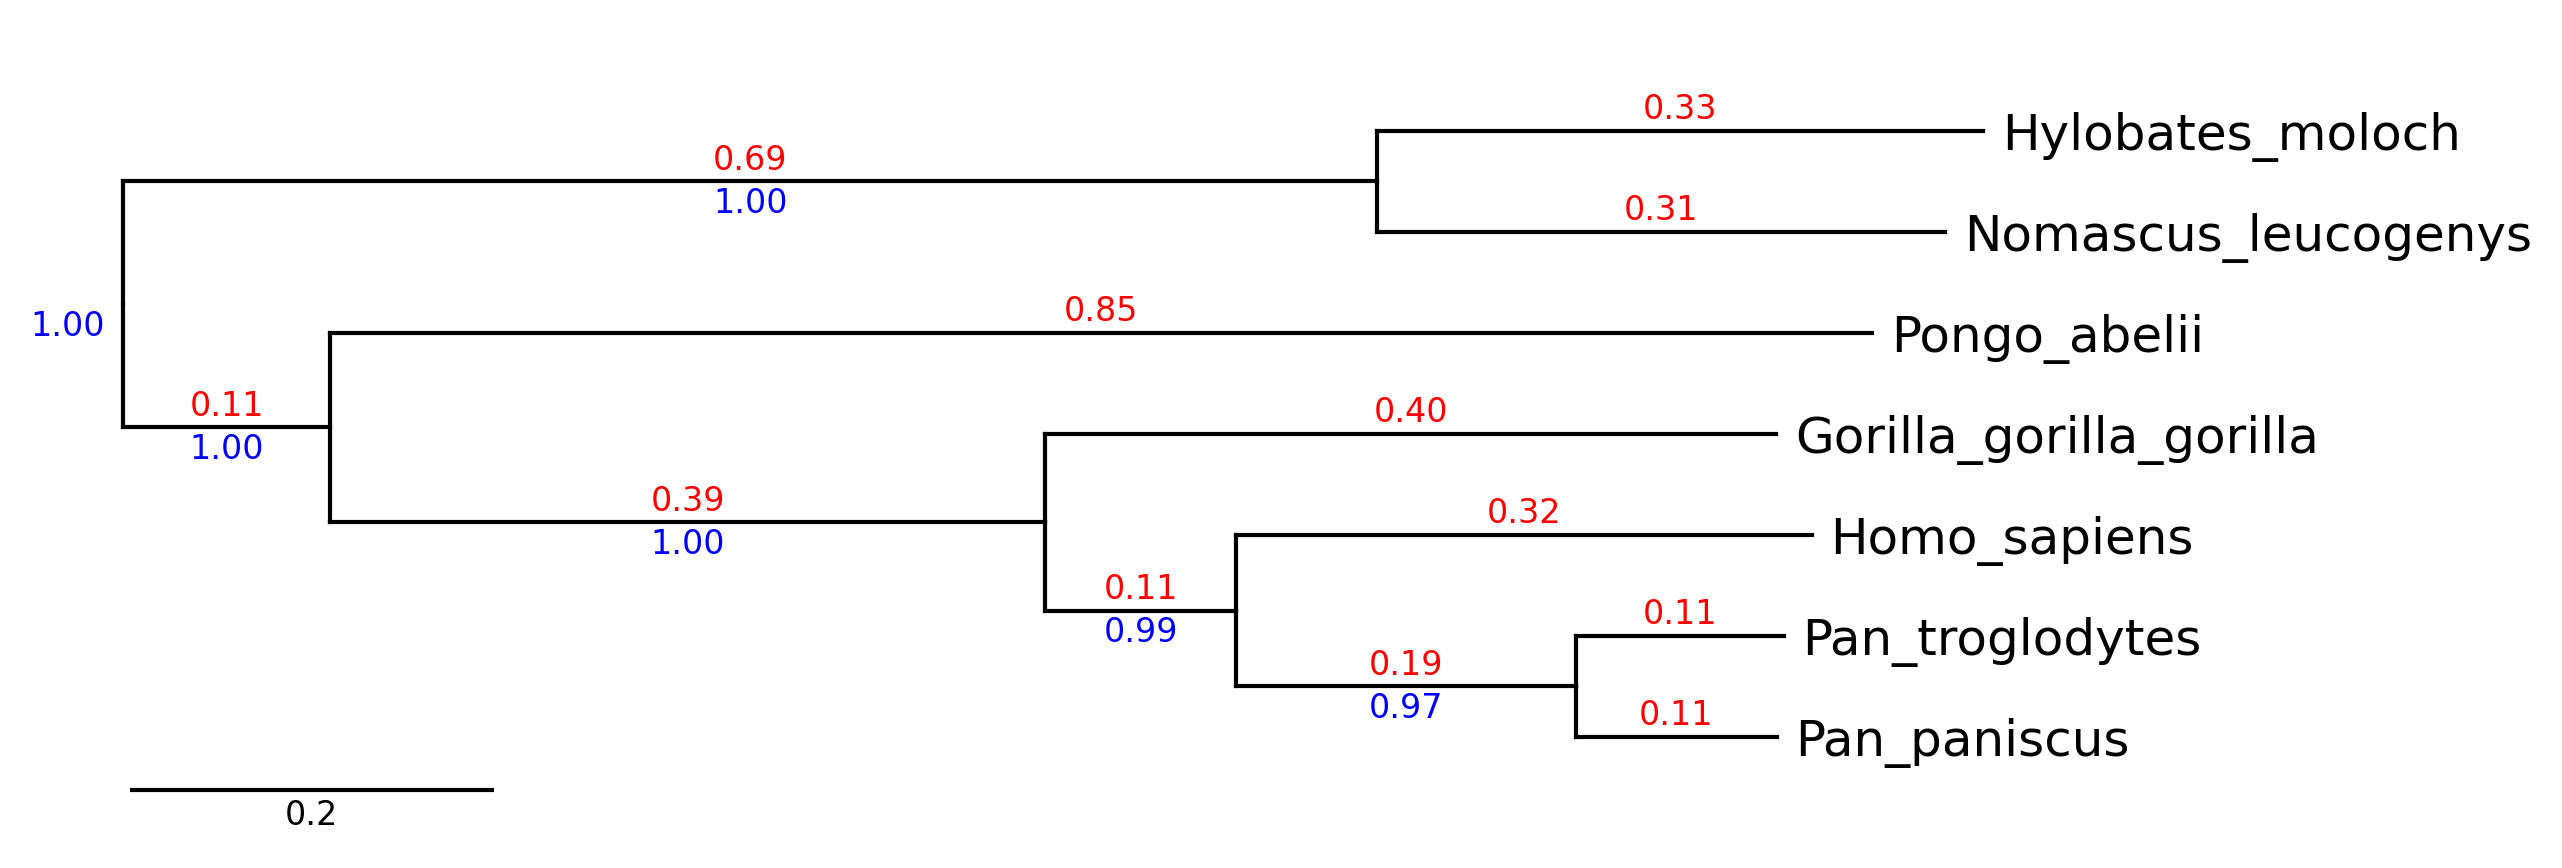
#### API Example 1
```python
from phytreeviz import TreeViz, load_example_tree_file
tree_file = load_example_tree_file("small_example.nwk")
tv = TreeViz(tree_file)
tv.show_branch_length(color="red")
tv.show_confidence(color="blue")
tv.show_scale_bar()
tv.savefig("api_example01.png", dpi=300)
```
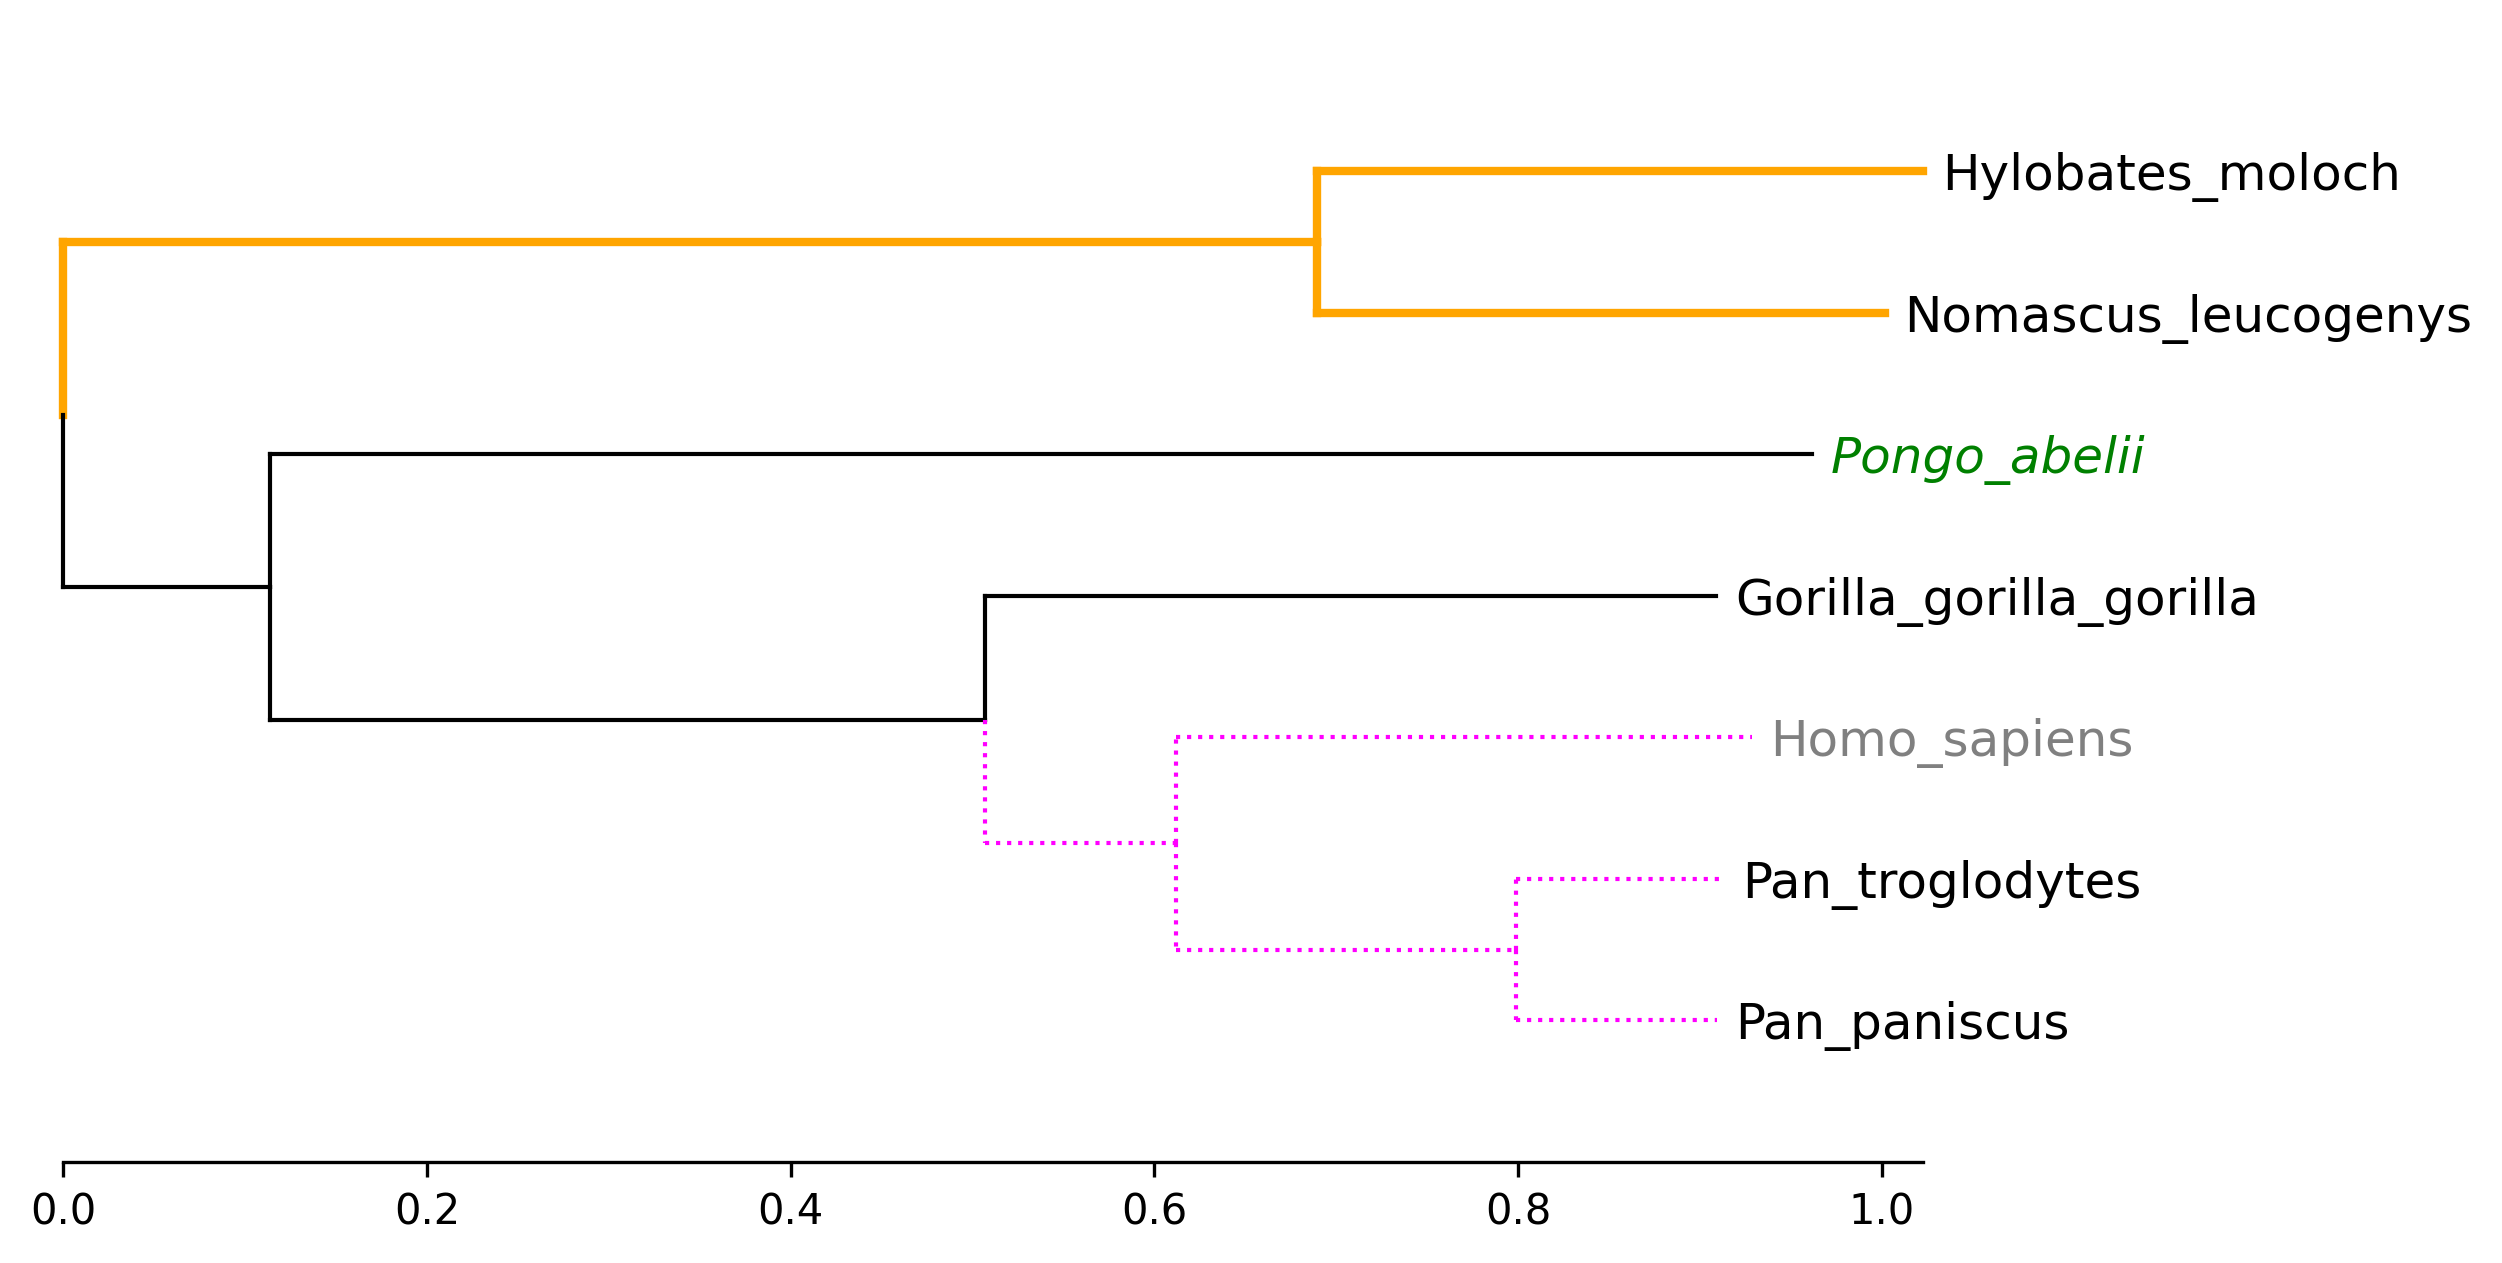
#### API Example 2
```python
from phytreeviz import TreeViz, load_example_tree_file
tree_file = load_example_tree_file("small_example.nwk")
tv = TreeViz(tree_file, height=0.7)
tv.show_scale_axis()
tv.set_node_label_props("Homo_sapiens", color="grey")
tv.set_node_label_props("Pongo_abelii", color="green", style="italic")
tv.set_node_line_props(["Hylobates_moloch", "Nomascus_leucogenys"], color="orange", lw=2)
tv.set_node_line_props(["Homo_sapiens", "Pan_troglodytes", "Pan_paniscus"], color="magenta", ls="dotted")
tv.savefig("api_example02.png", dpi=300)
```
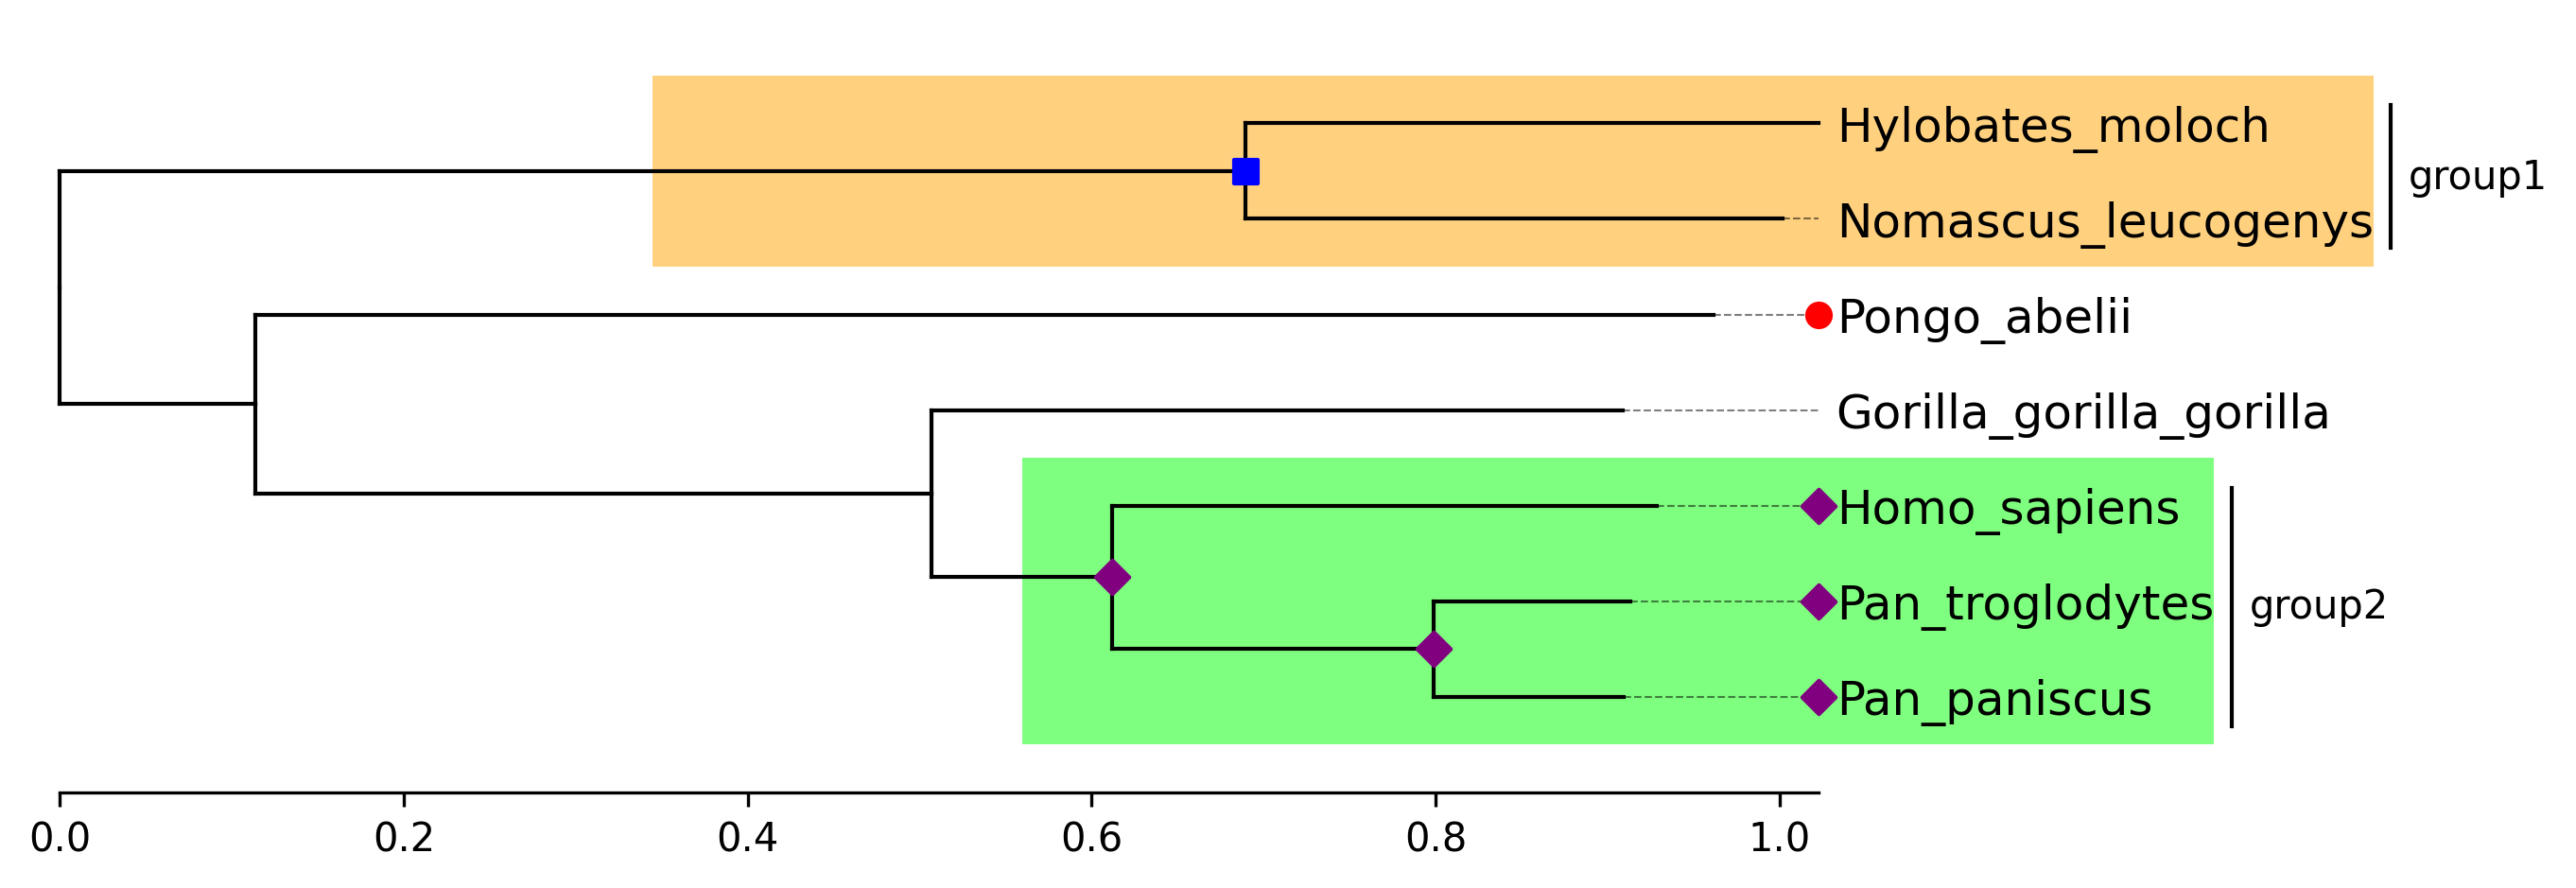
#### API Example 3
```python
from phytreeviz import TreeViz, load_example_tree_file
tree_file = load_example_tree_file("small_example.nwk")
tv = TreeViz(tree_file, align_leaf_label=True)
tv.show_scale_axis()
group1 = ["Hylobates_moloch", "Nomascus_leucogenys"]
group2 = ["Homo_sapiens", "Pan_paniscus"]
tv.highlight(group1, "orange")
tv.highlight(group2, "lime")
tv.annotate(group1, "group1")
tv.annotate(group2, "group2")
tv.marker(group1, marker="s", color="blue")
tv.marker(group2, marker="D", color="purple", descendent=True)
tv.marker("Pongo_abelii", color="red")
tv.savefig("api_example03.png", dpi=300)
```
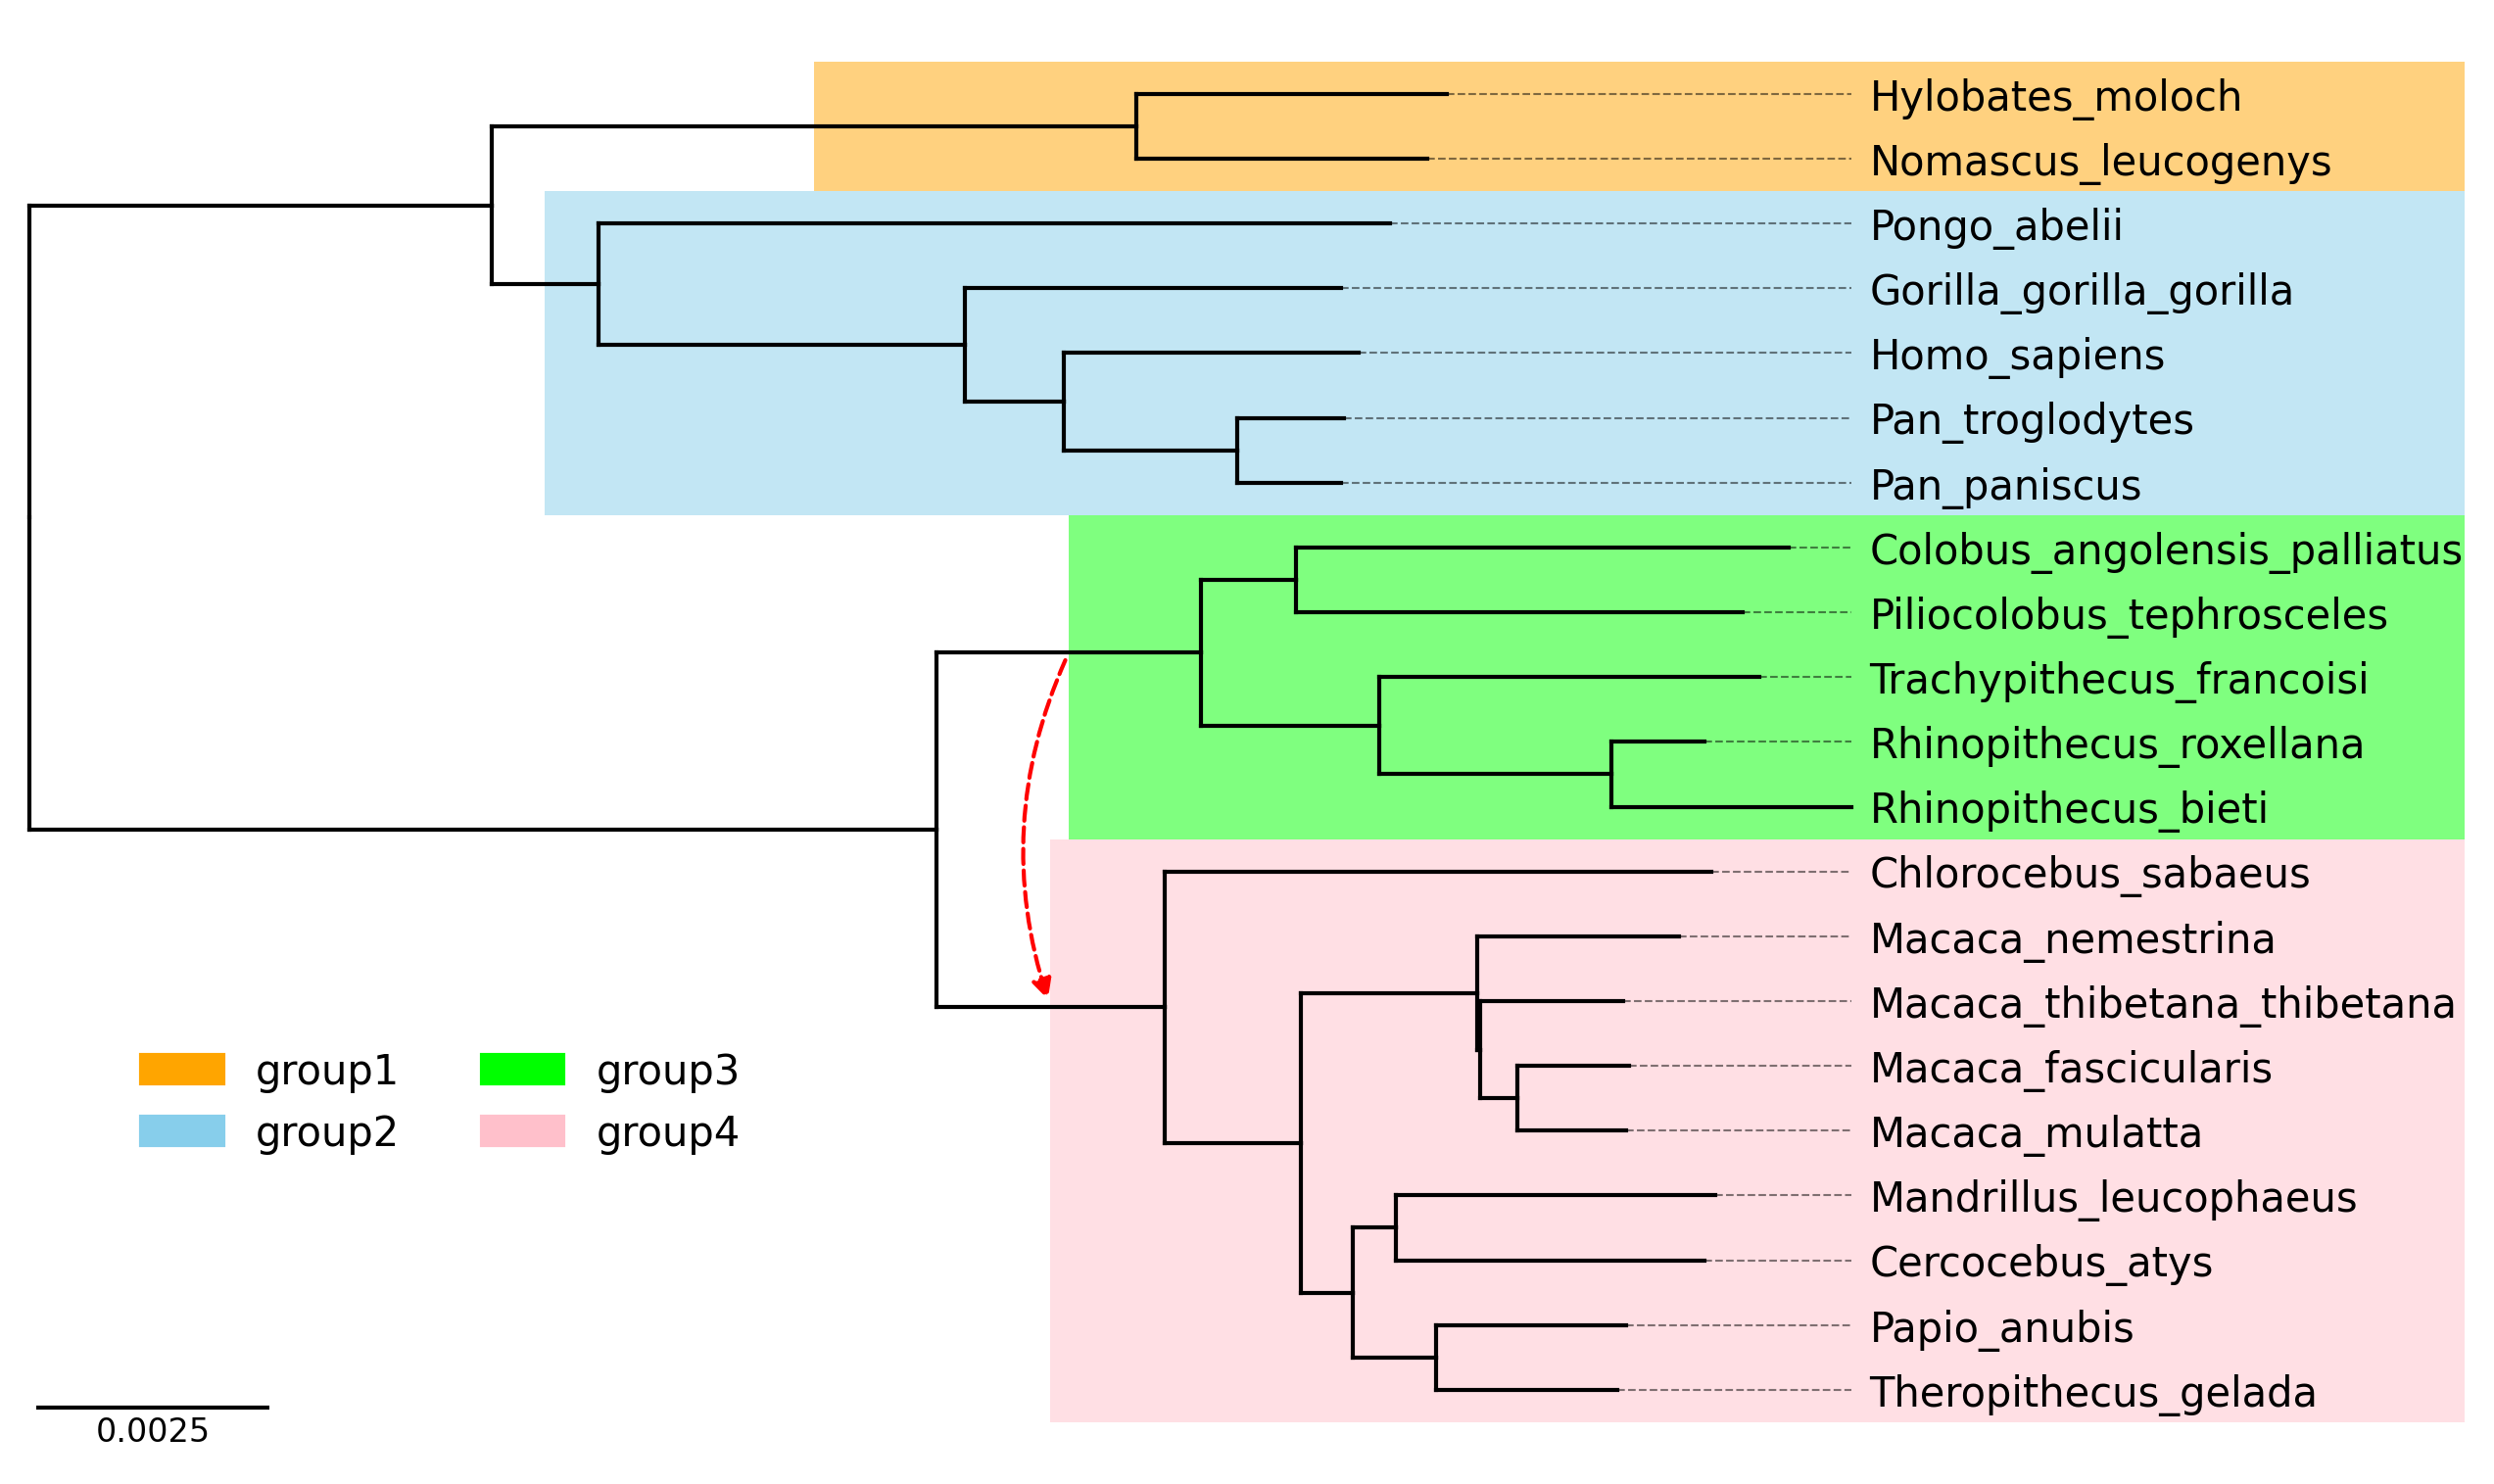
#### API Example 4
```python
from phytreeviz import TreeViz, load_example_tree_file
from matplotlib.patches import Patch
tree_file = load_example_tree_file("medium_example.nwk")
tv = TreeViz(tree_file, height=0.3, align_leaf_label=True, leaf_label_size=10)
tv.show_scale_bar()
group1 = ["Hylobates_moloch", "Nomascus_leucogenys"]
group2 = ["Homo_sapiens", "Pongo_abelii"]
group3 = ["Piliocolobus_tephrosceles", "Rhinopithecus_bieti"]
group4 = ["Chlorocebus_sabaeus", "Papio_anubis"]
tv.highlight(group1, "orange", area="full")
tv.highlight(group2, "skyblue", area="full")
tv.highlight(group3, "lime", area="full")
tv.highlight(group4, "pink", area="full")
tv.link(group3, group4, connectionstyle="arc3,rad=0.2")
fig = tv.plotfig()
_ = fig.legend(
handles=[
Patch(label="group1", color="orange"),
Patch(label="group2", color="skyblue"),
Patch(label="group3", color="lime"),
Patch(label="group4", color="pink"),
],
frameon=False,
bbox_to_anchor=(0.3, 0.3),
loc="center",
ncols=2,
)
fig.savefig("api_example04.png", dpi=300)
```
## CLI Usage
phyTreeViz provides simple phylogenetic tree visualization CLI.
### Basic Command
phytreeviz -i [Tree file or text] -o [Tree visualization file]
### Options
General Options:
-i IN, --intree IN Input phylogenetic tree file or text
-o OUT, --outfile OUT Output phylogenetic tree plot file [*.png|*.jpg|*.svg|*.pdf]
--format Input phylogenetic tree format (Default: 'newick')
-v, --version Print version information
-h, --help Show this help message and exit
Figure Appearence Options:
--fig_height Figure height per leaf node of tree (Default: 0.5)
--fig_width Figure width (Default: 8.0)
--leaf_label_size Leaf label size (Default: 12)
--ignore_branch_length Ignore branch length for plotting tree (Default: OFF)
--align_leaf_label Align leaf label position (Default: OFF)
--show_branch_length Show branch length (Default: OFF)
--show_confidence Show confidence (Default: OFF)
--dpi Figure DPI (Default: 300)
Available Tree Format: ['newick', 'phyloxml', 'nexus', 'nexml', 'cdao']
### CLI Example
Click [here](https://github.com/moshi4/phyTreeViz/raw/main/example/example.zip) to download example tree files.
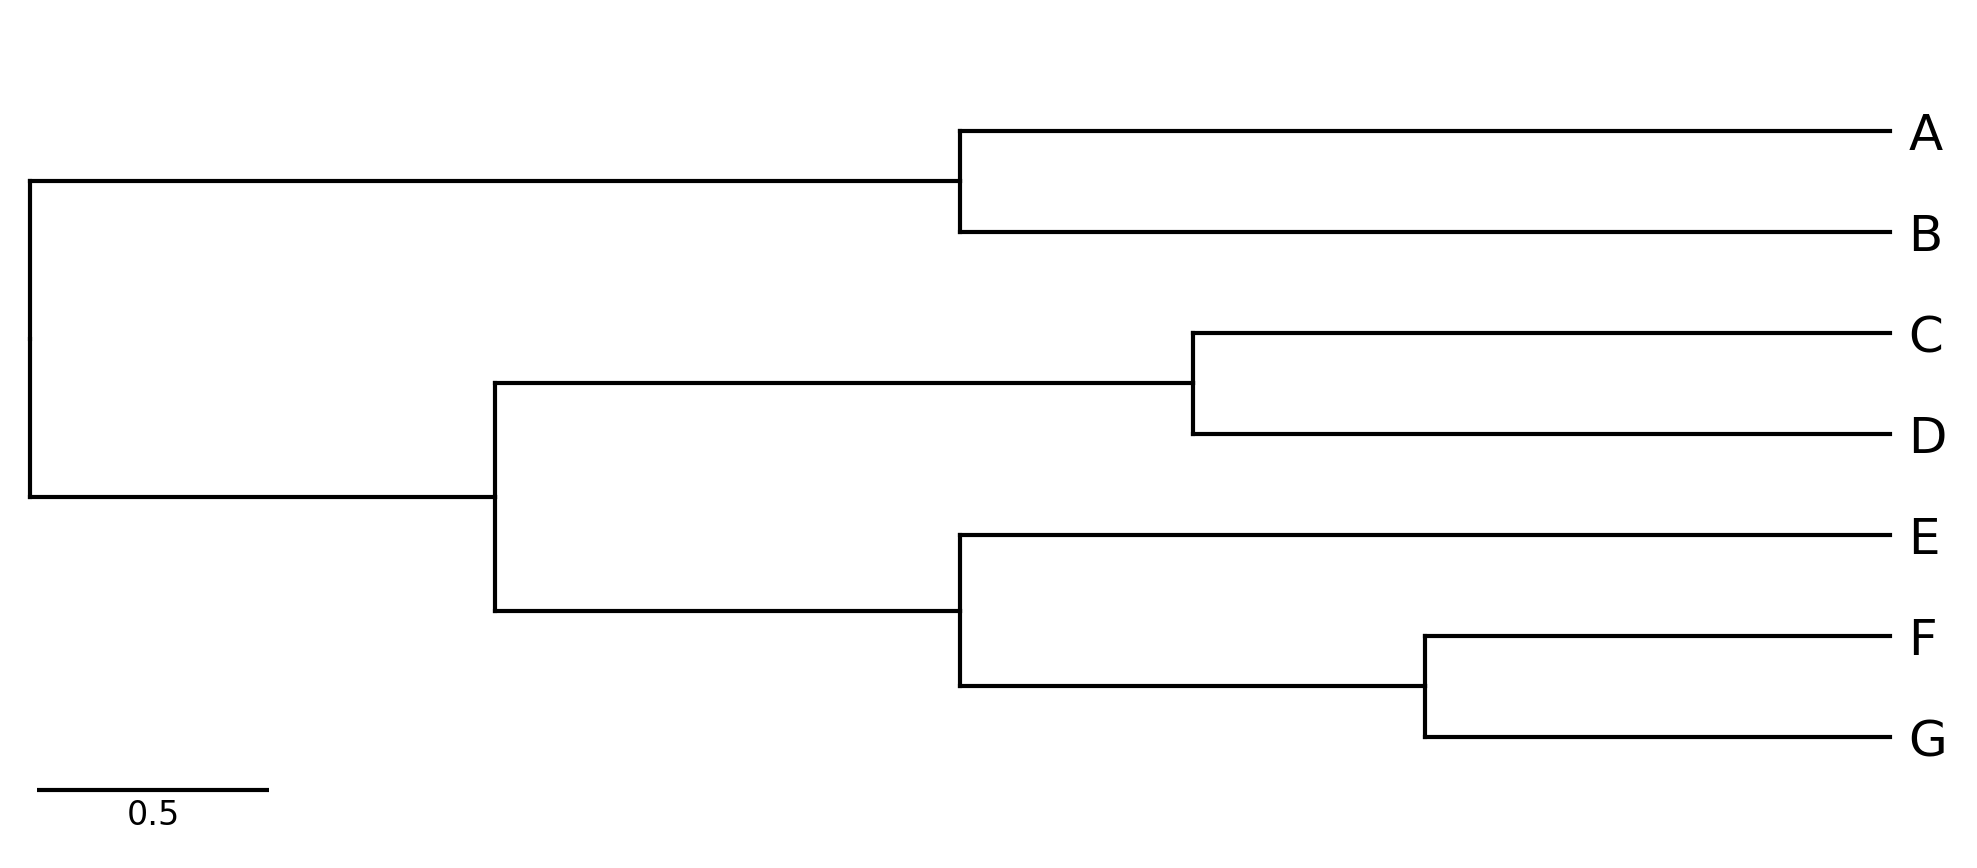
#### CLI Example 1
phytreeviz -i "((A,B),((C,D),(E,(F,G))));" -o cli_example01.png
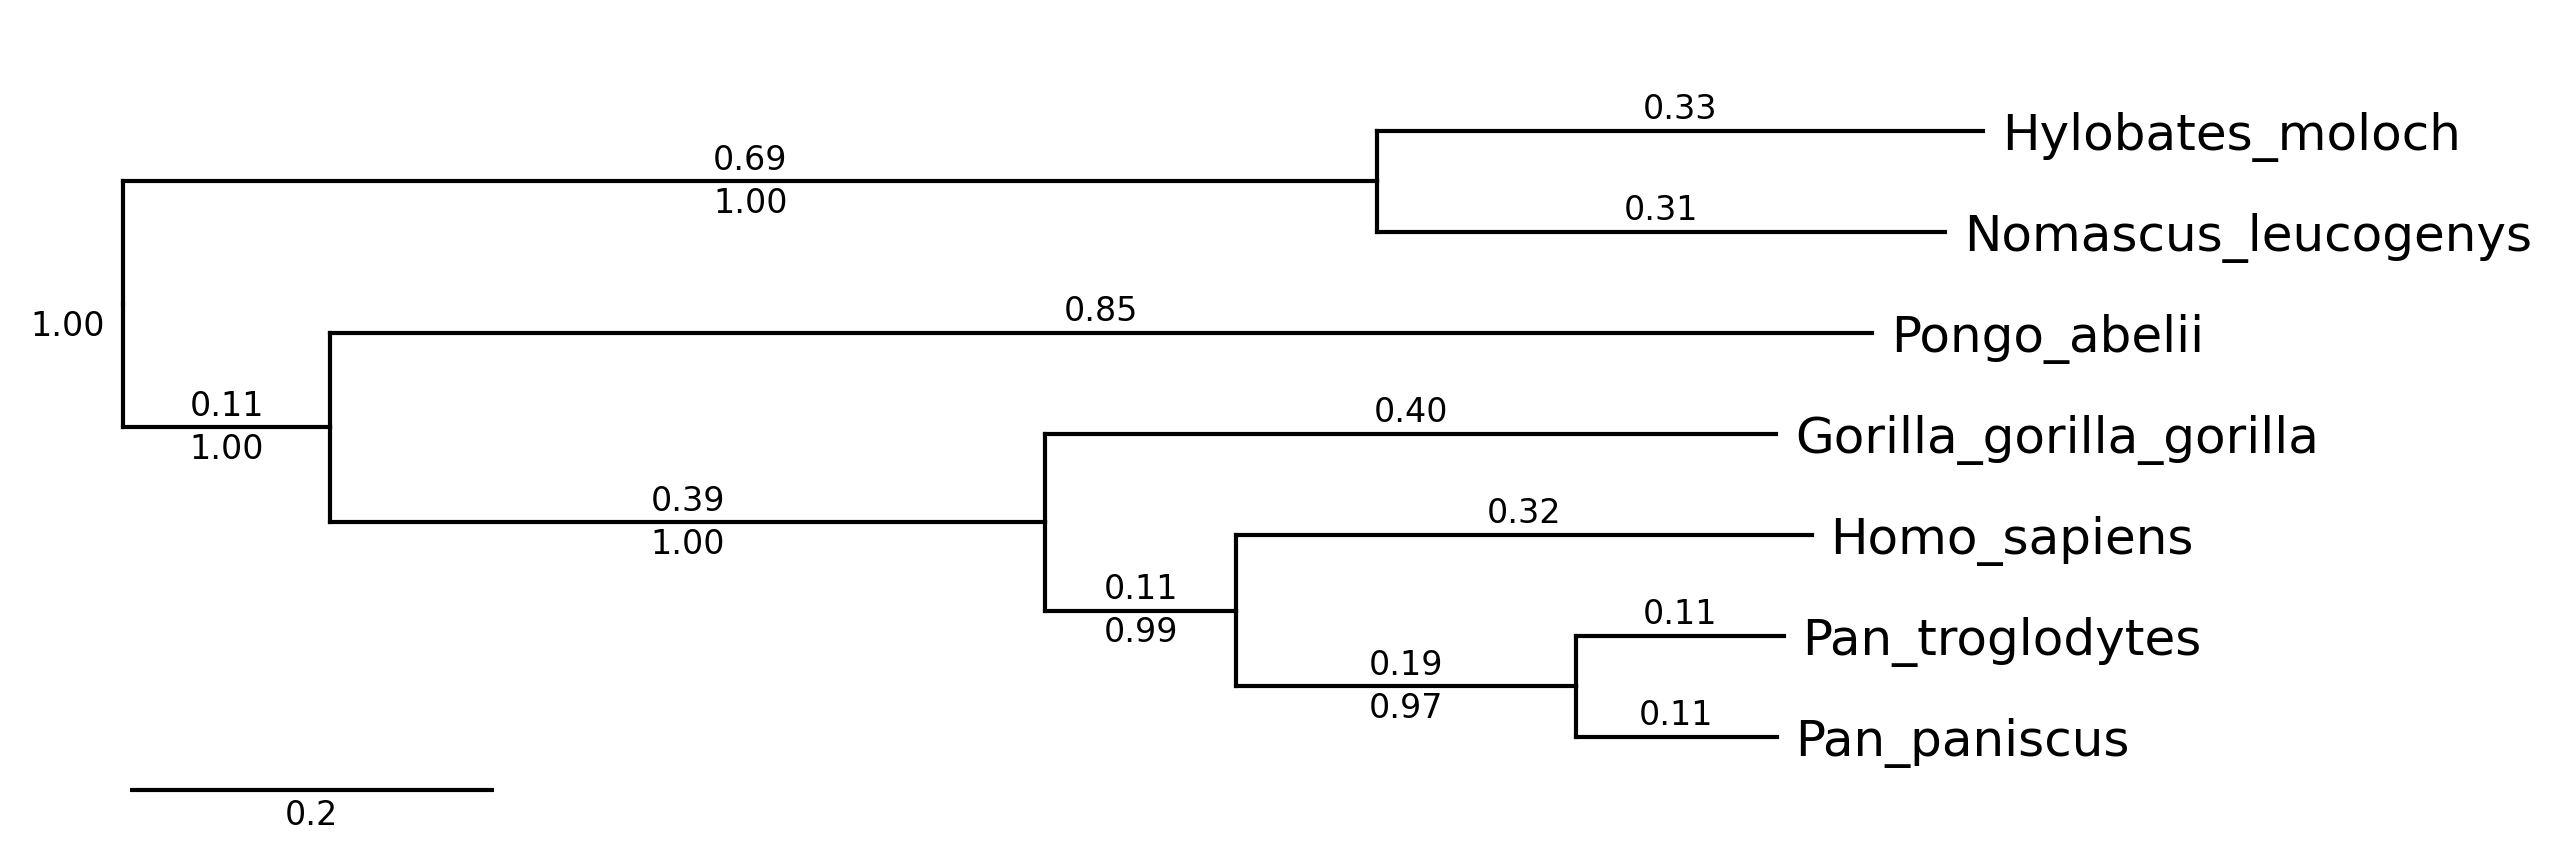
#### CLI Example 2
phytreeviz -i ./example/small_example.nwk -o cli_example02.png \
--show_branch_length --show_confidence
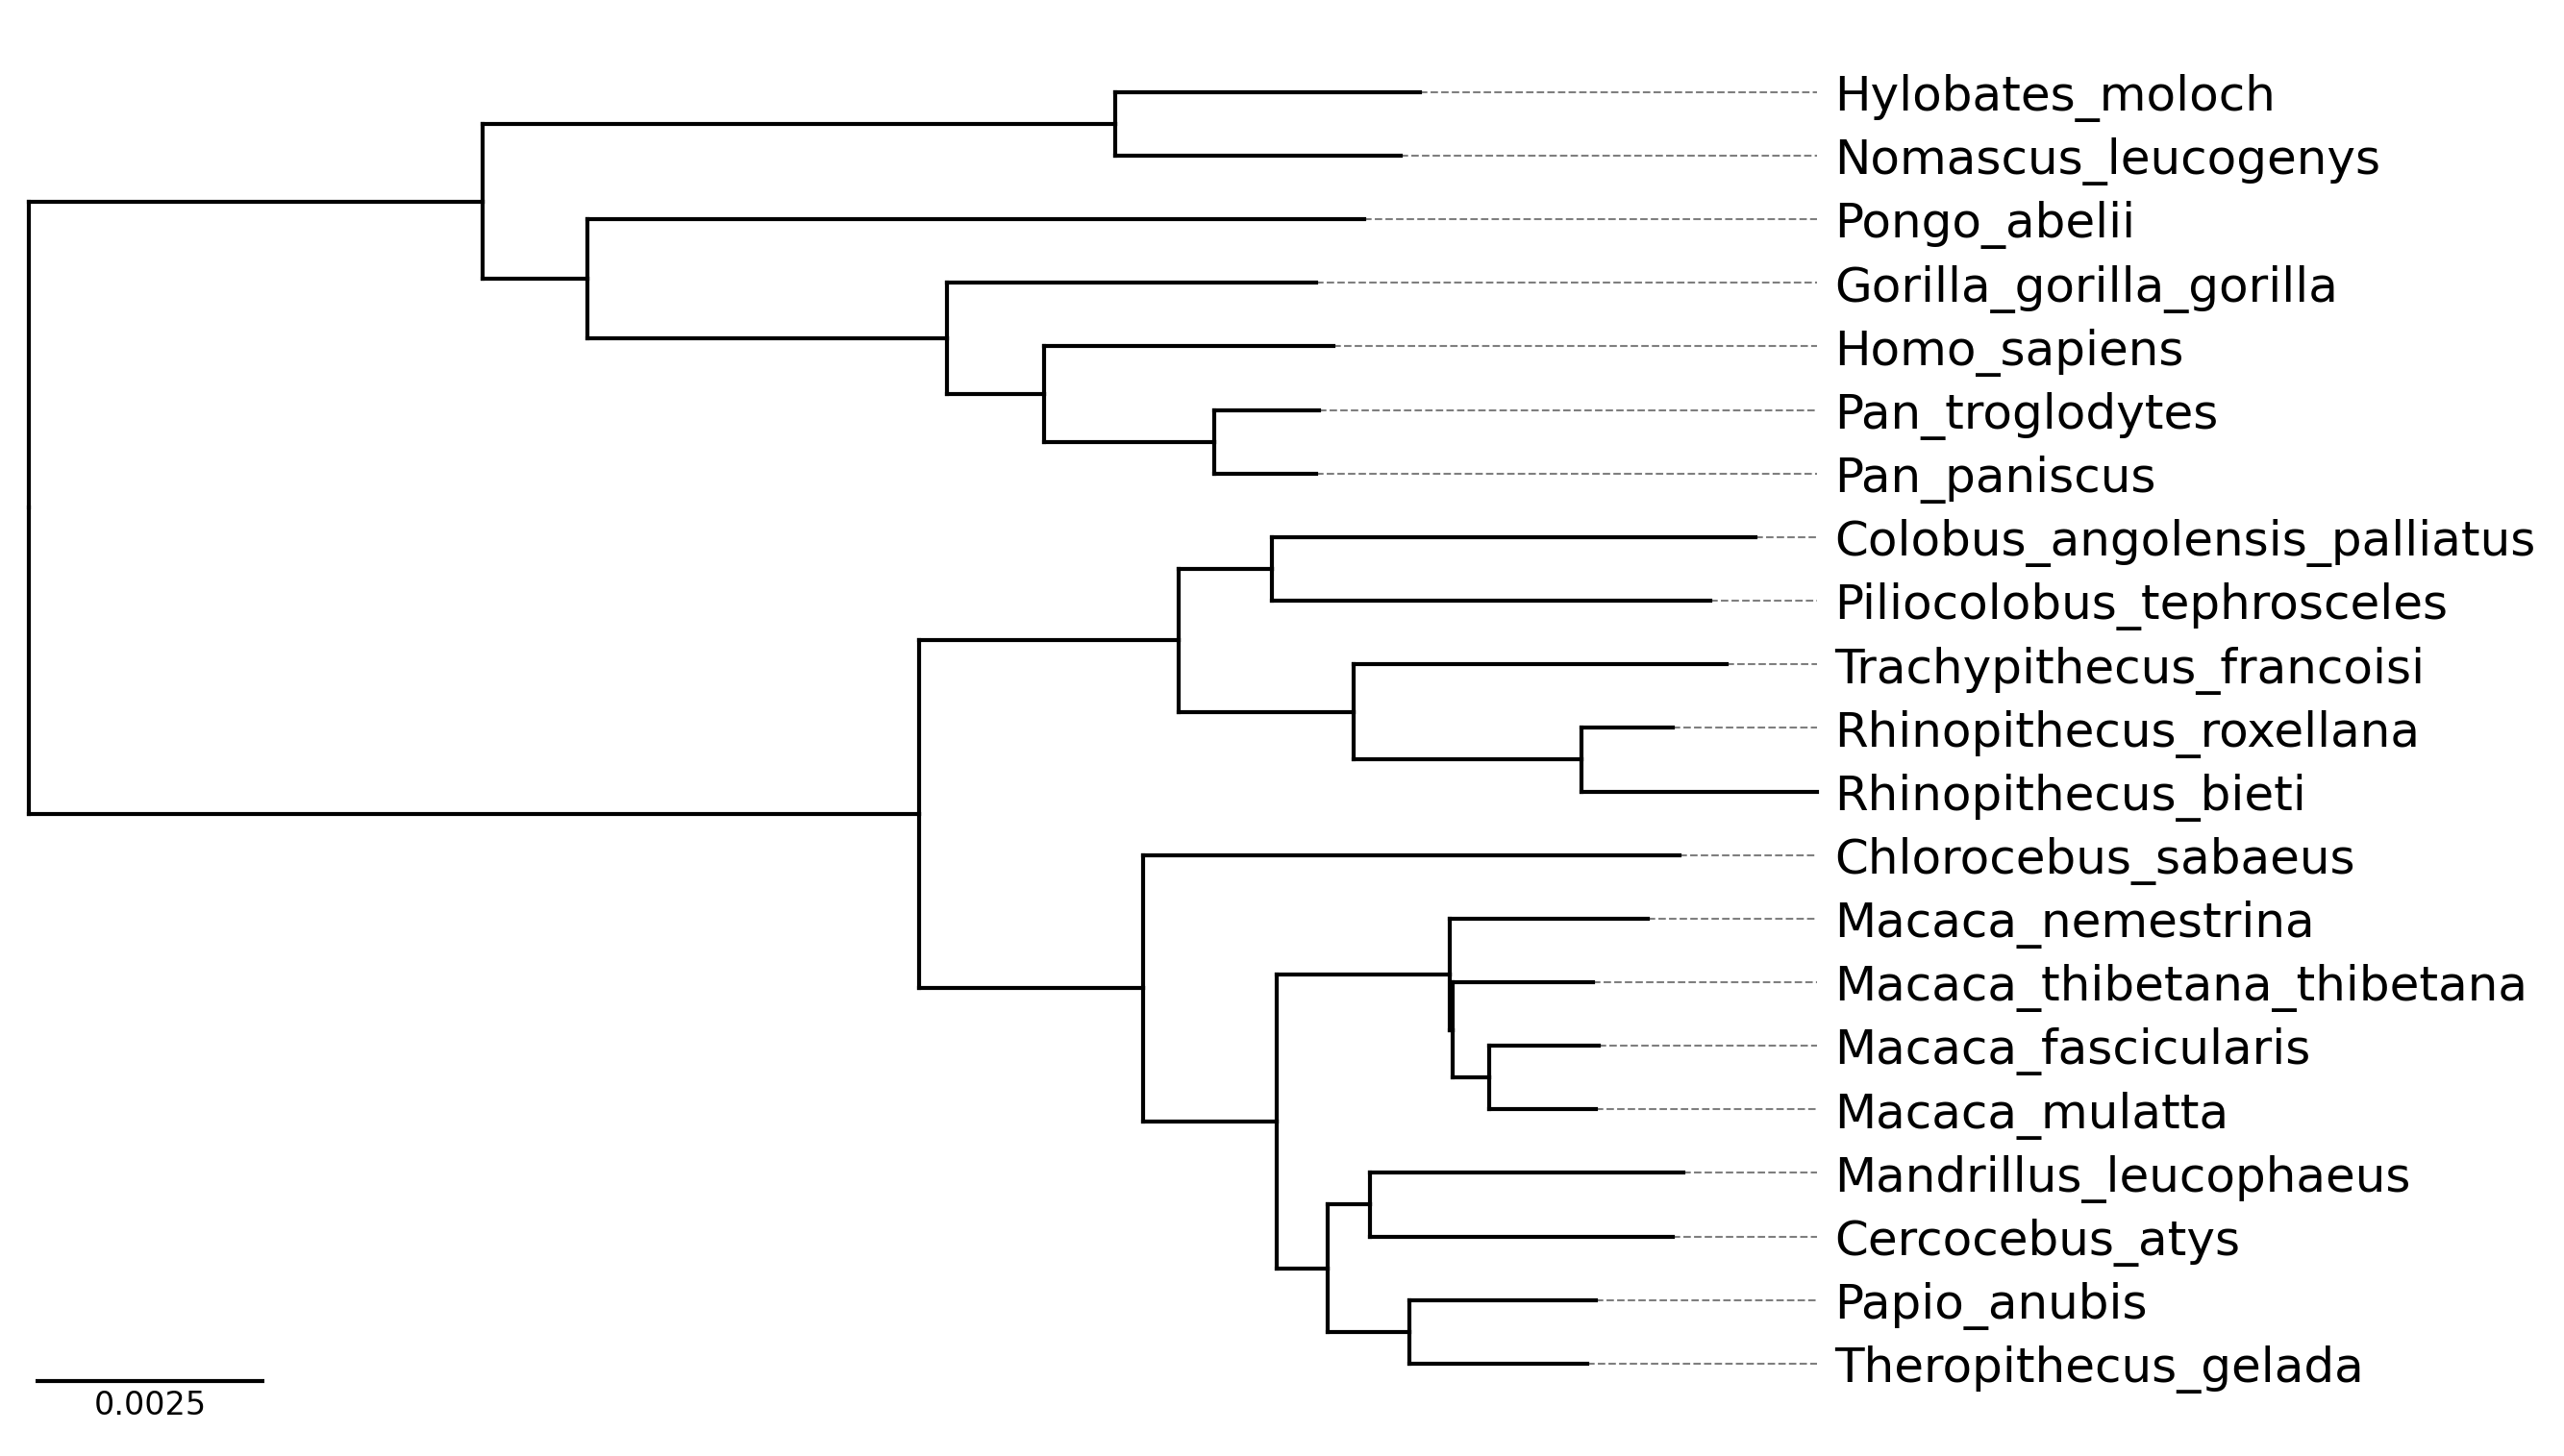
#### CLI Example 3
phytreeviz -i ./example/medium_example.nwk -o cli_example03.png \
--fig_height 0.3 --align_leaf_label
Raw data
{
"_id": null,
"home_page": "https://github.com/moshi4/phyTreeViz/",
"name": "phytreeviz",
"maintainer": "",
"docs_url": null,
"requires_python": ">=3.8,<4.0",
"maintainer_email": "",
"keywords": "bioinformatics,phylogenetics,visualization,matplotlib,phylogenetic-tree",
"author": "moshi4",
"author_email": "",
"download_url": "https://files.pythonhosted.org/packages/ad/3f/64827798666413a89e79d1471e8626a1c963e8fe231f4e979a17e729452a/phytreeviz-0.2.0.tar.gz",
"platform": null,
"description": "# phyTreeViz\n\n\n\n\n[](https://pypi.python.org/pypi/phytreeviz)\n[](https://github.com/moshi4/phyTreeViz/actions/workflows/ci.yml)\n\n## Table of contents\n\n- [Overview](#overview)\n- [Installation](#installation)\n- [API Usage](#api-usage)\n- [CLI Usage](#cli-usage)\n\n## Overview\n\nphyTreeViz is a simple and minimal phylogenetic tree visualization python package implemented based on matplotlib.\nThis package was developed to enhance phylogenetic tree visualization functionality of BioPython.\n\nphyTreeViz is intended to provide a simple and easy-to-use phylogenetic tree visualization function without complexity.\nTherefore, if you need complex tree annotations, I recommend using [ete](https://github.com/etetoolkit/ete) or [ggtree](https://github.com/YuLab-SMU/ggtree).\n\n## Installation\n\n`Python 3.8 or later` is required for installation.\n\n**Install PyPI package:**\n\n pip install phytreeviz\n\n## API Usage\n\nOnly simple example usage is described in this section.\nFor more details, please see [Getting Started](https://moshi4.github.io/phyTreeViz/getting_started/) and [API Docs](https://moshi4.github.io/phyTreeViz/api-docs/treeviz/).\n\n### API Example\n\n#### API Example 1\n\n```python\nfrom phytreeviz import TreeViz, load_example_tree_file\n\ntree_file = load_example_tree_file(\"small_example.nwk\")\n\ntv = TreeViz(tree_file)\ntv.show_branch_length(color=\"red\")\ntv.show_confidence(color=\"blue\")\ntv.show_scale_bar()\n\ntv.savefig(\"api_example01.png\", dpi=300)\n```\n\n \n\n#### API Example 2\n\n```python\nfrom phytreeviz import TreeViz, load_example_tree_file\n\ntree_file = load_example_tree_file(\"small_example.nwk\")\n\ntv = TreeViz(tree_file, height=0.7)\ntv.show_scale_axis()\n\ntv.set_node_label_props(\"Homo_sapiens\", color=\"grey\")\ntv.set_node_label_props(\"Pongo_abelii\", color=\"green\", style=\"italic\")\n\ntv.set_node_line_props([\"Hylobates_moloch\", \"Nomascus_leucogenys\"], color=\"orange\", lw=2)\ntv.set_node_line_props([\"Homo_sapiens\", \"Pan_troglodytes\", \"Pan_paniscus\"], color=\"magenta\", ls=\"dotted\")\n\ntv.savefig(\"api_example02.png\", dpi=300)\n```\n\n \n\n#### API Example 3\n\n```python\nfrom phytreeviz import TreeViz, load_example_tree_file\n\ntree_file = load_example_tree_file(\"small_example.nwk\")\n\ntv = TreeViz(tree_file, align_leaf_label=True)\ntv.show_scale_axis()\n\ngroup1 = [\"Hylobates_moloch\", \"Nomascus_leucogenys\"]\ngroup2 = [\"Homo_sapiens\", \"Pan_paniscus\"]\n\ntv.highlight(group1, \"orange\")\ntv.highlight(group2, \"lime\")\n\ntv.annotate(group1, \"group1\")\ntv.annotate(group2, \"group2\")\n\ntv.marker(group1, marker=\"s\", color=\"blue\")\ntv.marker(group2, marker=\"D\", color=\"purple\", descendent=True)\ntv.marker(\"Pongo_abelii\", color=\"red\")\n\ntv.savefig(\"api_example03.png\", dpi=300)\n```\n\n \n\n#### API Example 4\n\n```python\nfrom phytreeviz import TreeViz, load_example_tree_file\nfrom matplotlib.patches import Patch\n\ntree_file = load_example_tree_file(\"medium_example.nwk\")\n\ntv = TreeViz(tree_file, height=0.3, align_leaf_label=True, leaf_label_size=10)\ntv.show_scale_bar()\n\ngroup1 = [\"Hylobates_moloch\", \"Nomascus_leucogenys\"]\ngroup2 = [\"Homo_sapiens\", \"Pongo_abelii\"]\ngroup3 = [\"Piliocolobus_tephrosceles\", \"Rhinopithecus_bieti\"]\ngroup4 = [\"Chlorocebus_sabaeus\", \"Papio_anubis\"]\n\ntv.highlight(group1, \"orange\", area=\"full\")\ntv.highlight(group2, \"skyblue\", area=\"full\")\ntv.highlight(group3, \"lime\", area=\"full\")\ntv.highlight(group4, \"pink\", area=\"full\")\n\ntv.link(group3, group4, connectionstyle=\"arc3,rad=0.2\")\n\nfig = tv.plotfig()\n\n_ = fig.legend(\n handles=[\n Patch(label=\"group1\", color=\"orange\"),\n Patch(label=\"group2\", color=\"skyblue\"),\n Patch(label=\"group3\", color=\"lime\"),\n Patch(label=\"group4\", color=\"pink\"),\n ],\n frameon=False,\n bbox_to_anchor=(0.3, 0.3),\n loc=\"center\",\n ncols=2,\n)\n\nfig.savefig(\"api_example04.png\", dpi=300)\n```\n\n \n\n## CLI Usage\n\nphyTreeViz provides simple phylogenetic tree visualization CLI.\n\n### Basic Command\n\n phytreeviz -i [Tree file or text] -o [Tree visualization file]\n\n### Options\n\n General Options:\n -i IN, --intree IN Input phylogenetic tree file or text\n -o OUT, --outfile OUT Output phylogenetic tree plot file [*.png|*.jpg|*.svg|*.pdf]\n --format Input phylogenetic tree format (Default: 'newick')\n -v, --version Print version information\n -h, --help Show this help message and exit\n\n Figure Appearence Options:\n --fig_height Figure height per leaf node of tree (Default: 0.5)\n --fig_width Figure width (Default: 8.0)\n --leaf_label_size Leaf label size (Default: 12)\n --ignore_branch_length Ignore branch length for plotting tree (Default: OFF)\n --align_leaf_label Align leaf label position (Default: OFF)\n --show_branch_length Show branch length (Default: OFF)\n --show_confidence Show confidence (Default: OFF)\n --dpi Figure DPI (Default: 300)\n\n Available Tree Format: ['newick', 'phyloxml', 'nexus', 'nexml', 'cdao']\n\n### CLI Example\n\nClick [here](https://github.com/moshi4/phyTreeViz/raw/main/example/example.zip) to download example tree files. \n\n#### CLI Example 1\n\n phytreeviz -i \"((A,B),((C,D),(E,(F,G))));\" -o cli_example01.png\n\n \n\n#### CLI Example 2\n\n phytreeviz -i ./example/small_example.nwk -o cli_example02.png \\\n --show_branch_length --show_confidence\n\n \n\n#### CLI Example 3\n\n phytreeviz -i ./example/medium_example.nwk -o cli_example03.png \\\n --fig_height 0.3 --align_leaf_label \n\n \n",
"bugtrack_url": null,
"license": "MIT",
"summary": "Simple phylogenetic tree visualization python package",
"version": "0.2.0",
"project_urls": {
"Homepage": "https://github.com/moshi4/phyTreeViz/",
"Repository": "https://github.com/moshi4/phyTreeViz/"
},
"split_keywords": [
"bioinformatics",
"phylogenetics",
"visualization",
"matplotlib",
"phylogenetic-tree"
],
"urls": [
{
"comment_text": "",
"digests": {
"blake2b_256": "04ebed9c3a11d61b1aab6f1eaf79d789e2bcb757062a15a0d4fbdadf149b68c4",
"md5": "e7b23becedb4ecd6e16b7dbd4db55b61",
"sha256": "227082ef0bcb60c8695f52e47b4e40980a3dc055a1dcbf1bd6a2265c3bb6da1e"
},
"downloads": -1,
"filename": "phytreeviz-0.2.0-py3-none-any.whl",
"has_sig": false,
"md5_digest": "e7b23becedb4ecd6e16b7dbd4db55b61",
"packagetype": "bdist_wheel",
"python_version": "py3",
"requires_python": ">=3.8,<4.0",
"size": 20873,
"upload_time": "2024-01-29T10:22:38",
"upload_time_iso_8601": "2024-01-29T10:22:38.073572Z",
"url": "https://files.pythonhosted.org/packages/04/eb/ed9c3a11d61b1aab6f1eaf79d789e2bcb757062a15a0d4fbdadf149b68c4/phytreeviz-0.2.0-py3-none-any.whl",
"yanked": false,
"yanked_reason": null
},
{
"comment_text": "",
"digests": {
"blake2b_256": "ad3f64827798666413a89e79d1471e8626a1c963e8fe231f4e979a17e729452a",
"md5": "b9d1d9d8a9ca40392c2192d4f9f11423",
"sha256": "4bc23eeb0c2f5708dfcad35e7bf2c78e5e71af51fc44e8dd167af213f72781a0"
},
"downloads": -1,
"filename": "phytreeviz-0.2.0.tar.gz",
"has_sig": false,
"md5_digest": "b9d1d9d8a9ca40392c2192d4f9f11423",
"packagetype": "sdist",
"python_version": "source",
"requires_python": ">=3.8,<4.0",
"size": 21211,
"upload_time": "2024-01-29T10:22:39",
"upload_time_iso_8601": "2024-01-29T10:22:39.697457Z",
"url": "https://files.pythonhosted.org/packages/ad/3f/64827798666413a89e79d1471e8626a1c963e8fe231f4e979a17e729452a/phytreeviz-0.2.0.tar.gz",
"yanked": false,
"yanked_reason": null
}
],
"upload_time": "2024-01-29 10:22:39",
"github": true,
"gitlab": false,
"bitbucket": false,
"codeberg": false,
"github_user": "moshi4",
"github_project": "phyTreeViz",
"travis_ci": false,
"coveralls": false,
"github_actions": true,
"lcname": "phytreeviz"
}

