| Name | altair-upset JSON |
| Version |
0.3.0
 JSON
JSON |
| download |
| home_page | None |
| Summary | Create interactive UpSet plots using Altair |
| upload_time | 2025-01-19 14:38:56 |
| maintainer | None |
| docs_url | None |
| author | None |
| requires_python | >=3.8.1 |
| license | MIT |
| keywords |
altair
sets
upset
vega
visualization
|
| VCS |
 |
| bugtrack_url |
|
| requirements |
No requirements were recorded.
|
| Travis-CI |
No Travis.
|
| coveralls test coverage |
No coveralls.
|
# Altair UpSet
[](https://badge.fury.io/py/altair-upset)
[](https://pypi.org/project/altair-upset/)
[](https://altair-upset.readthedocs.io/en/latest/?badge=latest)
[](https://opensource.org/licenses/MIT)
Create beautiful and interactive UpSet plots using Altair. UpSet plots are a powerful alternative to Venn diagrams for visualizing set intersections, especially when dealing with many sets.
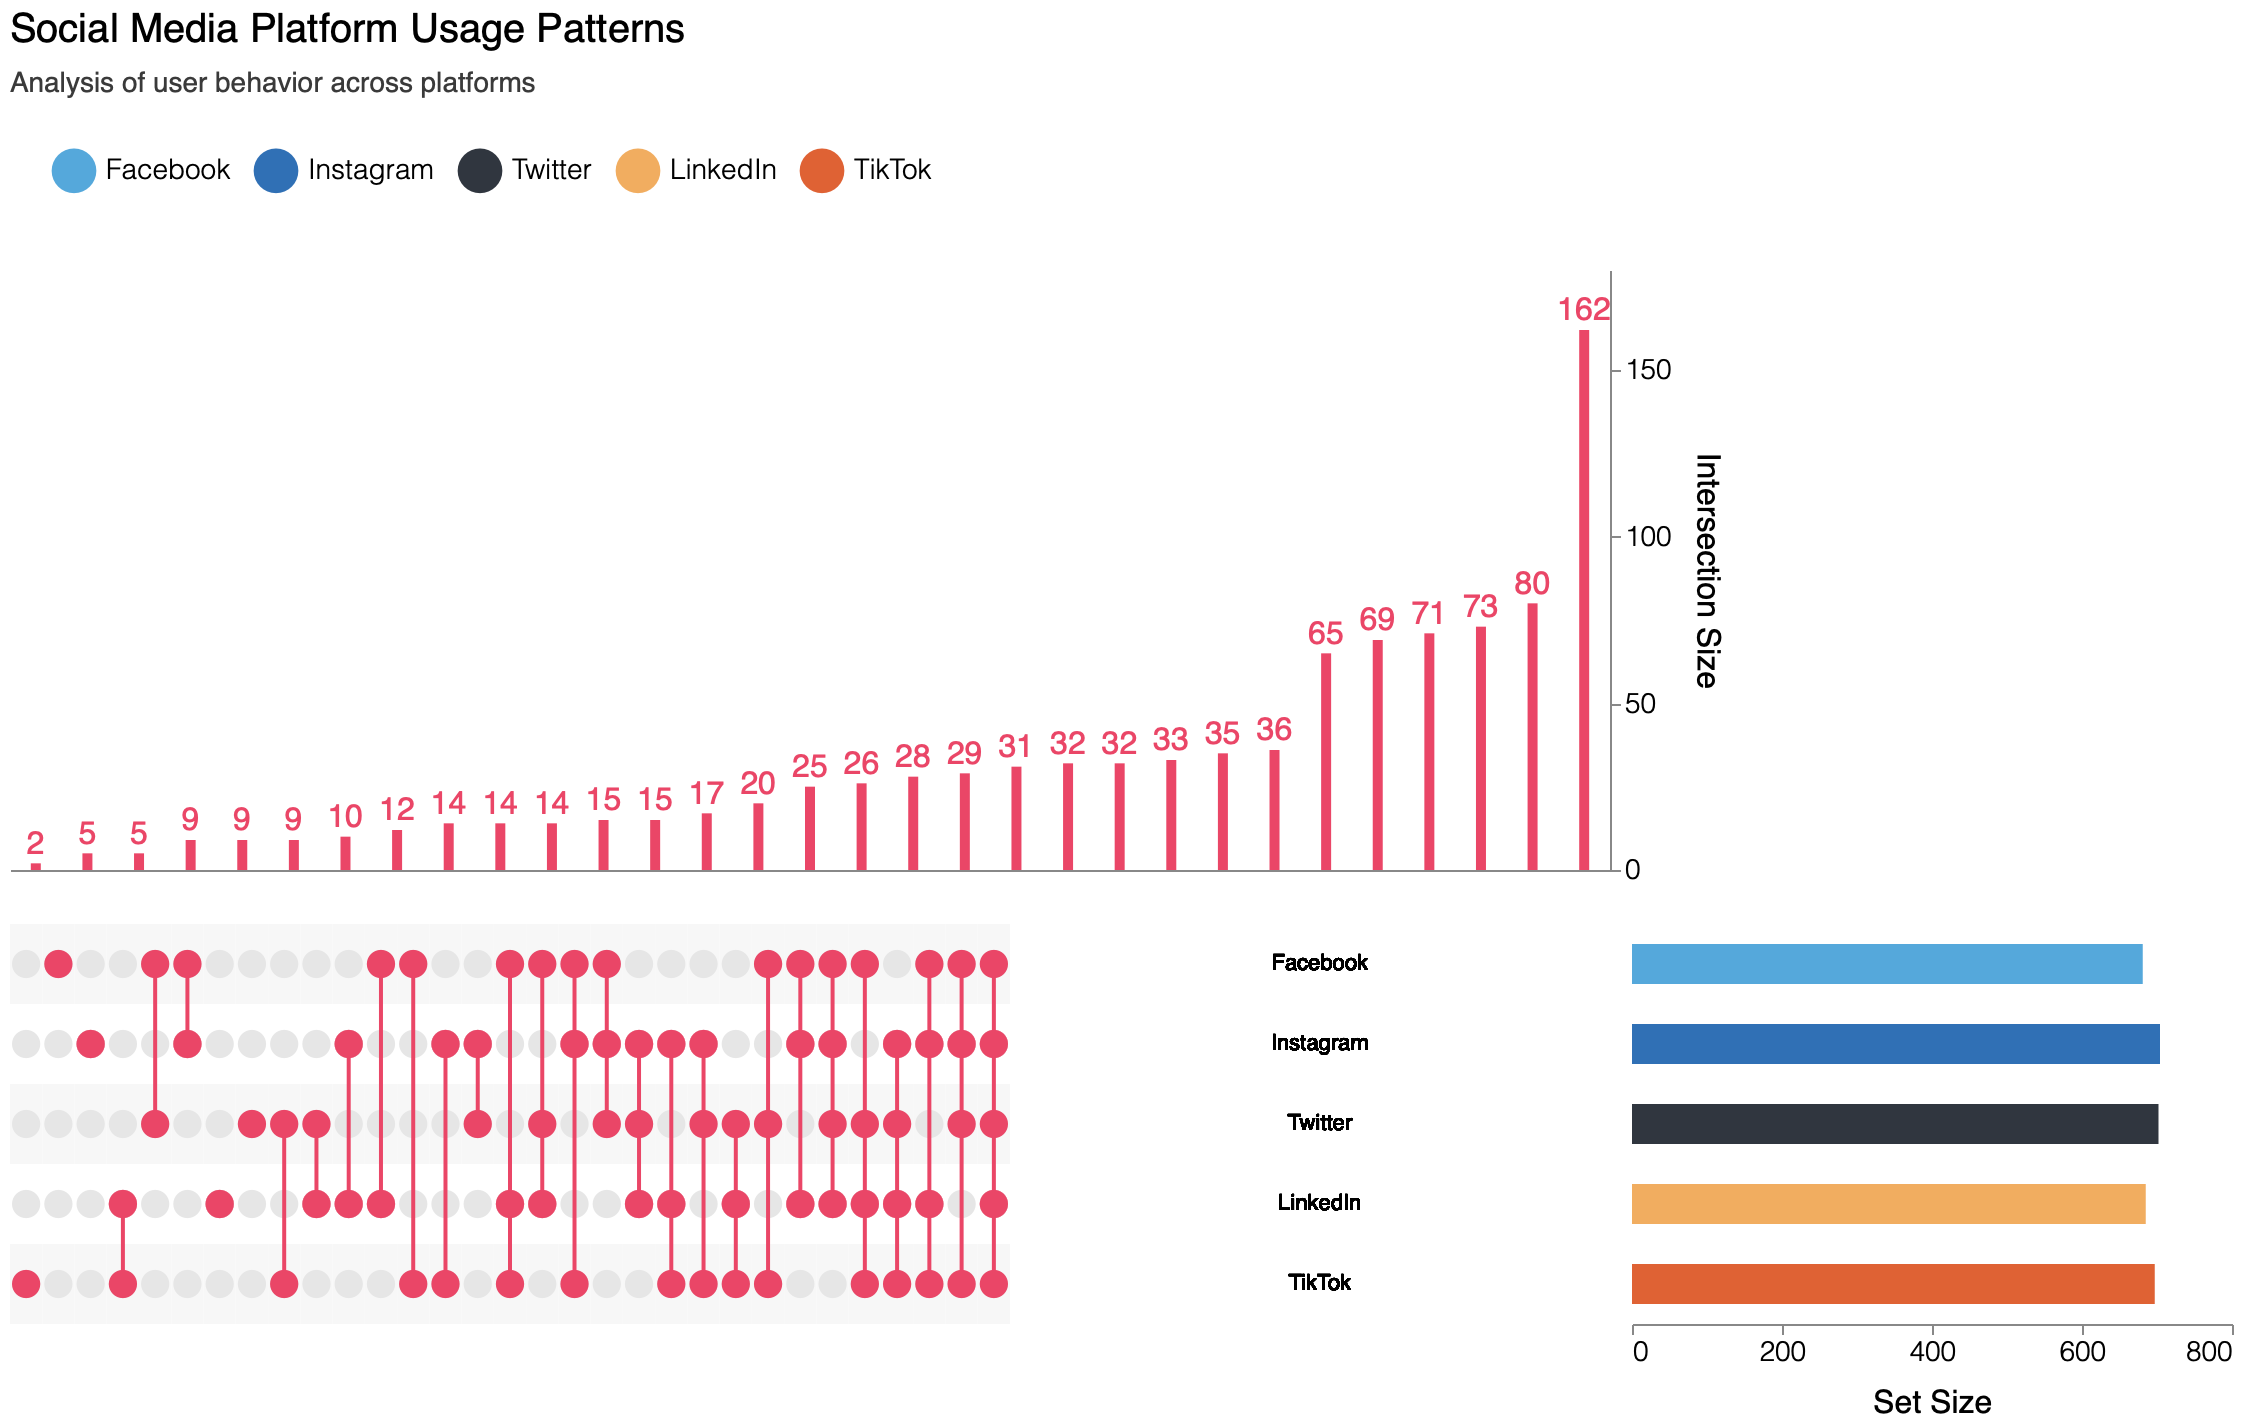
## Features
- 🎨 Beautiful, interactive visualizations powered by Altair/Vega-Lite
- 🔄 Dynamic sorting by frequency or degree
- 🎯 Interactive highlighting and filtering
- 📱 Responsive design that works in Jupyter notebooks and web browsers
- 🎨 Customizable colors, sizes, and themes
- 🔍 Tooltips with detailed intersection information
## Installation
```bash
pip install altair-upset
```
Or with conda:
```bash
conda install -c conda-forge altair-upset
```
## Quick Start
```python
import altair_upset as au
import pandas as pd
# Create sample data
data = pd.DataFrame({
'set1': [1, 0, 1, 1],
'set2': [1, 1, 0, 1],
'set3': [0, 1, 1, 0]
})
# Create UpSet plot
chart = au.UpSetAltair(
data=data,
sets=["set1", "set2", "set3"],
title="Sample UpSet Plot"
)
# Display the chart
chart.show()
```
## Advanced Usage
### Sorting and Filtering
```python
# Sort by degree (number of sets in intersection)
chart = au.UpSetAltair(
data=data,
sets=["set1", "set2", "set3"],
sort_by="degree",
sort_order="descending"
)
```
### Customizing Appearance
```python
# Custom colors and sizes
chart = au.UpSetAltair(
data=data,
sets=["set1", "set2", "set3"],
color_range=["#1f77b4", "#ff7f0e", "#2ca02c"],
highlight_color="#d62728",
width=800,
height=500
)
```
### Using Abbreviations
```python
# Use abbreviations for long set names
chart = au.UpSetAltair(
data=data,
sets=["Very Long Set Name 1", "Very Long Set Name 2", "Very Long Set Name 3"],
abbre=["S1", "S2", "S3"]
)
```
## Development
1. Clone the repository:
```bash
git clone https://github.com/edmundmiller/altair-upset.git
cd altair-upset
```
2. Create a virtual environment and install dependencies:
```bash
python -m venv venv
source venv/bin/activate # On Windows: venv\Scripts\activate
pip install -e ".[dev,test,docs]"
```
3. Install pre-commit hooks:
```bash
pre-commit install
```
4. Run tests:
```bash
pytest
```
## Contributing
Contributions are welcome! Please feel free to submit a Pull Request. For major changes, please open an issue first to discuss what you would like to change.
1. Fork the repository
2. Create your feature branch (`git checkout -b feature/amazing-feature`)
3. Commit your changes (`git commit -m 'Add some amazing feature'`)
4. Push to the branch (`git push origin feature/amazing-feature`)
5. Open a Pull Request
## Credits
This package is based on the [UpSet: Visualization of Intersecting Sets](http://upset.app/) technique. If you use an UpSet figure in a publication, please cite the original paper:
Alexander Lex, Nils Gehlenborg, Hendrik Strobelt, Romain Vuillemot, Hanspeter Pfister,
*UpSet: Visualization of Intersecting Sets*,
IEEE Transactions on Visualization and Computer Graphics (InfoVis '14), vol. 20, no. 12, pp. 1983–1992, 2014.
doi: [10.1109/TVCG.2014.2346248](https://doi.org/10.1109/TVCG.2014.2346248)
Raw data
{
"_id": null,
"home_page": null,
"name": "altair-upset",
"maintainer": null,
"docs_url": null,
"requires_python": ">=3.8.1",
"maintainer_email": null,
"keywords": "altair, sets, upset, vega, visualization",
"author": null,
"author_email": "Edmund Miller <git@edmundmiller.dev>",
"download_url": "https://files.pythonhosted.org/packages/ba/fd/281d369210e4b88433009068fb59991453bc4f7b4956459397b9eb6700d6/altair_upset-0.3.0.tar.gz",
"platform": null,
"description": "# Altair UpSet\n\n[](https://badge.fury.io/py/altair-upset)\n[](https://pypi.org/project/altair-upset/)\n[](https://altair-upset.readthedocs.io/en/latest/?badge=latest)\n[](https://opensource.org/licenses/MIT)\n\nCreate beautiful and interactive UpSet plots using Altair. UpSet plots are a powerful alternative to Venn diagrams for visualizing set intersections, especially when dealing with many sets.\n\n\n\n## Features\n\n- \ud83c\udfa8 Beautiful, interactive visualizations powered by Altair/Vega-Lite\n- \ud83d\udd04 Dynamic sorting by frequency or degree\n- \ud83c\udfaf Interactive highlighting and filtering\n- \ud83d\udcf1 Responsive design that works in Jupyter notebooks and web browsers\n- \ud83c\udfa8 Customizable colors, sizes, and themes\n- \ud83d\udd0d Tooltips with detailed intersection information\n\n## Installation\n\n```bash\npip install altair-upset\n```\n\nOr with conda:\n\n```bash\nconda install -c conda-forge altair-upset\n```\n\n## Quick Start\n\n```python\nimport altair_upset as au\nimport pandas as pd\n\n# Create sample data\ndata = pd.DataFrame({\n 'set1': [1, 0, 1, 1],\n 'set2': [1, 1, 0, 1],\n 'set3': [0, 1, 1, 0]\n})\n\n# Create UpSet plot\nchart = au.UpSetAltair(\n data=data,\n sets=[\"set1\", \"set2\", \"set3\"],\n title=\"Sample UpSet Plot\"\n)\n\n# Display the chart\nchart.show()\n```\n\n## Advanced Usage\n\n### Sorting and Filtering\n\n```python\n# Sort by degree (number of sets in intersection)\nchart = au.UpSetAltair(\n data=data,\n sets=[\"set1\", \"set2\", \"set3\"],\n sort_by=\"degree\",\n sort_order=\"descending\"\n)\n```\n\n### Customizing Appearance\n\n```python\n# Custom colors and sizes\nchart = au.UpSetAltair(\n data=data,\n sets=[\"set1\", \"set2\", \"set3\"],\n color_range=[\"#1f77b4\", \"#ff7f0e\", \"#2ca02c\"],\n highlight_color=\"#d62728\",\n width=800,\n height=500\n)\n```\n\n### Using Abbreviations\n\n```python\n# Use abbreviations for long set names\nchart = au.UpSetAltair(\n data=data,\n sets=[\"Very Long Set Name 1\", \"Very Long Set Name 2\", \"Very Long Set Name 3\"],\n abbre=[\"S1\", \"S2\", \"S3\"]\n)\n```\n\n## Development\n\n1. Clone the repository:\n```bash\ngit clone https://github.com/edmundmiller/altair-upset.git\ncd altair-upset\n```\n\n2. Create a virtual environment and install dependencies:\n```bash\npython -m venv venv\nsource venv/bin/activate # On Windows: venv\\Scripts\\activate\npip install -e \".[dev,test,docs]\"\n```\n\n3. Install pre-commit hooks:\n```bash\npre-commit install\n```\n\n4. Run tests:\n```bash\npytest\n```\n\n## Contributing\n\nContributions are welcome! Please feel free to submit a Pull Request. For major changes, please open an issue first to discuss what you would like to change.\n\n1. Fork the repository\n2. Create your feature branch (`git checkout -b feature/amazing-feature`)\n3. Commit your changes (`git commit -m 'Add some amazing feature'`)\n4. Push to the branch (`git push origin feature/amazing-feature`)\n5. Open a Pull Request\n\n## Credits\n\nThis package is based on the [UpSet: Visualization of Intersecting Sets](http://upset.app/) technique. If you use an UpSet figure in a publication, please cite the original paper:\n\nAlexander Lex, Nils Gehlenborg, Hendrik Strobelt, Romain Vuillemot, Hanspeter Pfister,\n*UpSet: Visualization of Intersecting Sets*,\nIEEE Transactions on Visualization and Computer Graphics (InfoVis '14), vol. 20, no. 12, pp. 1983\u20131992, 2014.\ndoi: [10.1109/TVCG.2014.2346248](https://doi.org/10.1109/TVCG.2014.2346248)",
"bugtrack_url": null,
"license": "MIT",
"summary": "Create interactive UpSet plots using Altair",
"version": "0.3.0",
"project_urls": {
"Documentation": "https://altair-upset.readthedocs.io",
"Homepage": "https://github.com/edmundmiller/altair-upset",
"Issues": "https://github.com/edmundmiller/altair-upset/issues",
"Repository": "https://github.com/edmundmiller/altair-upset.git"
},
"split_keywords": [
"altair",
" sets",
" upset",
" vega",
" visualization"
],
"urls": [
{
"comment_text": null,
"digests": {
"blake2b_256": "93979818f76010403f7382988509ec24d85e5ebdc039f71b37547ff5deb2302e",
"md5": "7bc5f340906934baac300a493efaf654",
"sha256": "105ac71ff19434bc252fb2a0ea48f9b016266abf01f8de8cbb7fa14458cc5b93"
},
"downloads": -1,
"filename": "altair_upset-0.3.0-py3-none-any.whl",
"has_sig": false,
"md5_digest": "7bc5f340906934baac300a493efaf654",
"packagetype": "bdist_wheel",
"python_version": "py3",
"requires_python": ">=3.8.1",
"size": 9905,
"upload_time": "2025-01-19T14:38:53",
"upload_time_iso_8601": "2025-01-19T14:38:53.677178Z",
"url": "https://files.pythonhosted.org/packages/93/97/9818f76010403f7382988509ec24d85e5ebdc039f71b37547ff5deb2302e/altair_upset-0.3.0-py3-none-any.whl",
"yanked": false,
"yanked_reason": null
},
{
"comment_text": null,
"digests": {
"blake2b_256": "bafd281d369210e4b88433009068fb59991453bc4f7b4956459397b9eb6700d6",
"md5": "22041cedeb9c601431a91267736d9bc4",
"sha256": "1e785c14772bc38e6b5a1c8a423461999b3d62168127feff0a0e84b7702e62a3"
},
"downloads": -1,
"filename": "altair_upset-0.3.0.tar.gz",
"has_sig": false,
"md5_digest": "22041cedeb9c601431a91267736d9bc4",
"packagetype": "sdist",
"python_version": "source",
"requires_python": ">=3.8.1",
"size": 848929,
"upload_time": "2025-01-19T14:38:56",
"upload_time_iso_8601": "2025-01-19T14:38:56.054289Z",
"url": "https://files.pythonhosted.org/packages/ba/fd/281d369210e4b88433009068fb59991453bc4f7b4956459397b9eb6700d6/altair_upset-0.3.0.tar.gz",
"yanked": false,
"yanked_reason": null
}
],
"upload_time": "2025-01-19 14:38:56",
"github": true,
"gitlab": false,
"bitbucket": false,
"codeberg": false,
"github_user": "edmundmiller",
"github_project": "altair-upset",
"github_not_found": true,
"lcname": "altair-upset"
}
