# ChartFactor for Python
[ChartFactor Py](https://chartfactor.com/doc/latest/cfpy_overview/) is built on top of [ChartFactor](https://chartfactor.com), the lightweight visual analytics platform. It includes [ChartFactor Studio](https://chartfactor.com/doc/latest/studio_intro/) and the [ChartFactor Toolkit](https://chartfactor.com/doc/latest/architecture/) between other components.
# Installing Chartfactor Py
Visit the [installation section](https://chartfactor.com/doc/latest/cfpy_installing/) in the ChartFactor Py documentation for a detailed guide.
# Usage
Create a new notebook and do the following
#### Cell 1
```python
from chartfactor import *
import pandas as pd
```
#### Cell 2
```python
titanic = pd.read_csv('https://chartfactor.com/resources/tutorials/titanic.csv')
```
#### Cell 3
```python
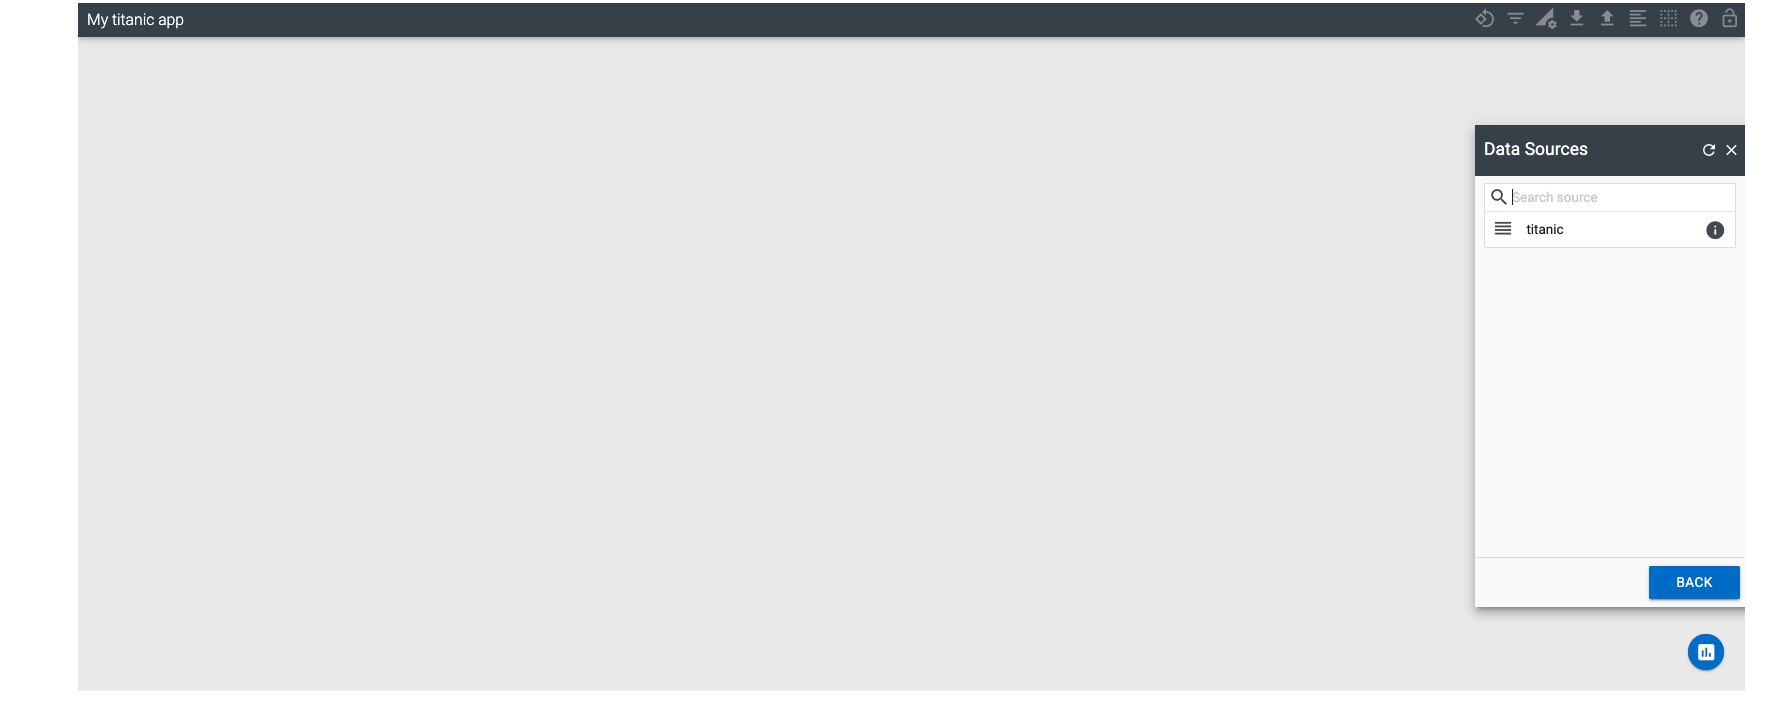
cf.studio("My titanic app")
```
#### The output will display an empty Studio app, select the dataframe in the Data Sources window
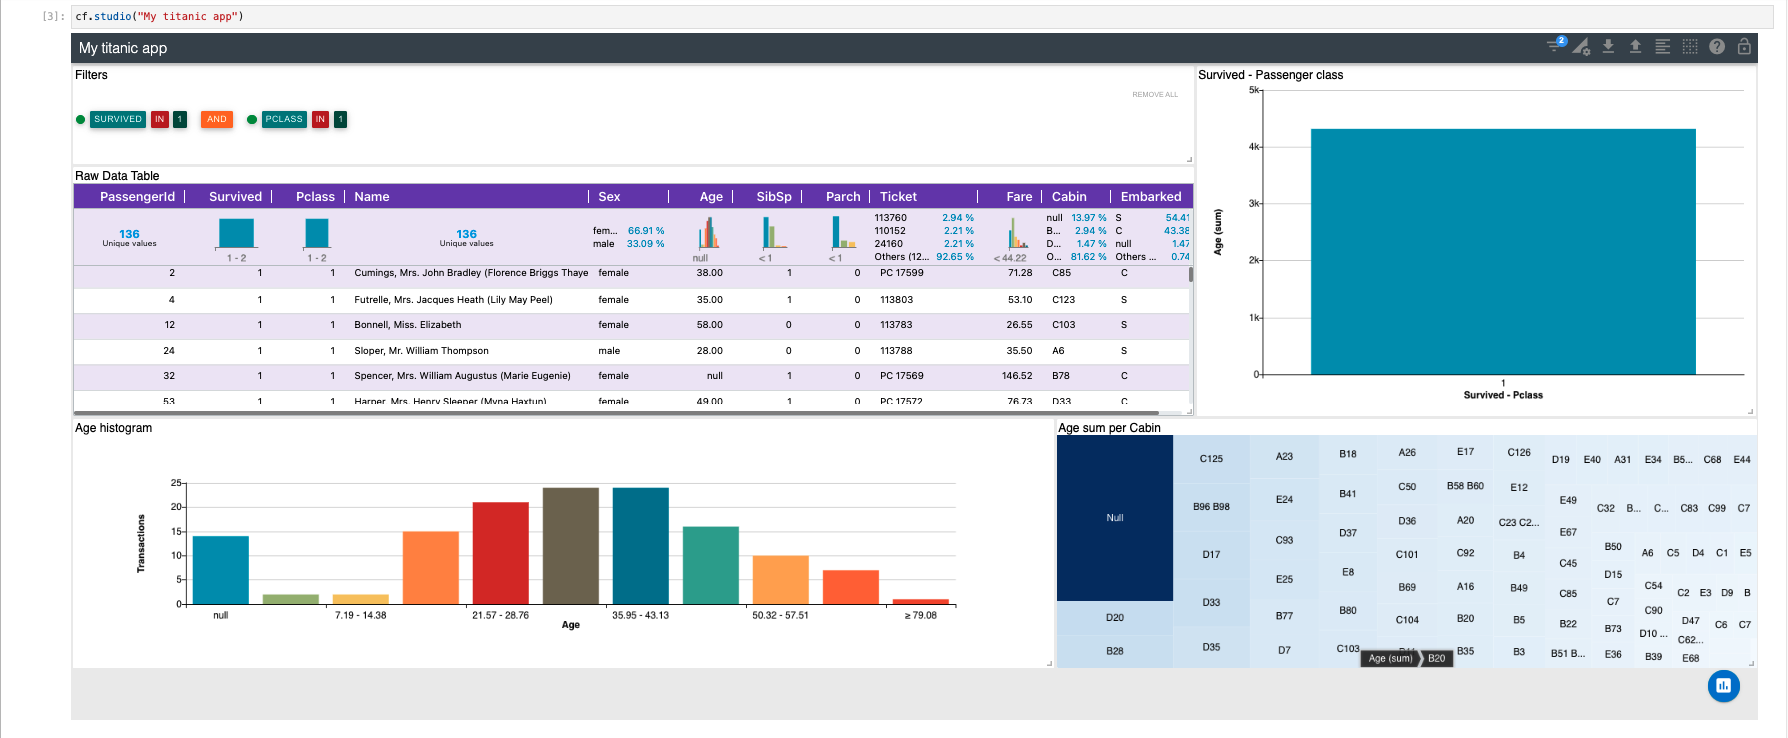
#### Then, add some widgets like Raw Data Table, Bars, Tree Map, etc...
Raw data
{
"_id": null,
"home_page": "https://github.com/Aktiun/chartfactor-py",
"name": "chartfactor",
"maintainer": null,
"docs_url": null,
"requires_python": ">=3.7",
"maintainer_email": null,
"keywords": "aktiun, jupyter, jupyterhub, jupyterlab, chartfactor-py",
"author": "Aktiun",
"author_email": "juan.dominguez@aktiun.com",
"download_url": "https://files.pythonhosted.org/packages/01/9c/f00dfee681581c0e8614a914fbc829fdd63736ec2e09ba059923a925543b/chartfactor-5.1.27.tar.gz",
"platform": null,
"description": "# ChartFactor for Python\n\n[ChartFactor Py](https://chartfactor.com/doc/latest/cfpy_overview/) is built on top of [ChartFactor](https://chartfactor.com), the lightweight visual analytics platform. It includes [ChartFactor Studio](https://chartfactor.com/doc/latest/studio_intro/) and the [ChartFactor Toolkit](https://chartfactor.com/doc/latest/architecture/) between other components.\n\n# Installing Chartfactor Py\n\nVisit the [installation section](https://chartfactor.com/doc/latest/cfpy_installing/) in the ChartFactor Py documentation for a detailed guide.\n\n# Usage\n\nCreate a new notebook and do the following\n\n#### Cell 1\n\n```python\nfrom chartfactor import *\nimport pandas as pd\n```\n\n#### Cell 2\n\n```python\ntitanic = pd.read_csv('https://chartfactor.com/resources/tutorials/titanic.csv')\n```\n\n#### Cell 3\n\n```python\ncf.studio(\"My titanic app\")\n```\n\n#### The output will display an empty Studio app, select the dataframe in the Data Sources window\n\n\n#### Then, add some widgets like Raw Data Table, Bars, Tree Map, etc...\n\n",
"bugtrack_url": null,
"license": null,
"summary": "Integrates ChartFactor with Jupyter Notebooks",
"version": "5.1.27",
"project_urls": {
"Homepage": "https://github.com/Aktiun/chartfactor-py"
},
"split_keywords": [
"aktiun",
" jupyter",
" jupyterhub",
" jupyterlab",
" chartfactor-py"
],
"urls": [
{
"comment_text": "",
"digests": {
"blake2b_256": "75e846391a0d21608673821204f059ec47c3a7c3af8181a749c6e5254f4f36d3",
"md5": "d881d70c6102d4b47bd200a5304fb819",
"sha256": "f66d70566fa6904e0ce8050d170a9b1de4f9f47aa3d553f2ee4c4041bb5e23d6"
},
"downloads": -1,
"filename": "chartfactor-5.1.27-py3-none-any.whl",
"has_sig": false,
"md5_digest": "d881d70c6102d4b47bd200a5304fb819",
"packagetype": "bdist_wheel",
"python_version": "py3",
"requires_python": ">=3.7",
"size": 5875118,
"upload_time": "2025-02-12T01:54:22",
"upload_time_iso_8601": "2025-02-12T01:54:22.432318Z",
"url": "https://files.pythonhosted.org/packages/75/e8/46391a0d21608673821204f059ec47c3a7c3af8181a749c6e5254f4f36d3/chartfactor-5.1.27-py3-none-any.whl",
"yanked": false,
"yanked_reason": null
},
{
"comment_text": "",
"digests": {
"blake2b_256": "019cf00dfee681581c0e8614a914fbc829fdd63736ec2e09ba059923a925543b",
"md5": "9e7128c73ede6b333901e1406b82d555",
"sha256": "24419c8c6a700794aa5d64628acf25ddefab9a329abb547d1e708ef3fb9d88fd"
},
"downloads": -1,
"filename": "chartfactor-5.1.27.tar.gz",
"has_sig": false,
"md5_digest": "9e7128c73ede6b333901e1406b82d555",
"packagetype": "sdist",
"python_version": "source",
"requires_python": ">=3.7",
"size": 209555,
"upload_time": "2025-02-12T01:54:24",
"upload_time_iso_8601": "2025-02-12T01:54:24.981475Z",
"url": "https://files.pythonhosted.org/packages/01/9c/f00dfee681581c0e8614a914fbc829fdd63736ec2e09ba059923a925543b/chartfactor-5.1.27.tar.gz",
"yanked": false,
"yanked_reason": null
}
],
"upload_time": "2025-02-12 01:54:24",
"github": true,
"gitlab": false,
"bitbucket": false,
"codeberg": false,
"github_user": "Aktiun",
"github_project": "chartfactor-py",
"github_not_found": true,
"lcname": "chartfactor"
}

