# Welcome to Circadipy!
=======================================
Introducing **CircadiPy**, a Python package for chronobiological analysis!
With seamless integration of powerful time series plotting libraries,
it enables researchers to visualise and study circadian cycles with unrivalled versatility.
Currently, the package supports the visualisation of biological rhythms and their synchronisation with external cues using
1. Actograms: An actogram is a graphical representation of an organism's activity or physiological data over time. It typically shows activity or physiological measurements (e.g. hormone levels, temperature) on the y-axis and time on the x-axis. Actograms are often used to visualise circadian rhythms and patterns of activity/rest cycles.
2. Cosinor Analysis Plot: This plot is used to analyse and display the presence of rhythmic patterns in the data. It's a graphical representation of cosinor analysis, which fits a cosine curve to the data to estimate rhythm parameters such as amplitude, acrophase (peak time) and period.
3. Raster plot: A raster plot shows individual events or occurrences (such as action potentials in neurons) over time. In chronobiology this can be used to show the timing of specific events in relation to the circadian cycle.
4. Histogram: A histogram can be used to show the distribution of events or measurements over a period of time. In chronobiology this could be the distribution of activity bouts or physiological measurements over different time bins.
------------------------------------------------------------------------------------------------------------------------------
# CircadiPy installation:
* This guide is in a simplified format, for a more detailed guide and much more please visit our documentation page: https://circadipy.readthedocs.io/en/latest/
## Before Installation
### Install Visual Studio Build Tools
CircadiPy requires the installation of the PyMICE library to read Intellicage data. Additionally, PyMICE requires the installation of Visual Studio Build Tools on Windows. You can download the Visual Studio Build Tools from the following link:
[Visual Studio Build Tools](https://visualstudio.microsoft.com/visual-cpp-build-tools/)
After downloading the Visual Studio Build Tools, you can install it by running the installer. Once the installation is completed, you can proceed to the following steps.
1. Select the "desktop development with C++" workload.
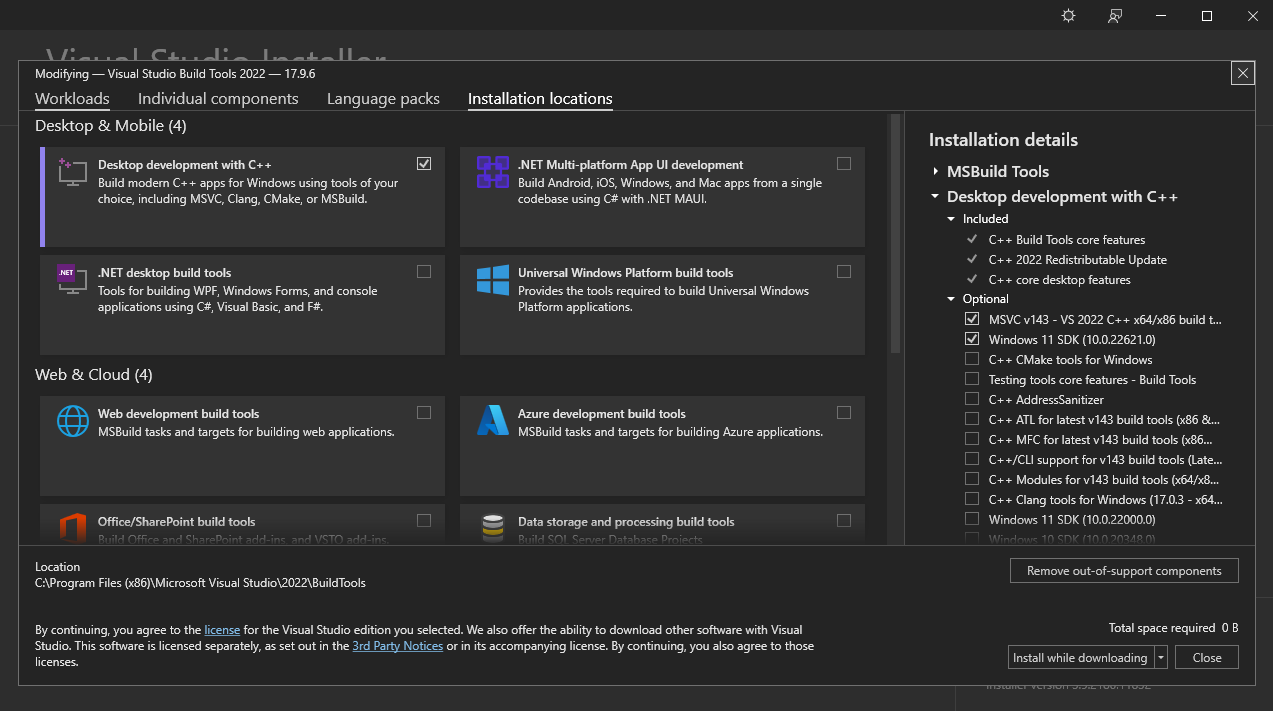
2. On the right side of the window, select only the "MSVC" (e.g. "MSVC v142 - VS 2019 C++ x64/x86 build tools") and "Windows X SDK" components.
3. Click on the "Install" button to start the installation.
------------------------------------------------------------------------------------------------------------------------------
# Package and Environment Management System
We recommend using either Miniconda or Mamba to install Python and create a new environment. In this tutorial, we will use Mamba, but the steps are the same for Miniconda.
To install Python using Mamba, you need the Mambaforge installer. You can download it from the [Mambaforge GitHub page](https://github.com/conda-forge/miniforge#mambaforge).
There, scroll to the Mambaforge section and download the installer for your operating system. This will install the Mambaforge package and environment management system with Mamba installed in the base environment, as shown in this image:
<p align="center">
<img src="https://raw.githubusercontent.com/nnc-ufmg/circadipy/main/docs/source/imgs/mambaforge_github_page.png" alt="Mambaforge GitHub Page" />
</p>
*Figure: The section where the user will download the Mambaforge installer. You can observe that there are options for different operating systems, including Linux, macOS, and Windows. The user should download the installer for their operating system. In this case, download the Windows installer, `Mambaforge-Windows-x86_64`.*
After the download is completed, run the installer and follow the instructions. Once the installation is completed, a new program called "Miniforge Prompt" will appear in your start menu. (Alternatively, you can type "miniforge" into your operating system's search bar to find the prompt.) Open it and use the Mambaforge terminal to create a new environment with the required dependencies.
------------------------------------------------------------------------------------------------------------------------------
# Environment Creation and Installation
1. Create a new environment by following these steps:
- Open the Mambaforge terminal (also known as 'Miniforge Prompt') and type:
```console
(base) $ mamba create -n circadipy_env python=3.8
```
> **Note**: Python version must be 3.8 because PyMICE, a dependency of CircadiPy for reading Intellicage data, is not compatible with Python versions higher than 3.8.
- Press 'y' when prompted.
- After the environment is created, activate it by typing:
```console
(base) $ mamba activate circadipy_env
```
2. Install the dependencies from the PyPI repository by typing:
```console
(circadipy_env) $ pip install circadipy
```
------------------------------------------------------------------------------------------------------------------------------
### CircadiPy also has a built-in simulated data generator that allows the creation of custom data sets for testing, experimentation and comparison purposes.
### Please visit our documentation page for more information: https://circadipy.readthedocs.io/en/latest/
There you will find:
1. A more in depth guide on how to use CircadiPy using the simulated data generator in the tutorial section
2. How to use the package to analyse your own data leveraging Jupiter notebooks.
3. A description of the API
Raw data
{
"_id": null,
"home_page": "https://github.com/mcjpedro/circadipy",
"name": "circadipy",
"maintainer": null,
"docs_url": null,
"requires_python": null,
"maintainer_email": null,
"keywords": "circadian, chronobiology, data",
"author": "Jo\u00e3o Pedro Carvalho Moreira",
"author_email": "mcjpedro@gmail.com",
"download_url": "https://files.pythonhosted.org/packages/46/06/eaa5d47bbd1f6b61f3da7a8dd855cebabb9e743025cdb59b9ee69c2a56cf/circadipy-0.1.11.tar.gz",
"platform": null,
"description": "# Welcome to Circadipy!\r\n=======================================\r\n\r\nIntroducing **CircadiPy**, a Python package for chronobiological analysis! \r\nWith seamless integration of powerful time series plotting libraries, \r\nit enables researchers to visualise and study circadian cycles with unrivalled versatility.\r\n\r\nCurrently, the package supports the visualisation of biological rhythms and their synchronisation with external cues using\r\n\r\n1. Actograms: An actogram is a graphical representation of an organism's activity or physiological data over time. It typically shows activity or physiological measurements (e.g. hormone levels, temperature) on the y-axis and time on the x-axis. Actograms are often used to visualise circadian rhythms and patterns of activity/rest cycles.\r\n\r\n2. Cosinor Analysis Plot: This plot is used to analyse and display the presence of rhythmic patterns in the data. It's a graphical representation of cosinor analysis, which fits a cosine curve to the data to estimate rhythm parameters such as amplitude, acrophase (peak time) and period.\r\n\r\n3. Raster plot: A raster plot shows individual events or occurrences (such as action potentials in neurons) over time. In chronobiology this can be used to show the timing of specific events in relation to the circadian cycle.\r\n\r\n4. Histogram: A histogram can be used to show the distribution of events or measurements over a period of time. In chronobiology this could be the distribution of activity bouts or physiological measurements over different time bins.\r\n\r\n------------------------------------------------------------------------------------------------------------------------------\r\n\r\n# CircadiPy installation:\r\n * This guide is in a simplified format, for a more detailed guide and much more please visit our documentation page: https://circadipy.readthedocs.io/en/latest/\r\n\r\n\r\n## Before Installation\r\n\r\n### Install Visual Studio Build Tools\r\n\r\nCircadiPy requires the installation of the PyMICE library to read Intellicage data. Additionally, PyMICE requires the installation of Visual Studio Build Tools on Windows. You can download the Visual Studio Build Tools from the following link:\r\n\r\n[Visual Studio Build Tools](https://visualstudio.microsoft.com/visual-cpp-build-tools/)\r\n\r\nAfter downloading the Visual Studio Build Tools, you can install it by running the installer. Once the installation is completed, you can proceed to the following steps.\r\n\r\n1. Select the \"desktop development with C++\" workload.\r\n\r\n \r\n\r\n2. On the right side of the window, select only the \"MSVC\" (e.g. \"MSVC v142 - VS 2019 C++ x64/x86 build tools\") and \"Windows X SDK\" components.\r\n\r\n3. Click on the \"Install\" button to start the installation.\r\n\r\n------------------------------------------------------------------------------------------------------------------------------\r\n\r\n# Package and Environment Management System\r\n\r\nWe recommend using either Miniconda or Mamba to install Python and create a new environment. In this tutorial, we will use Mamba, but the steps are the same for Miniconda.\r\n\r\nTo install Python using Mamba, you need the Mambaforge installer. You can download it from the [Mambaforge GitHub page](https://github.com/conda-forge/miniforge#mambaforge).\r\n\r\nThere, scroll to the Mambaforge section and download the installer for your operating system. This will install the Mambaforge package and environment management system with Mamba installed in the base environment, as shown in this image:\r\n\r\n<p align=\"center\">\r\n <img src=\"https://raw.githubusercontent.com/nnc-ufmg/circadipy/main/docs/source/imgs/mambaforge_github_page.png\" alt=\"Mambaforge GitHub Page\" />\r\n</p>\r\n\r\n*Figure: The section where the user will download the Mambaforge installer. You can observe that there are options for different operating systems, including Linux, macOS, and Windows. The user should download the installer for their operating system. In this case, download the Windows installer, `Mambaforge-Windows-x86_64`.*\r\n\r\nAfter the download is completed, run the installer and follow the instructions. Once the installation is completed, a new program called \"Miniforge Prompt\" will appear in your start menu. (Alternatively, you can type \"miniforge\" into your operating system's search bar to find the prompt.) Open it and use the Mambaforge terminal to create a new environment with the required dependencies.\r\n\r\n------------------------------------------------------------------------------------------------------------------------------\r\n\r\n# Environment Creation and Installation\r\n\r\n1. Create a new environment by following these steps:\r\n\r\n - Open the Mambaforge terminal (also known as 'Miniforge Prompt') and type:\r\n\r\n ```console\r\n (base) $ mamba create -n circadipy_env python=3.8\r\n ```\r\n\r\n > **Note**: Python version must be 3.8 because PyMICE, a dependency of CircadiPy for reading Intellicage data, is not compatible with Python versions higher than 3.8.\r\n\r\n - Press 'y' when prompted.\r\n\r\n - After the environment is created, activate it by typing:\r\n\r\n ```console\r\n (base) $ mamba activate circadipy_env\r\n ```\r\n\r\n2. Install the dependencies from the PyPI repository by typing:\r\n\r\n ```console\r\n (circadipy_env) $ pip install circadipy\r\n ```\r\n\r\n------------------------------------------------------------------------------------------------------------------------------\r\n\r\n### CircadiPy also has a built-in simulated data generator that allows the creation of custom data sets for testing, experimentation and comparison purposes.\r\n\r\n### Please visit our documentation page for more information: https://circadipy.readthedocs.io/en/latest/ \r\n\r\nThere you will find:\r\n\r\n1. A more in depth guide on how to use CircadiPy using the simulated data generator in the tutorial section\r\n2. How to use the package to analyse your own data leveraging Jupiter notebooks.\r\n3. A description of the API \r\n\r\n",
"bugtrack_url": null,
"license": null,
"summary": "Tool for analyzing and visualizing circadian cycle data",
"version": "0.1.11",
"project_urls": {
"Homepage": "https://github.com/mcjpedro/circadipy"
},
"split_keywords": [
"circadian",
" chronobiology",
" data"
],
"urls": [
{
"comment_text": "",
"digests": {
"blake2b_256": "f5bdb819d05277c8030a1b1447bf790487448b68684a6edd4bbe46421bfb7dd1",
"md5": "fc7490f2c5ea53faf8a436fad0c74ade",
"sha256": "8fdbade7232bf5a7dd6203e54aaabea9f0f9bd2bd05bcc6a6a039ca1c2931c90"
},
"downloads": -1,
"filename": "circadipy-0.1.11-py3-none-any.whl",
"has_sig": false,
"md5_digest": "fc7490f2c5ea53faf8a436fad0c74ade",
"packagetype": "bdist_wheel",
"python_version": "py3",
"requires_python": null,
"size": 58796,
"upload_time": "2024-08-08T13:23:17",
"upload_time_iso_8601": "2024-08-08T13:23:17.235592Z",
"url": "https://files.pythonhosted.org/packages/f5/bd/b819d05277c8030a1b1447bf790487448b68684a6edd4bbe46421bfb7dd1/circadipy-0.1.11-py3-none-any.whl",
"yanked": false,
"yanked_reason": null
},
{
"comment_text": "",
"digests": {
"blake2b_256": "4606eaa5d47bbd1f6b61f3da7a8dd855cebabb9e743025cdb59b9ee69c2a56cf",
"md5": "0d66db1dc097ca5c73427b5dfe9b9589",
"sha256": "d5d0301091e4b93042483ad9554dcb229e9fb6731b984a40540dacd29242afc5"
},
"downloads": -1,
"filename": "circadipy-0.1.11.tar.gz",
"has_sig": false,
"md5_digest": "0d66db1dc097ca5c73427b5dfe9b9589",
"packagetype": "sdist",
"python_version": "source",
"requires_python": null,
"size": 59323,
"upload_time": "2024-08-08T13:23:18",
"upload_time_iso_8601": "2024-08-08T13:23:18.466928Z",
"url": "https://files.pythonhosted.org/packages/46/06/eaa5d47bbd1f6b61f3da7a8dd855cebabb9e743025cdb59b9ee69c2a56cf/circadipy-0.1.11.tar.gz",
"yanked": false,
"yanked_reason": null
}
],
"upload_time": "2024-08-08 13:23:18",
"github": true,
"gitlab": false,
"bitbucket": false,
"codeberg": false,
"github_user": "mcjpedro",
"github_project": "circadipy",
"github_not_found": true,
"lcname": "circadipy"
}

