
# Diagrams
[](/LICENSE)
[](https://badge.fury.io/py/diagrams)


[](https://www.tickgit.com/browse?repo=github.com/mingrammer/diagrams)

<a href="https://www.buymeacoffee.com/mingrammer" target="_blank"><img src="https://www.buymeacoffee.com/assets/img/custom_images/orange_img.png" alt="Buy Me A Coffee" style="height: 41px !important;width: 174px !important;box-shadow: 0px 3px 2px 0px rgba(190, 190, 190, 0.5) !important;" ></a>
**Diagram as Code**.
Diagrams lets you draw the cloud system architecture **in Python code**. It was born for **prototyping** a new system architecture design without any design tools. You can also describe or visualize the existing system architecture as well. Diagrams currently supports main major providers including: `AWS`, `Azure`, `GCP`, `Kubernetes`, `Alibaba Cloud`, `Oracle Cloud` etc... It also supports `On-Premises` nodes, `SaaS` and major `Programming` frameworks and languages.
**Diagram as Code** also allows you to **track** the architecture diagram changes in any **version control** system.
> NOTE: It does not control any actual cloud resources nor does it generate cloud formation or terraform code. It is just for drawing the cloud system architecture diagrams.
## Providers


## Getting Started
It requires **Python 3.7** or higher, check your Python version first.
It uses [Graphviz](https://www.graphviz.org/) to render the diagram, so you need to [install Graphviz](https://graphviz.gitlab.io/download/) to use **diagrams**. After installing graphviz (or already have it), install the **diagrams**.
> macOS users can download the Graphviz via `brew install graphviz` if you're using [Homebrew](https://brew.sh).
```shell
# using pip (pip3)
$ pip install diagrams
# using pipenv
$ pipenv install diagrams
# using poetry
$ poetry add diagrams
```
You can start with [quick start](https://diagrams.mingrammer.com/docs/getting-started/installation#quick-start). Check out [guides](https://diagrams.mingrammer.com/docs/guides/diagram) for more details, and you can find all available nodes list in [here](https://diagrams.mingrammer.com/docs/nodes/aws).
## Examples
| Event Processing | Stateful Architecture | Advanced Web Service |
| ------------------------------------------------------------ | ------------------------------------------------------------ | ------------------------------------------------------------ |
| 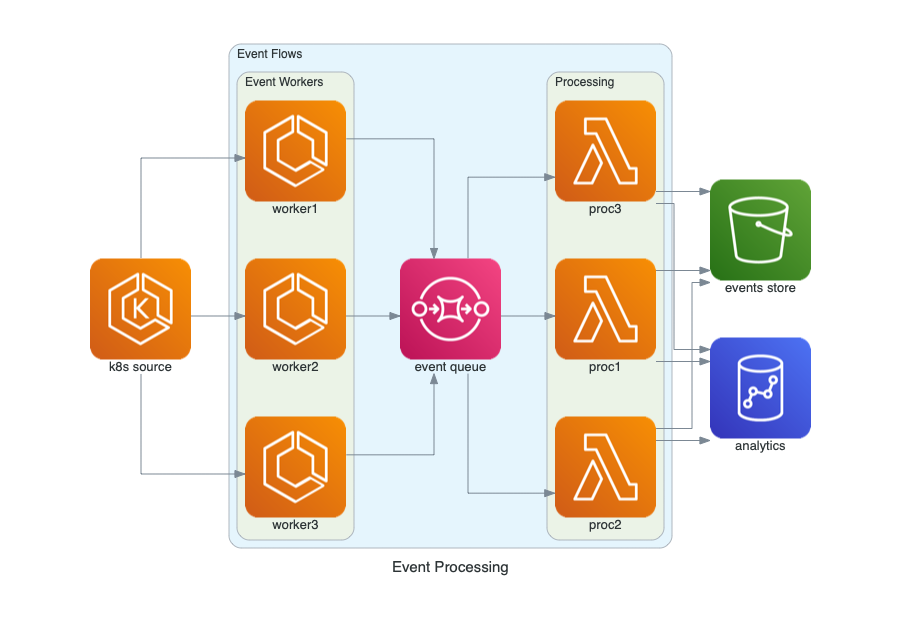 | 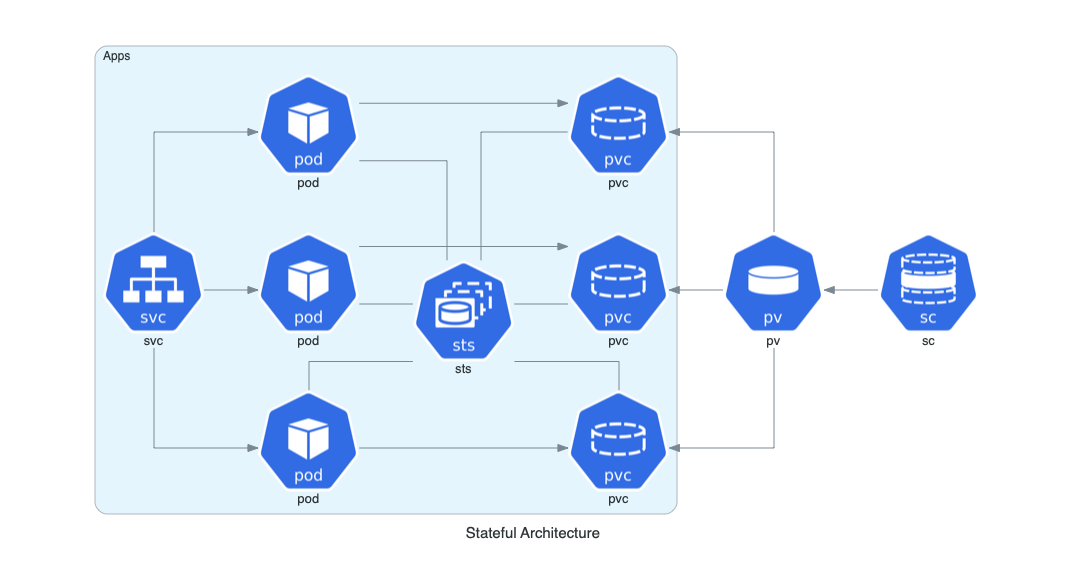 | 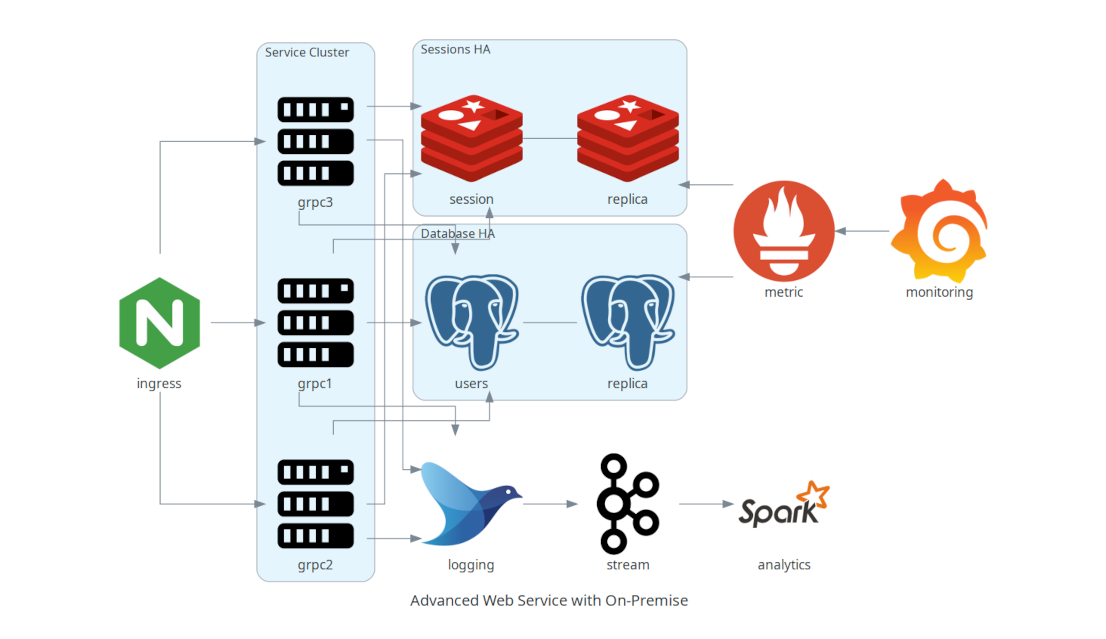 |
You can find all the examples on the [examples](https://diagrams.mingrammer.com/docs/getting-started/examples) page.
## Contributing
To contribute to diagram, check out [contribution guidelines](CONTRIBUTING.md).
> Let me know if you are using diagrams! I'll add you in showcase page. (I'm working on it!) :)
## Who uses it?
[Apache Airflow](https://github.com/apache/airflow) is the most popular data workflow Orchestrator. Airflow uses Diagrams to generate architecture diagrams in their documentation.
[Cloudiscovery](https://github.com/Cloud-Architects/cloudiscovery) helps you to analyze resources in your cloud (AWS/GCP/Azure/Alibaba/IBM) account. It allows you to create a diagram of analyzed cloud resource map based on this Diagrams library, so you can draw your existing cloud infrastructure with Cloudiscovery.
[Airflow Diagrams](https://github.com/feluelle/airflow-diagrams) is an Airflow plugin that aims to easily visualise your Airflow DAGs on service level from providers like AWS, GCP, Azure, etc. via diagrams.
## Other languages
- If you are familiar with Go, you can use [go-diagrams](https://github.com/blushft/go-diagrams) as well.
## License
[MIT](LICENSE)
Raw data
{
"_id": null,
"home_page": "https://diagrams.mingrammer.com",
"name": "diagrams",
"maintainer": null,
"docs_url": null,
"requires_python": "<4.0,>=3.8",
"maintainer_email": null,
"keywords": null,
"author": "mingrammer",
"author_email": "mingrammer@gmail.com",
"download_url": "https://files.pythonhosted.org/packages/05/1f/a72c52faf3d96a22289b887f6373f3feac07e7df0b6871962f7216dd6704/diagrams-0.24.1.tar.gz",
"platform": null,
"description": "\n\n# Diagrams\n\n[](/LICENSE)\n[](https://badge.fury.io/py/diagrams)\n\n\n[](https://www.tickgit.com/browse?repo=github.com/mingrammer/diagrams)\n\n\n<a href=\"https://www.buymeacoffee.com/mingrammer\" target=\"_blank\"><img src=\"https://www.buymeacoffee.com/assets/img/custom_images/orange_img.png\" alt=\"Buy Me A Coffee\" style=\"height: 41px !important;width: 174px !important;box-shadow: 0px 3px 2px 0px rgba(190, 190, 190, 0.5) !important;\" ></a>\n\n**Diagram as Code**.\n\nDiagrams lets you draw the cloud system architecture **in Python code**. It was born for **prototyping** a new system architecture design without any design tools. You can also describe or visualize the existing system architecture as well. Diagrams currently supports main major providers including: `AWS`, `Azure`, `GCP`, `Kubernetes`, `Alibaba Cloud`, `Oracle Cloud` etc... It also supports `On-Premises` nodes, `SaaS` and major `Programming` frameworks and languages.\n\n**Diagram as Code** also allows you to **track** the architecture diagram changes in any **version control** system.\n\n> NOTE: It does not control any actual cloud resources nor does it generate cloud formation or terraform code. It is just for drawing the cloud system architecture diagrams.\n\n## Providers\n\n\n\n\n\n\n\n\n\n\n\n\n\n\n\n\n\n\n\n## Getting Started\n\nIt requires **Python 3.7** or higher, check your Python version first.\n\nIt uses [Graphviz](https://www.graphviz.org/) to render the diagram, so you need to [install Graphviz](https://graphviz.gitlab.io/download/) to use **diagrams**. After installing graphviz (or already have it), install the **diagrams**.\n\n> macOS users can download the Graphviz via `brew install graphviz` if you're using [Homebrew](https://brew.sh).\n\n```shell\n# using pip (pip3)\n$ pip install diagrams\n\n# using pipenv\n$ pipenv install diagrams\n\n# using poetry\n$ poetry add diagrams\n```\n\nYou can start with [quick start](https://diagrams.mingrammer.com/docs/getting-started/installation#quick-start). Check out [guides](https://diagrams.mingrammer.com/docs/guides/diagram) for more details, and you can find all available nodes list in [here](https://diagrams.mingrammer.com/docs/nodes/aws).\n\n## Examples\n\n| Event Processing | Stateful Architecture | Advanced Web Service |\n| ------------------------------------------------------------ | ------------------------------------------------------------ | ------------------------------------------------------------ |\n|  |  |  |\n\nYou can find all the examples on the [examples](https://diagrams.mingrammer.com/docs/getting-started/examples) page.\n\n## Contributing\n\nTo contribute to diagram, check out [contribution guidelines](CONTRIBUTING.md).\n\n> Let me know if you are using diagrams! I'll add you in showcase page. (I'm working on it!) :)\n\n## Who uses it?\n\n[Apache Airflow](https://github.com/apache/airflow) is the most popular data workflow Orchestrator. Airflow uses Diagrams to generate architecture diagrams in their documentation.\n\n[Cloudiscovery](https://github.com/Cloud-Architects/cloudiscovery) helps you to analyze resources in your cloud (AWS/GCP/Azure/Alibaba/IBM) account. It allows you to create a diagram of analyzed cloud resource map based on this Diagrams library, so you can draw your existing cloud infrastructure with Cloudiscovery.\n\n[Airflow Diagrams](https://github.com/feluelle/airflow-diagrams) is an Airflow plugin that aims to easily visualise your Airflow DAGs on service level from providers like AWS, GCP, Azure, etc. via diagrams.\n\n## Other languages\n\n- If you are familiar with Go, you can use [go-diagrams](https://github.com/blushft/go-diagrams) as well.\n\n## License\n\n[MIT](LICENSE)\n",
"bugtrack_url": null,
"license": "MIT",
"summary": "Diagram as Code",
"version": "0.24.1",
"project_urls": {
"Homepage": "https://diagrams.mingrammer.com",
"Repository": "https://github.com/mingrammer/diagrams"
},
"split_keywords": [],
"urls": [
{
"comment_text": "",
"digests": {
"blake2b_256": "1b157e7f886b49701156f6686d38881413b64b01d1ee9bde72faf71fdc84c113",
"md5": "3d3ca885db3388338e6270a5c6c49873",
"sha256": "c1e3267b018bdb66886a09214c7a7884796a0c28456f8aefdf38916a232c2362"
},
"downloads": -1,
"filename": "diagrams-0.24.1-py3-none-any.whl",
"has_sig": false,
"md5_digest": "3d3ca885db3388338e6270a5c6c49873",
"packagetype": "bdist_wheel",
"python_version": "py3",
"requires_python": "<4.0,>=3.8",
"size": 25090168,
"upload_time": "2024-11-07T02:20:55",
"upload_time_iso_8601": "2024-11-07T02:20:55.375525Z",
"url": "https://files.pythonhosted.org/packages/1b/15/7e7f886b49701156f6686d38881413b64b01d1ee9bde72faf71fdc84c113/diagrams-0.24.1-py3-none-any.whl",
"yanked": false,
"yanked_reason": null
},
{
"comment_text": "",
"digests": {
"blake2b_256": "051fa72c52faf3d96a22289b887f6373f3feac07e7df0b6871962f7216dd6704",
"md5": "92d0ca4bfa302ac4c608abb7654e59df",
"sha256": "47b77a0e4dac926a095ff2ae4dd4ec1a192be781799befc660a8f5ce6ea1052f"
},
"downloads": -1,
"filename": "diagrams-0.24.1.tar.gz",
"has_sig": false,
"md5_digest": "92d0ca4bfa302ac4c608abb7654e59df",
"packagetype": "sdist",
"python_version": "source",
"requires_python": "<4.0,>=3.8",
"size": 24362844,
"upload_time": "2024-11-07T02:21:06",
"upload_time_iso_8601": "2024-11-07T02:21:06.321445Z",
"url": "https://files.pythonhosted.org/packages/05/1f/a72c52faf3d96a22289b887f6373f3feac07e7df0b6871962f7216dd6704/diagrams-0.24.1.tar.gz",
"yanked": false,
"yanked_reason": null
}
],
"upload_time": "2024-11-07 02:21:06",
"github": true,
"gitlab": false,
"bitbucket": false,
"codeberg": false,
"github_user": "mingrammer",
"github_project": "diagrams",
"travis_ci": false,
"coveralls": false,
"github_actions": true,
"lcname": "diagrams"
}

