# drawSvg
A Python 3 library for programmatically generating SVG images (vector drawings) and rendering them or displaying them in a Jupyter notebook.
Most common SVG tags are supported and others can easily be added by writing a small subclass of `DrawableBasicElement` or `DrawableParentElement`.
An interactive [Jupyter notebook](https://jupyter.org) widget, `drawSvg.widgets.DrawingWidget`, is included that can update drawings based on mouse events.
# Install
drawSvg is available on PyPI:
```
$ pip3 install drawSvg
```
## Prerequisites
Cairo needs to be installed separately. When Cairo is installed, drawSvg can output PNG or other image formats in addition to SVG. See platform-specific [instructions for Linux, Windows, and macOS from Cairo](https://www.cairographics.org/download/). Below are some examples for installing Cairo on Linux distributions and macOS.
**Ubuntu**
```
$ sudo apt-get install libcairo2
```
**macOS**
Using [homebrew](https://brew.sh/):
```
$ brew install cairo
```
# Examples
### Basic drawing elements
```python
import drawSvg as draw
d = draw.Drawing(200, 100, origin='center', displayInline=False)
# Draw an irregular polygon
d.append(draw.Lines(-80, -45,
70, -49,
95, 49,
-90, 40,
close=False,
fill='#eeee00',
stroke='black'))
# Draw a rectangle
r = draw.Rectangle(-80,0,40,50, fill='#1248ff')
r.appendTitle("Our first rectangle") # Add a tooltip
d.append(r)
# Draw a circle
d.append(draw.Circle(-40, -10, 30,
fill='red', stroke_width=2, stroke='black'))
# Draw an arbitrary path (a triangle in this case)
p = draw.Path(stroke_width=2, stroke='lime',
fill='black', fill_opacity=0.2)
p.M(-10, 20) # Start path at point (-10, 20)
p.C(30, -10, 30, 50, 70, 20) # Draw a curve to (70, 20)
d.append(p)
# Draw text
d.append(draw.Text('Basic text', 8, -10, 35, fill='blue')) # Text with font size 8
d.append(draw.Text('Path text', 8, path=p, text_anchor='start', valign='middle'))
d.append(draw.Text(['Multi-line', 'text'], 8, path=p, text_anchor='end'))
# Draw multiple circular arcs
d.append(draw.ArcLine(60,-20,20,60,270,
stroke='red', stroke_width=5, fill='red', fill_opacity=0.2))
d.append(draw.Arc(60,-20,20,60,270,cw=False,
stroke='green', stroke_width=3, fill='none'))
d.append(draw.Arc(60,-20,20,270,60,cw=True,
stroke='blue', stroke_width=1, fill='black', fill_opacity=0.3))
# Draw arrows
arrow = draw.Marker(-0.1, -0.5, 0.9, 0.5, scale=4, orient='auto')
arrow.append(draw.Lines(-0.1, -0.5, -0.1, 0.5, 0.9, 0, fill='red', close=True))
p = draw.Path(stroke='red', stroke_width=2, fill='none',
marker_end=arrow) # Add an arrow to the end of a path
p.M(20, -40).L(20, -27).L(0, -20) # Chain multiple path operations
d.append(p)
d.append(draw.Line(30, -20, 0, -10,
stroke='red', stroke_width=2, fill='none',
marker_end=arrow)) # Add an arrow to the end of a line
d.setPixelScale(2) # Set number of pixels per geometry unit
#d.setRenderSize(400,200) # Alternative to setPixelScale
d.saveSvg('example.svg')
d.savePng('example.png')
# Display in Jupyter notebook
d.rasterize() # Display as PNG
d # Display as SVG
```
[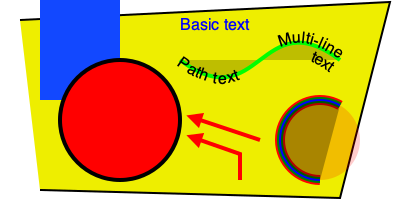](https://github.com/cduck/drawSvg/blob/master/examples/example1.svg)
### Gradients
```python
import drawSvg as draw
d = draw.Drawing(1.5, 0.8, origin='center')
d.draw(draw.Rectangle(-0.75,-0.5,1.5,1, fill='#ddd'))
# Create gradient
gradient = draw.RadialGradient(0,-0.35,0.7*10)
gradient.addStop(0.5/0.7/10, 'green', 1)
gradient.addStop(1/10, 'red', 0)
# Draw a shape to fill with the gradient
p = draw.Path(fill=gradient, stroke='black', stroke_width=0.002)
p.arc(0,-0.35,0.7,30,120)
p.arc(0,-0.35,0.5,120,30,cw=True, includeL=True)
p.Z()
d.append(p)
# Draw another shape to fill with the same gradient
p = draw.Path(fill=gradient, stroke='red', stroke_width=0.002)
p.arc(0,-0.35,0.75,130,160)
p.arc(0,-0.35,0,160,130,cw=True, includeL=True)
p.Z()
d.append(p)
# Another gradient
gradient2 = draw.LinearGradient(0.1,-0.35,0.1+0.6,-0.35+0.2)
gradient2.addStop(0, 'green', 1)
gradient2.addStop(1, 'red', 0)
d.append(draw.Rectangle(0.1,-0.35,0.6,0.2,
stroke='black', stroke_width=0.002,
fill=gradient2))
# Display
d.setRenderSize(w=600)
d
```
[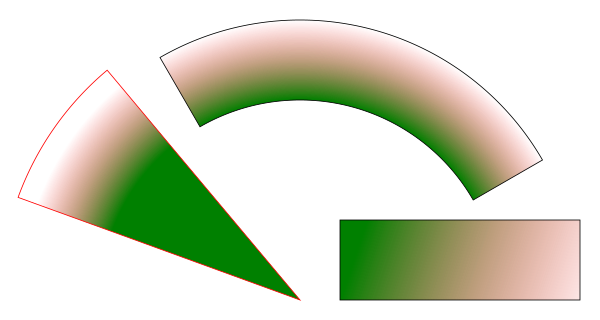](https://github.com/cduck/drawSvg/blob/master/examples/example2.svg)
### Duplicate geometry and clip paths
```python
import drawSvg as draw
d = draw.Drawing(1.4, 1.4, origin='center')
# Define clip path
clip = draw.ClipPath()
clip.append(draw.Rectangle(-.25,.25-1,1,1))
# Draw a cropped circle
c = draw.Circle(0,0,0.5, stroke_width='0.01', stroke='black',
fill_opacity=0.3, clip_path=clip,
id='circle')
d.append(c)
# Make a transparent copy, cropped again
g = draw.Group(opacity=0.5, clip_path=clip)
g.append(draw.Use('circle', 0.25,0.1))
d.append(g)
# Display
d.setRenderSize(400)
d.rasterize()
```
[](https://github.com/cduck/drawSvg/blob/master/examples/example3.svg)
### Implementing other SVG tags
```python
import drawSvg as draw
# Subclass DrawingBasicElement if it cannot have child nodes
# Subclass DrawingParentElement otherwise
# Subclass DrawingDef if it must go between <def></def> tags in an SVG
class Hyperlink(draw.DrawingParentElement):
TAG_NAME = 'a'
def __init__(self, href, target=None, **kwargs):
# Other init logic...
# Keyword arguments to super().__init__() correspond to SVG node
# arguments: stroke_width=5 -> stroke-width="5"
super().__init__(href=href, target=target, **kwargs)
d = draw.Drawing(1, 1.2, origin='center')
# Create hyperlink
hlink = Hyperlink('https://www.python.org', target='_blank',
transform='skewY(-30)')
# Add child elements
hlink.append(draw.Circle(0,0,0.5, fill='green'))
hlink.append(draw.Text('Hyperlink',0.2, 0,0, center=0.6, fill='white'))
# Draw and display
d.append(hlink)
d.setRenderSize(200)
d
```
[](https://github.com/cduck/drawSvg/blob/master/examples/example4.svg)
### Animation with the SVG Animate Tag
```python
import drawSvg as draw
d = draw.Drawing(200, 200, origin='center')
# Animate the position and color of circle
c = draw.Circle(0, 0, 20, fill='red')
# See for supported attributes:
# https://developer.mozilla.org/en-US/docs/Web/SVG/Element/animate
c.appendAnim(draw.Animate('cy', '6s', '-80;80;-80',
repeatCount='indefinite'))
c.appendAnim(draw.Animate('cx', '6s', '0;80;0;-80;0',
repeatCount='indefinite'))
c.appendAnim(draw.Animate('fill', '6s', 'red;green;blue;yellow',
calcMode='discrete',
repeatCount='indefinite'))
d.append(c)
# Animate a black circle around an ellipse
ellipse = draw.Path()
ellipse.M(-90, 0)
ellipse.A(90, 40, 360, True, True, 90, 0) # Ellipse path
ellipse.A(90, 40, 360, True, True, -90, 0)
ellipse.Z()
c2 = draw.Circle(0, 0, 10)
# See for supported attributes:
# https://developer.mozilla.org/en-US/docs/Web/SVG/Element/animateMotion
c2.appendAnim(draw.AnimateMotion(ellipse, '3s',
repeatCount='indefinite'))
# See for supported attributes:
# https://developer.mozilla.org/en-US/docs/Web/SVG/Element/animateTransform
c2.appendAnim(draw.AnimateTransform('scale', '3s', '1,2;2,1;1,2;2,1;1,2',
repeatCount='indefinite'))
d.append(c2)
d.saveSvg('animated.svg') # Save to file
d # Display in Jupyter notebook
```
[](https://github.com/cduck/drawSvg/blob/master/examples/animated.svg)
### Interactive Widget
```python
import drawSvg as draw
from drawSvg.widgets import DrawingWidget
import hyperbolic.poincare.shapes as hyper # pip3 install hyperbolic
# Create drawing
d = draw.Drawing(2, 2, origin='center')
d.setRenderSize(500)
d.append(draw.Circle(0, 0, 1, fill='orange'))
group = draw.Group()
d.append(group)
# Update the drawing based on user input
click_list = []
def redraw(points):
group.children.clear()
for x1, y1 in points:
for x2, y2 in points:
if (x1, y1) == (x2, y2): continue
p1 = hyper.Point.fromEuclid(x1, y1)
p2 = hyper.Point.fromEuclid(x2, y2)
if p1.distanceTo(p2) <= 2:
line = hyper.Line.fromPoints(*p1, *p2, segment=True)
group.draw(line, hwidth=0.2, fill='white')
for x, y in points:
p = hyper.Point.fromEuclid(x, y)
group.draw(hyper.Circle.fromCenterRadius(p, 0.1),
fill='green')
redraw(click_list)
# Create interactive widget and register mouse events
widget = DrawingWidget(d)
@widget.mousedown
def mousedown(widget, x, y, info):
if (x**2 + y**2) ** 0.5 + 1e-5 < 1:
click_list.append((x, y))
redraw(click_list)
widget.refresh()
@widget.mousemove
def mousemove(widget, x, y, info):
if (x**2 + y**2) ** 0.5 + 1e-5 < 1:
redraw(click_list + [(x, y)])
widget.refresh()
widget
```
Note: If the above example does not work in Jupyter Lab, try `Help > Launch Classic Notebook`.
### Animation with Python
```python
import drawSvg as draw
# Draw a frame of the animation
def draw_frame(t):
d = draw.Drawing(2, 6.05, origin=(-1,-1.05))
d.setRenderSize(h=300)
d.append(draw.Rectangle(-2, -2, 4, 8, fill='white'))
d.append(draw.Rectangle(-1, -1.05, 2, 0.05, fill='brown'))
t = (t + 1) % 2 - 1
y = 4 - t**2 * 4
d.append(draw.Circle(0, y, 1, fill='lime'))
return d
with draw.animate_jupyter(draw_frame, delay=0.05) as anim:
# Or:
#with draw.animate_video('example6.gif', draw_frame, duration=0.05
# ) as anim:
# Add each frame to the animation
for i in range(20):
anim.draw_frame(i/10)
for i in range(20):
anim.draw_frame(i/10)
for i in range(20):
anim.draw_frame(i/10)
```

### Asynchronous Animation in Jupyter
```python
# Jupyter cell 1:
import drawSvg as draw
from drawSvg.widgets import AsyncAnimation
widget = AsyncAnimation(fps=10)
widget
# [Animation is displayed here (click to pause)]
# Jupyter cell 2:
global_variable = 'a'
@widget.set_draw_frame # Animation above is automatically updated
def draw_frame(secs=0):
# Draw something...
d = draw.Drawing(100, 40)
d.append(draw.Text(global_variable, 20, 0, 10))
d.append(draw.Text('{:0.1f}'.format(secs), 20, 30, 10))
return d
# Jupyter cell 3:
global_variable = 'b' # Animation above now displays 'b'
```

Note: If the above example does not work in Jupyter Lab, try `Help > Launch Classic Notebook`.
Raw data
{
"_id": null,
"home_page": "https://github.com/cduck/drawSvg",
"name": "drawSvg",
"maintainer": "",
"docs_url": null,
"requires_python": "",
"maintainer_email": "",
"keywords": "SVG,draw,graphics,iPython,Jupyter,widget",
"author": "Casey Duckering",
"author_email": "",
"download_url": "https://github.com/cduck/drawSvg/archive/1.9.0.tar.gz",
"platform": null,
"description": "# drawSvg\n\nA Python 3 library for programmatically generating SVG images (vector drawings) and rendering them or displaying them in a Jupyter notebook.\n\nMost common SVG tags are supported and others can easily be added by writing a small subclass of `DrawableBasicElement` or `DrawableParentElement`.\n\nAn interactive [Jupyter notebook](https://jupyter.org) widget, `drawSvg.widgets.DrawingWidget`, is included that can update drawings based on mouse events.\n\n# Install\n\ndrawSvg is available on PyPI:\n\n```\n$ pip3 install drawSvg\n```\n\n## Prerequisites\n\nCairo needs to be installed separately. When Cairo is installed, drawSvg can output PNG or other image formats in addition to SVG. See platform-specific [instructions for Linux, Windows, and macOS from Cairo](https://www.cairographics.org/download/). Below are some examples for installing Cairo on Linux distributions and macOS.\n\n**Ubuntu**\n\n```\n$ sudo apt-get install libcairo2\n```\n\n**macOS**\n\nUsing [homebrew](https://brew.sh/):\n\n```\n$ brew install cairo\n```\n\n# Examples\n\n### Basic drawing elements\n```python\nimport drawSvg as draw\n\nd = draw.Drawing(200, 100, origin='center', displayInline=False)\n\n# Draw an irregular polygon\nd.append(draw.Lines(-80, -45,\n 70, -49,\n 95, 49,\n -90, 40,\n close=False,\n fill='#eeee00',\n stroke='black'))\n\n# Draw a rectangle\nr = draw.Rectangle(-80,0,40,50, fill='#1248ff')\nr.appendTitle(\"Our first rectangle\") # Add a tooltip\nd.append(r)\n\n# Draw a circle\nd.append(draw.Circle(-40, -10, 30,\n fill='red', stroke_width=2, stroke='black'))\n\n# Draw an arbitrary path (a triangle in this case)\np = draw.Path(stroke_width=2, stroke='lime',\n fill='black', fill_opacity=0.2)\np.M(-10, 20) # Start path at point (-10, 20)\np.C(30, -10, 30, 50, 70, 20) # Draw a curve to (70, 20)\nd.append(p)\n\n# Draw text\nd.append(draw.Text('Basic text', 8, -10, 35, fill='blue')) # Text with font size 8\nd.append(draw.Text('Path text', 8, path=p, text_anchor='start', valign='middle'))\nd.append(draw.Text(['Multi-line', 'text'], 8, path=p, text_anchor='end'))\n\n# Draw multiple circular arcs\nd.append(draw.ArcLine(60,-20,20,60,270,\n stroke='red', stroke_width=5, fill='red', fill_opacity=0.2))\nd.append(draw.Arc(60,-20,20,60,270,cw=False,\n stroke='green', stroke_width=3, fill='none'))\nd.append(draw.Arc(60,-20,20,270,60,cw=True,\n stroke='blue', stroke_width=1, fill='black', fill_opacity=0.3))\n\n# Draw arrows\narrow = draw.Marker(-0.1, -0.5, 0.9, 0.5, scale=4, orient='auto')\narrow.append(draw.Lines(-0.1, -0.5, -0.1, 0.5, 0.9, 0, fill='red', close=True))\np = draw.Path(stroke='red', stroke_width=2, fill='none',\n marker_end=arrow) # Add an arrow to the end of a path\np.M(20, -40).L(20, -27).L(0, -20) # Chain multiple path operations\nd.append(p)\nd.append(draw.Line(30, -20, 0, -10,\n stroke='red', stroke_width=2, fill='none',\n marker_end=arrow)) # Add an arrow to the end of a line\n\nd.setPixelScale(2) # Set number of pixels per geometry unit\n#d.setRenderSize(400,200) # Alternative to setPixelScale\nd.saveSvg('example.svg')\nd.savePng('example.png')\n\n# Display in Jupyter notebook\nd.rasterize() # Display as PNG\nd # Display as SVG\n```\n\n[](https://github.com/cduck/drawSvg/blob/master/examples/example1.svg)\n\n### Gradients\n```python\nimport drawSvg as draw\n\nd = draw.Drawing(1.5, 0.8, origin='center')\n\nd.draw(draw.Rectangle(-0.75,-0.5,1.5,1, fill='#ddd'))\n\n# Create gradient\ngradient = draw.RadialGradient(0,-0.35,0.7*10)\ngradient.addStop(0.5/0.7/10, 'green', 1)\ngradient.addStop(1/10, 'red', 0)\n\n# Draw a shape to fill with the gradient\np = draw.Path(fill=gradient, stroke='black', stroke_width=0.002)\np.arc(0,-0.35,0.7,30,120)\np.arc(0,-0.35,0.5,120,30,cw=True, includeL=True)\np.Z()\nd.append(p)\n\n# Draw another shape to fill with the same gradient\np = draw.Path(fill=gradient, stroke='red', stroke_width=0.002)\np.arc(0,-0.35,0.75,130,160)\np.arc(0,-0.35,0,160,130,cw=True, includeL=True)\np.Z()\nd.append(p)\n\n# Another gradient\ngradient2 = draw.LinearGradient(0.1,-0.35,0.1+0.6,-0.35+0.2)\ngradient2.addStop(0, 'green', 1)\ngradient2.addStop(1, 'red', 0)\nd.append(draw.Rectangle(0.1,-0.35,0.6,0.2,\n stroke='black', stroke_width=0.002,\n fill=gradient2))\n\n# Display\nd.setRenderSize(w=600)\nd\n```\n\n[](https://github.com/cduck/drawSvg/blob/master/examples/example2.svg)\n\n### Duplicate geometry and clip paths\n```python\nimport drawSvg as draw\n\nd = draw.Drawing(1.4, 1.4, origin='center')\n\n# Define clip path\nclip = draw.ClipPath()\nclip.append(draw.Rectangle(-.25,.25-1,1,1))\n\n# Draw a cropped circle\nc = draw.Circle(0,0,0.5, stroke_width='0.01', stroke='black',\n fill_opacity=0.3, clip_path=clip,\n id='circle')\nd.append(c)\n\n# Make a transparent copy, cropped again\ng = draw.Group(opacity=0.5, clip_path=clip)\ng.append(draw.Use('circle', 0.25,0.1))\nd.append(g)\n\n# Display\nd.setRenderSize(400)\nd.rasterize()\n```\n\n[](https://github.com/cduck/drawSvg/blob/master/examples/example3.svg)\n\n### Implementing other SVG tags\n```python\nimport drawSvg as draw\n\n# Subclass DrawingBasicElement if it cannot have child nodes\n# Subclass DrawingParentElement otherwise\n# Subclass DrawingDef if it must go between <def></def> tags in an SVG\nclass Hyperlink(draw.DrawingParentElement):\n TAG_NAME = 'a'\n def __init__(self, href, target=None, **kwargs):\n # Other init logic...\n # Keyword arguments to super().__init__() correspond to SVG node\n # arguments: stroke_width=5 -> stroke-width=\"5\"\n super().__init__(href=href, target=target, **kwargs)\n\nd = draw.Drawing(1, 1.2, origin='center')\n\n# Create hyperlink\nhlink = Hyperlink('https://www.python.org', target='_blank',\n transform='skewY(-30)')\n# Add child elements\nhlink.append(draw.Circle(0,0,0.5, fill='green'))\nhlink.append(draw.Text('Hyperlink',0.2, 0,0, center=0.6, fill='white'))\n\n# Draw and display\nd.append(hlink)\nd.setRenderSize(200)\nd\n```\n\n[](https://github.com/cduck/drawSvg/blob/master/examples/example4.svg)\n\n### Animation with the SVG Animate Tag\n```python\nimport drawSvg as draw\n\nd = draw.Drawing(200, 200, origin='center')\n\n# Animate the position and color of circle\nc = draw.Circle(0, 0, 20, fill='red')\n# See for supported attributes:\n# https://developer.mozilla.org/en-US/docs/Web/SVG/Element/animate\nc.appendAnim(draw.Animate('cy', '6s', '-80;80;-80',\n repeatCount='indefinite'))\nc.appendAnim(draw.Animate('cx', '6s', '0;80;0;-80;0',\n repeatCount='indefinite'))\nc.appendAnim(draw.Animate('fill', '6s', 'red;green;blue;yellow',\n calcMode='discrete',\n repeatCount='indefinite'))\nd.append(c)\n\n# Animate a black circle around an ellipse\nellipse = draw.Path()\nellipse.M(-90, 0)\nellipse.A(90, 40, 360, True, True, 90, 0) # Ellipse path\nellipse.A(90, 40, 360, True, True, -90, 0)\nellipse.Z()\nc2 = draw.Circle(0, 0, 10)\n# See for supported attributes:\n# https://developer.mozilla.org/en-US/docs/Web/SVG/Element/animateMotion\nc2.appendAnim(draw.AnimateMotion(ellipse, '3s',\n repeatCount='indefinite'))\n# See for supported attributes:\n# https://developer.mozilla.org/en-US/docs/Web/SVG/Element/animateTransform\nc2.appendAnim(draw.AnimateTransform('scale', '3s', '1,2;2,1;1,2;2,1;1,2',\n repeatCount='indefinite'))\nd.append(c2)\n\nd.saveSvg('animated.svg') # Save to file\nd # Display in Jupyter notebook\n```\n\n[](https://github.com/cduck/drawSvg/blob/master/examples/animated.svg)\n\n### Interactive Widget\n```python\nimport drawSvg as draw\nfrom drawSvg.widgets import DrawingWidget\nimport hyperbolic.poincare.shapes as hyper # pip3 install hyperbolic\n\n# Create drawing\nd = draw.Drawing(2, 2, origin='center')\nd.setRenderSize(500)\nd.append(draw.Circle(0, 0, 1, fill='orange'))\ngroup = draw.Group()\nd.append(group)\n\n# Update the drawing based on user input\nclick_list = []\ndef redraw(points):\n group.children.clear()\n for x1, y1 in points:\n for x2, y2 in points:\n if (x1, y1) == (x2, y2): continue\n p1 = hyper.Point.fromEuclid(x1, y1)\n p2 = hyper.Point.fromEuclid(x2, y2)\n if p1.distanceTo(p2) <= 2:\n line = hyper.Line.fromPoints(*p1, *p2, segment=True)\n group.draw(line, hwidth=0.2, fill='white')\n for x, y in points:\n p = hyper.Point.fromEuclid(x, y)\n group.draw(hyper.Circle.fromCenterRadius(p, 0.1),\n fill='green')\nredraw(click_list)\n\n# Create interactive widget and register mouse events\nwidget = DrawingWidget(d)\n@widget.mousedown\ndef mousedown(widget, x, y, info):\n if (x**2 + y**2) ** 0.5 + 1e-5 < 1:\n click_list.append((x, y))\n redraw(click_list)\n widget.refresh()\n@widget.mousemove\ndef mousemove(widget, x, y, info):\n if (x**2 + y**2) ** 0.5 + 1e-5 < 1:\n redraw(click_list + [(x, y)])\n widget.refresh()\nwidget\n```\n\n\n\nNote: If the above example does not work in Jupyter Lab, try `Help > Launch Classic Notebook`.\n\n### Animation with Python\n```python\nimport drawSvg as draw\n\n# Draw a frame of the animation\ndef draw_frame(t):\n d = draw.Drawing(2, 6.05, origin=(-1,-1.05))\n d.setRenderSize(h=300)\n d.append(draw.Rectangle(-2, -2, 4, 8, fill='white'))\n d.append(draw.Rectangle(-1, -1.05, 2, 0.05, fill='brown'))\n t = (t + 1) % 2 - 1\n y = 4 - t**2 * 4\n d.append(draw.Circle(0, y, 1, fill='lime'))\n return d\n\nwith draw.animate_jupyter(draw_frame, delay=0.05) as anim:\n# Or:\n#with draw.animate_video('example6.gif', draw_frame, duration=0.05\n# ) as anim:\n # Add each frame to the animation\n for i in range(20):\n anim.draw_frame(i/10)\n for i in range(20):\n anim.draw_frame(i/10)\n for i in range(20):\n anim.draw_frame(i/10)\n```\n\n\n\n### Asynchronous Animation in Jupyter\n```python\n# Jupyter cell 1:\nimport drawSvg as draw\nfrom drawSvg.widgets import AsyncAnimation\nwidget = AsyncAnimation(fps=10)\nwidget\n# [Animation is displayed here (click to pause)]\n\n# Jupyter cell 2:\nglobal_variable = 'a'\n@widget.set_draw_frame # Animation above is automatically updated\ndef draw_frame(secs=0):\n # Draw something...\n d = draw.Drawing(100, 40)\n d.append(draw.Text(global_variable, 20, 0, 10))\n d.append(draw.Text('{:0.1f}'.format(secs), 20, 30, 10))\n return d\n\n# Jupyter cell 3:\nglobal_variable = 'b' # Animation above now displays 'b'\n```\n\n\n\nNote: If the above example does not work in Jupyter Lab, try `Help > Launch Classic Notebook`.\n",
"bugtrack_url": null,
"license": "",
"summary": "A Python 3 library for programmatically generating SVG images (vector drawings) and rendering them or displaying them in a Jupyter notebook",
"version": "1.9.0",
"split_keywords": [
"svg",
"draw",
"graphics",
"ipython",
"jupyter",
"widget"
],
"urls": [
{
"comment_text": "",
"digests": {
"md5": "7dca1dbbcdb18669eaa78390e28a5ca0",
"sha256": "f8b2bd60d52306061133f15df7020c1b7d7f212a90a8acac97c5e01027f90fec"
},
"downloads": -1,
"filename": "drawSvg-1.9.0-py3-none-any.whl",
"has_sig": false,
"md5_digest": "7dca1dbbcdb18669eaa78390e28a5ca0",
"packagetype": "bdist_wheel",
"python_version": "py3",
"requires_python": null,
"size": 26204,
"upload_time": "2022-11-28T00:56:23",
"upload_time_iso_8601": "2022-11-28T00:56:23.878219Z",
"url": "https://files.pythonhosted.org/packages/4c/fd/8856d7fde3d0bae9a4660549dd4bd1f1620fcd09ec437b8b1d42711b1690/drawSvg-1.9.0-py3-none-any.whl",
"yanked": false,
"yanked_reason": null
}
],
"upload_time": "2022-11-28 00:56:23",
"github": true,
"gitlab": false,
"bitbucket": false,
"github_user": "cduck",
"github_project": "drawSvg",
"travis_ci": false,
"coveralls": false,
"github_actions": false,
"lcname": "drawsvg"
}

