<h1 align="center"> Data-viz utils 📈</h1>
<p align="center"> Functions for data visualization in matplotlib
</p>
<p align="center">
<img src="https://img.shields.io/badge/license-mit-blue.svg">
<img src="https://img.shields.io/badge/python-3.6--3.8-blue">
<img src="https://img.shields.io/github/checks-status/csinva/data-viz-utils/master">
<img src="https://img.shields.io/pypi/v/dvu?color=orange">
</p>
<p align="center" fontsize=40><a href="https://csinva.io/data-viz-utils/docs/dvu.html"> 📚 API </a>
</p>
Can be installed using `pip install dvu` and then imported with `import dvu`.
You can also just copy the relatively short source code for the functions (easily viewable [here](https://csinva.io/data-viz-utils/docs/dvu.html)).
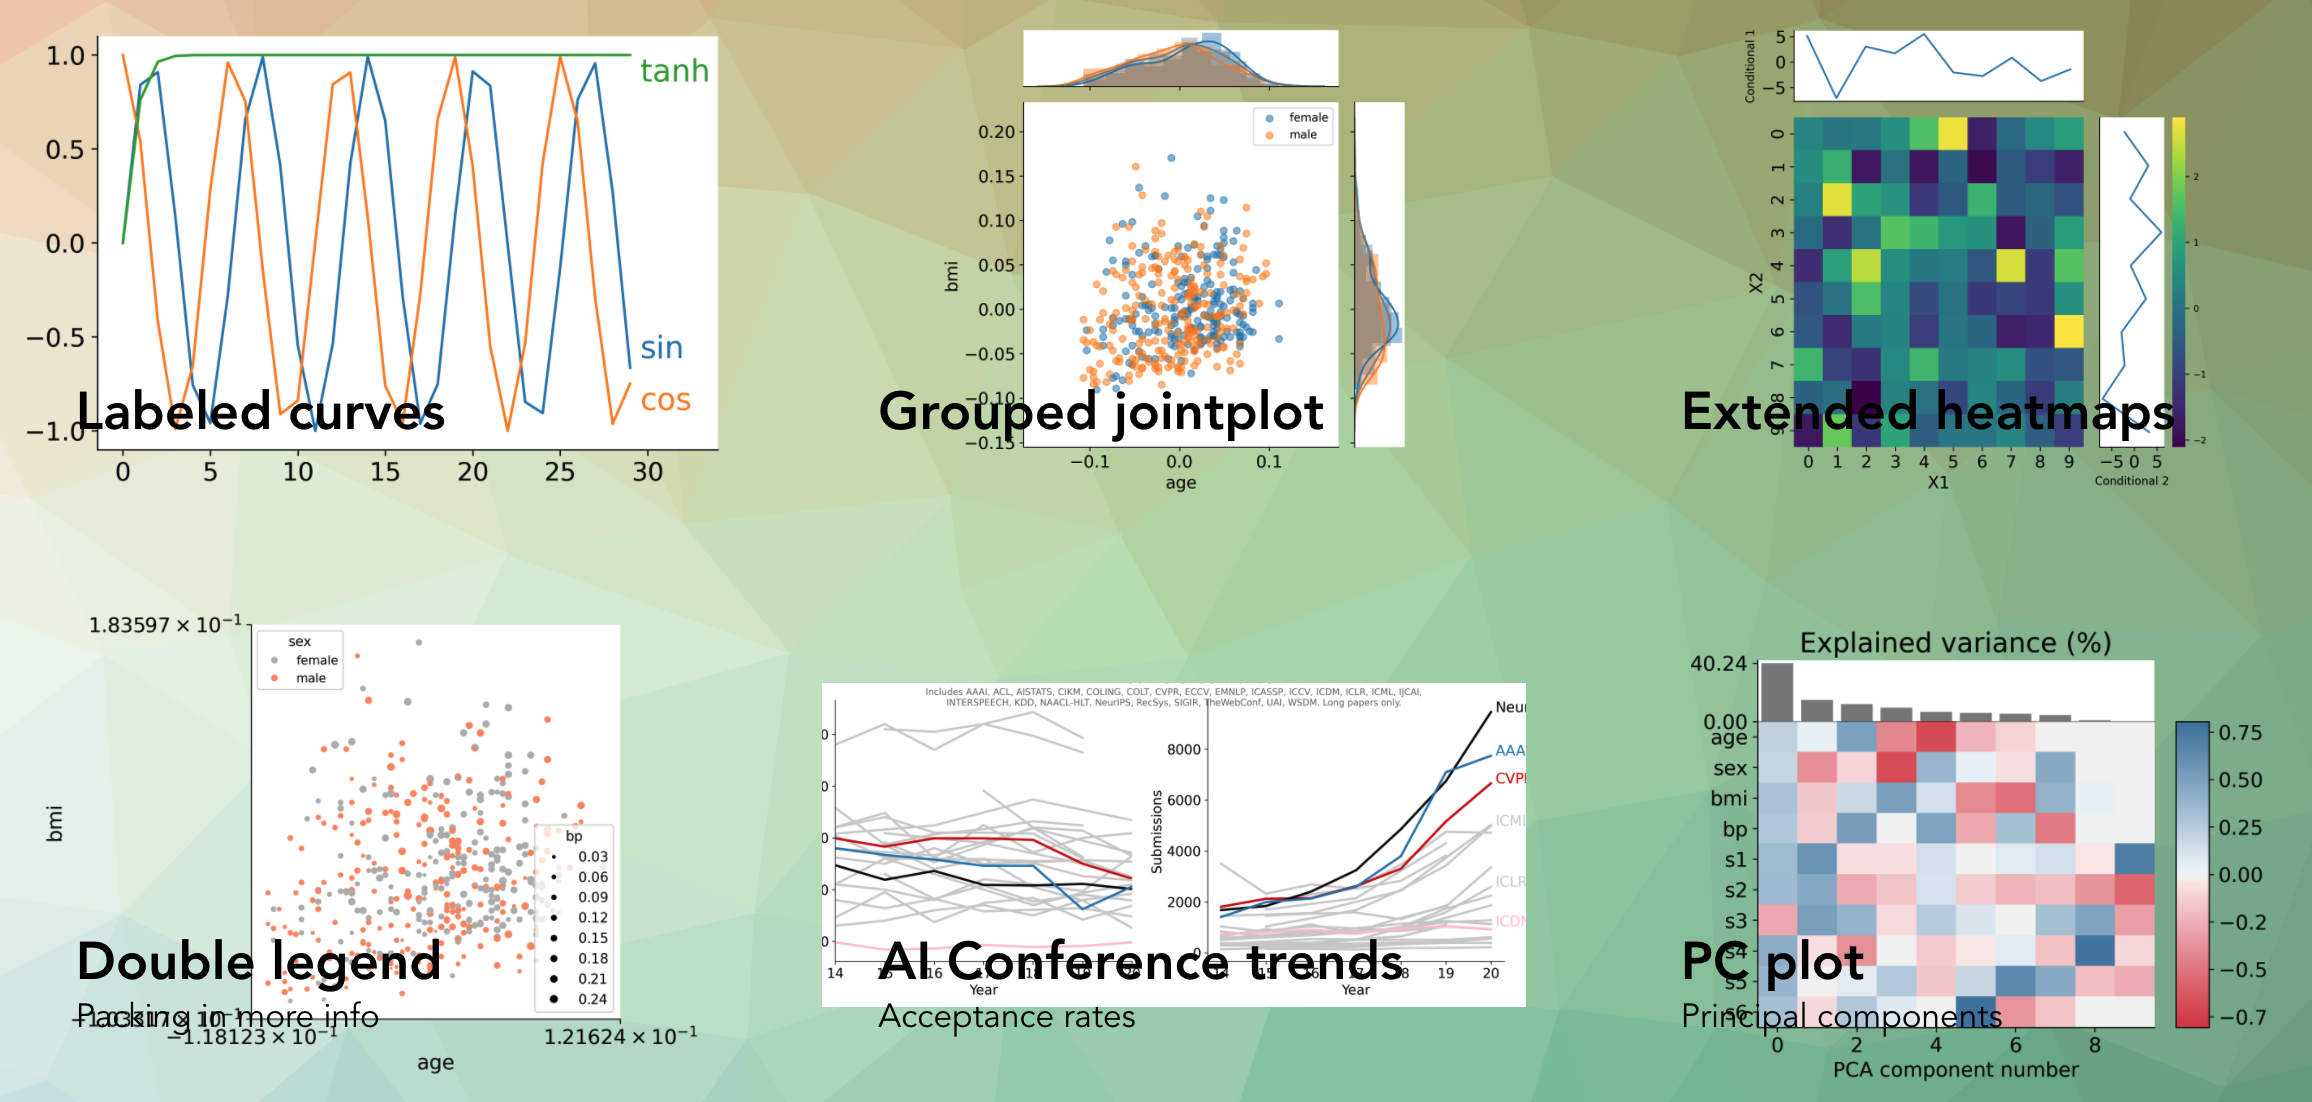
Helps create a bunch of different plots such as these:
One particularly useful function is `dvu.line_legend()` which replaces a typical matplotlib legend with labels for each line:
| Using `plt.legend()` | Using `dvu.line_legend()` |
| --------------------------------------------------- | ---------------------------------------------- |
|  |  |
Another one is `dvu.invert_plot()` which can be called after generating a plot to invert everything besides the line colors
| Original plot | After `dvu.invert_plot()` |
| ---------------------------------------------- | --------------------------------------------------- |
|  |  |
# Reference
- for updates, star the repo or follow [@csinva_](https://twitter.com/csinva_)
- super-related and wonderful [matplotlib-label-lines](https://github.com/cphyc/matplotlib-label-lines) project
- [PR](https://t.co/lTe19vdETE?amp=1) for implementing line-labeling into matplotlib
- feel free to use openly!
- built with jekyll + github pages
- theme from [here](https://github.com/inded/Jekyll_modern-blog)
- based off of this [article from Codrops](http://tympanus.net/codrops/?p=24222)
Raw data
{
"_id": null,
"home_page": "https://github.com/csinva/data-viz-utils",
"name": "dvu",
"maintainer": "",
"docs_url": null,
"requires_python": ">=3.6",
"maintainer_email": "",
"keywords": "",
"author": "Chandan Singh",
"author_email": "chandan_singh@berkeley.edu",
"download_url": "https://files.pythonhosted.org/packages/05/70/af379b76dc2981b654e7bcd089a22a6e7d5cfc0ea3376fb80fbb1eb69bb2/dvu-0.0.2.tar.gz",
"platform": null,
"description": "<h1 align=\"center\"> Data-viz utils \ud83d\udcc8</h1>\n<p align=\"center\"> Functions for data visualization in matplotlib\n</p>\n<p align=\"center\">\n <img src=\"https://img.shields.io/badge/license-mit-blue.svg\">\n <img src=\"https://img.shields.io/badge/python-3.6--3.8-blue\">\n <img src=\"https://img.shields.io/github/checks-status/csinva/data-viz-utils/master\">\n <img src=\"https://img.shields.io/pypi/v/dvu?color=orange\">\n</p> \n<p align=\"center\" fontsize=40><a href=\"https://csinva.io/data-viz-utils/docs/dvu.html\"> \ud83d\udcda API </a>\n</p>\n\n\nCan be installed using `pip install dvu` and then imported with `import dvu`. \n\nYou can also just copy the relatively short source code for the functions (easily viewable [here](https://csinva.io/data-viz-utils/docs/dvu.html)). \n\nHelps create a bunch of different plots such as these:\n\n\n\n\n\nOne particularly useful function is `dvu.line_legend()` which replaces a typical matplotlib legend with labels for each line:\n\n\n| Using `plt.legend()` | Using `dvu.line_legend()` |\n| --------------------------------------------------- | ---------------------------------------------- |\n|  |  |\n\n\n\nAnother one is `dvu.invert_plot()` which can be called after generating a plot to invert everything besides the line colors\n\n| Original plot | After `dvu.invert_plot()` |\n| ---------------------------------------------- | --------------------------------------------------- |\n|  |  |\n\n\n\n# Reference\n\n- for updates, star the repo or follow [@csinva_](https://twitter.com/csinva_)\n- super-related and wonderful [matplotlib-label-lines](https://github.com/cphyc/matplotlib-label-lines) project\n- [PR](https://t.co/lTe19vdETE?amp=1) for implementing line-labeling into matplotlib\n- feel free to use openly!\n- built with jekyll + github pages\n- theme from [here](https://github.com/inded/Jekyll_modern-blog)\n - based off of this [article from Codrops](http://tympanus.net/codrops/?p=24222)\n",
"bugtrack_url": null,
"license": "",
"summary": "Functions for data visualization in matplotlib.",
"version": "0.0.2",
"project_urls": {
"Homepage": "https://github.com/csinva/data-viz-utils"
},
"split_keywords": [],
"urls": [
{
"comment_text": "",
"digests": {
"blake2b_256": "d8a8f944df96fad838116db503c54a950e58a4cd37e6f80583c30fe4e10bae9c",
"md5": "e356db695ac45a41aa5ec525d9dc82b5",
"sha256": "ce8ba1b995ffafcfeebbdc1bb0f9474d8cdece7df2f6545a522f1cc6f5c97a0a"
},
"downloads": -1,
"filename": "dvu-0.0.2-py3-none-any.whl",
"has_sig": false,
"md5_digest": "e356db695ac45a41aa5ec525d9dc82b5",
"packagetype": "bdist_wheel",
"python_version": "py3",
"requires_python": ">=3.6",
"size": 7471,
"upload_time": "2024-01-18T02:50:01",
"upload_time_iso_8601": "2024-01-18T02:50:01.594544Z",
"url": "https://files.pythonhosted.org/packages/d8/a8/f944df96fad838116db503c54a950e58a4cd37e6f80583c30fe4e10bae9c/dvu-0.0.2-py3-none-any.whl",
"yanked": false,
"yanked_reason": null
},
{
"comment_text": "",
"digests": {
"blake2b_256": "0570af379b76dc2981b654e7bcd089a22a6e7d5cfc0ea3376fb80fbb1eb69bb2",
"md5": "727f6a5854de844f74aca3f44fdf6e8b",
"sha256": "29e06939030e916974bba9f6c4b66ed35bf1b572f109837492f0540f7189ffd5"
},
"downloads": -1,
"filename": "dvu-0.0.2.tar.gz",
"has_sig": false,
"md5_digest": "727f6a5854de844f74aca3f44fdf6e8b",
"packagetype": "sdist",
"python_version": "source",
"requires_python": ">=3.6",
"size": 7347,
"upload_time": "2024-01-18T02:50:03",
"upload_time_iso_8601": "2024-01-18T02:50:03.302908Z",
"url": "https://files.pythonhosted.org/packages/05/70/af379b76dc2981b654e7bcd089a22a6e7d5cfc0ea3376fb80fbb1eb69bb2/dvu-0.0.2.tar.gz",
"yanked": false,
"yanked_reason": null
}
],
"upload_time": "2024-01-18 02:50:03",
"github": true,
"gitlab": false,
"bitbucket": false,
"codeberg": false,
"github_user": "csinva",
"github_project": "data-viz-utils",
"travis_ci": false,
"coveralls": false,
"github_actions": false,
"lcname": "dvu"
}

