| Name | excelify-lib JSON |
| Version |
0.1.0
 JSON
JSON |
| download |
| home_page | None |
| Summary | Create Excel spreadsheets with formulas using a DataFrame-like API |
| upload_time | 2025-07-20 19:32:45 |
| maintainer | None |
| docs_url | None |
| author | None |
| requires_python | >=3.10 |
| license | None |
| keywords |
dataframe
excel
formulas
spreadsheet
xlsx
|
| VCS |
 |
| bugtrack_url |
|
| requirements |
No requirements were recorded.
|
| Travis-CI |
No Travis.
|
| coveralls test coverage |
No coveralls.
|
## Excelify: Create Excel spreadsheets using DataFrame-like API
[](https://github.com/yjhan96/excelify/actions/workflows/python-test.yml)
Excelify is a DataFrame-like library that lets users create Excel spreadsheets.
To learn more, read Getting Started. TODO: Add a link.
## Demo
[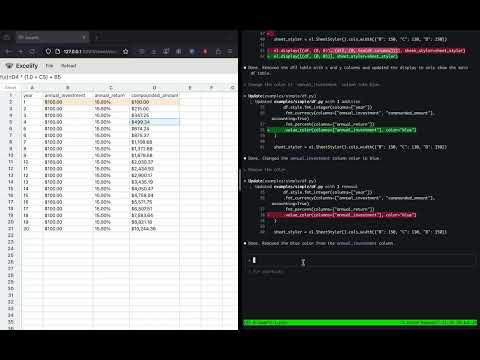](https://www.youtube.com/watch?v=pVCHnAjNIsQ)
(Click the image above to go to a demo video.)
## Example
We'll create a table that demonstrates compounded interest.
We first define an "emtpy table" using `el.ExcelFrame`:
```python
import excelify as el
df = el.ExcelFrame.empty(
columns=["year", "boy_amount", "annual_return", "eoy_amount"],
height=3,
)
```
Printing `df` will show the following:
```pycon
>>> df
shape: (3, 4)
+---+----------+----------------+-------------------+----------------+
| | year (A) | boy_amount (B) | annual_return (C) | eoy_amount (D) |
+---+----------+----------------+-------------------+----------------+
| 1 | | | | |
| 2 | | | | |
| 3 | | | | |
+---+----------+----------------+-------------------+----------------+
```
The letters A, B, C, D,... in each column after the column name represents
the column index, similar to Excel.
Excelify has a Polars-like API that lets you define the formula for all the
cells in a given column. For example, we can define static integer value
representing the number of years elapsed using `el.lit()`:
```python
df = df.with_columns(
el.lit([i for i in range(3)]).alias("year"),
)
```
However, unlike DataFrame, you can define a formula that'll be evaluated
lazily, just like Excel spreadsheets.
For example, suppose you'd like to define annual return to be 10% every year.
You can either use above `el.lit` function, or you can define a static value on
the first row cell and make subsequent rows refer to the previous row's value
using `el.map` and `el.col().prev(1)`:
```python
def annual_return_formula(idx: int):
if idx == 0:
return 0.10
else:
return el.col("annual_return").prev(1)
df = df.with_columns(
el.map(annual_return_formula).alias("annual_return")
)
```
This way, you can edit only the first row cell of `annual_return` to change the
annual return value for all the years.
Similarly, you can define the amount of money in the beginning and end of the
year as follows:
```python
df = df.with_columns(
el.map(
# You can also use lambda expression to make it more concise.
lambda idx: 100.0
if idx == 0
else el.col("eoy_amount").prev(1)
).alias("boy_amount"),
(el.col("boy_amount") * (1.0 + el.col("annual_return"))).alias("eoy_amount"),
)
```
If you print `df`, you'll get the following:
```pycon
>>> print(df)
shape: (3, 4)
+---+----------+----------------+-------------------+-------------------+
| | year (A) | boy_amount (B) | annual_return (C) | eoy_amount (D) |
+---+----------+----------------+-------------------+-------------------+
| 1 | 0.00 | 100.00 | 0.10 | (B1 * (1.0 + C1)) |
| 2 | 1.00 | D1 | C1 | (B2 * (1.0 + C2)) |
| 3 | 2.00 | D2 | C2 | (B3 * (1.0 + C3)) |
+---+----------+----------------+-------------------+-------------------+
```
Unlike DataFrame, ExcelFrame stores the formula of the cell by default. To see
numerical values, you can call `df.evaluate()` - it'll return a new ExcelFrame
where each cell will store the computed value of the formula in `df`:
```pycon
>>> print(df.evaluate())
shape: (3, 4)
+---+----------+----------------+-------------------+----------------+
| | year (A) | boy_amount (B) | annual_return (C) | eoy_amount (D) |
+---+----------+----------------+-------------------+----------------+
| 1 | 0.00 | 100.00 | 0.10 | 110.00 |
| 2 | 1.00 | 110.00 | 0.10 | 121.00 |
| 3 | 2.00 | 121.00 | 0.10 | 133.10 |
+---+----------+----------------+-------------------+----------------+
```
To export the ExcelFrame to excel, simply call `df.to_excel()`.
## Excelify-Viewer
To run excelify-viewer locally, you can run
```bash
excelify-viewer --file-path $FILE_NAME
```
where `FILE_NAME` points to the python script that constructs the table.
The script must end with `excelify.display`. See files in `examples/` directory
to see sample scripts.
Raw data
{
"_id": null,
"home_page": null,
"name": "excelify-lib",
"maintainer": null,
"docs_url": null,
"requires_python": ">=3.10",
"maintainer_email": null,
"keywords": "dataframe, excel, formulas, spreadsheet, xlsx",
"author": null,
"author_email": "Albert Han <yjhan96@gmail.com>",
"download_url": "https://files.pythonhosted.org/packages/16/6a/65f12bc8a43259c4cae673027b8e4fc2b5628b3a136f77bf7694c03ec3fd/excelify_lib-0.1.0.tar.gz",
"platform": null,
"description": "## Excelify: Create Excel spreadsheets using DataFrame-like API\n\n[](https://github.com/yjhan96/excelify/actions/workflows/python-test.yml)\n\nExcelify is a DataFrame-like library that lets users create Excel spreadsheets.\n\nTo learn more, read Getting Started. TODO: Add a link.\n\n## Demo\n[](https://www.youtube.com/watch?v=pVCHnAjNIsQ)\n\n(Click the image above to go to a demo video.)\n\n## Example\nWe'll create a table that demonstrates compounded interest.\nWe first define an \"emtpy table\" using `el.ExcelFrame`:\n```python\nimport excelify as el\ndf = el.ExcelFrame.empty(\n columns=[\"year\", \"boy_amount\", \"annual_return\", \"eoy_amount\"],\n height=3,\n)\n```\nPrinting `df` will show the following:\n```pycon\n>>> df\nshape: (3, 4)\n+---+----------+----------------+-------------------+----------------+\n| | year (A) | boy_amount (B) | annual_return (C) | eoy_amount (D) |\n+---+----------+----------------+-------------------+----------------+\n| 1 | | | | |\n| 2 | | | | |\n| 3 | | | | |\n+---+----------+----------------+-------------------+----------------+\n```\n\nThe letters A, B, C, D,... in each column after the column name represents\nthe column index, similar to Excel.\n\nExcelify has a Polars-like API that lets you define the formula for all the\ncells in a given column. For example, we can define static integer value\nrepresenting the number of years elapsed using `el.lit()`:\n\n```python\ndf = df.with_columns(\n el.lit([i for i in range(3)]).alias(\"year\"),\n)\n```\n\nHowever, unlike DataFrame, you can define a formula that'll be evaluated\nlazily, just like Excel spreadsheets.\n\nFor example, suppose you'd like to define annual return to be 10% every year.\nYou can either use above `el.lit` function, or you can define a static value on\nthe first row cell and make subsequent rows refer to the previous row's value\nusing `el.map` and `el.col().prev(1)`:\n\n```python\ndef annual_return_formula(idx: int):\n if idx == 0:\n return 0.10\n else:\n return el.col(\"annual_return\").prev(1)\n\ndf = df.with_columns(\n el.map(annual_return_formula).alias(\"annual_return\")\n)\n```\nThis way, you can edit only the first row cell of `annual_return` to change the\nannual return value for all the years.\n\nSimilarly, you can define the amount of money in the beginning and end of the\nyear as follows:\n\n```python\ndf = df.with_columns(\n el.map(\n # You can also use lambda expression to make it more concise.\n lambda idx: 100.0\n if idx == 0\n else el.col(\"eoy_amount\").prev(1)\n ).alias(\"boy_amount\"),\n (el.col(\"boy_amount\") * (1.0 + el.col(\"annual_return\"))).alias(\"eoy_amount\"),\n)\n```\n\nIf you print `df`, you'll get the following:\n```pycon\n>>> print(df)\nshape: (3, 4)\n+---+----------+----------------+-------------------+-------------------+\n| | year (A) | boy_amount (B) | annual_return (C) | eoy_amount (D) |\n+---+----------+----------------+-------------------+-------------------+\n| 1 | 0.00 | 100.00 | 0.10 | (B1 * (1.0 + C1)) |\n| 2 | 1.00 | D1 | C1 | (B2 * (1.0 + C2)) |\n| 3 | 2.00 | D2 | C2 | (B3 * (1.0 + C3)) |\n+---+----------+----------------+-------------------+-------------------+\n```\n\nUnlike DataFrame, ExcelFrame stores the formula of the cell by default. To see\nnumerical values, you can call `df.evaluate()` - it'll return a new ExcelFrame\nwhere each cell will store the computed value of the formula in `df`:\n\n```pycon\n>>> print(df.evaluate())\nshape: (3, 4)\n+---+----------+----------------+-------------------+----------------+\n| | year (A) | boy_amount (B) | annual_return (C) | eoy_amount (D) |\n+---+----------+----------------+-------------------+----------------+\n| 1 | 0.00 | 100.00 | 0.10 | 110.00 |\n| 2 | 1.00 | 110.00 | 0.10 | 121.00 |\n| 3 | 2.00 | 121.00 | 0.10 | 133.10 |\n+---+----------+----------------+-------------------+----------------+\n```\n\nTo export the ExcelFrame to excel, simply call `df.to_excel()`.\n\n## Excelify-Viewer\n\nTo run excelify-viewer locally, you can run\n```bash\nexcelify-viewer --file-path $FILE_NAME\n```\nwhere `FILE_NAME` points to the python script that constructs the table.\nThe script must end with `excelify.display`. See files in `examples/` directory\nto see sample scripts.\n",
"bugtrack_url": null,
"license": null,
"summary": "Create Excel spreadsheets with formulas using a DataFrame-like API",
"version": "0.1.0",
"project_urls": {
"Homepage": "https://github.com/yjhan96/excelify",
"Issues": "https://github.com/yjhan96/excelify/issues"
},
"split_keywords": [
"dataframe",
" excel",
" formulas",
" spreadsheet",
" xlsx"
],
"urls": [
{
"comment_text": null,
"digests": {
"blake2b_256": "ee6d5a5a3492a3ec7fb49ce1aa91018a95916eeaaf8176cad6c64f51a3e7bd2c",
"md5": "dca8e5a6769cf817723c3d0bd023b9d1",
"sha256": "faf9aa1047be918334e12acefa98d9ce6b348cd8736a95be20b67f60784de009"
},
"downloads": -1,
"filename": "excelify_lib-0.1.0-py3-none-any.whl",
"has_sig": false,
"md5_digest": "dca8e5a6769cf817723c3d0bd023b9d1",
"packagetype": "bdist_wheel",
"python_version": "py3",
"requires_python": ">=3.10",
"size": 137855,
"upload_time": "2025-07-20T19:32:37",
"upload_time_iso_8601": "2025-07-20T19:32:37.929052Z",
"url": "https://files.pythonhosted.org/packages/ee/6d/5a5a3492a3ec7fb49ce1aa91018a95916eeaaf8176cad6c64f51a3e7bd2c/excelify_lib-0.1.0-py3-none-any.whl",
"yanked": false,
"yanked_reason": null
},
{
"comment_text": null,
"digests": {
"blake2b_256": "166a65f12bc8a43259c4cae673027b8e4fc2b5628b3a136f77bf7694c03ec3fd",
"md5": "610b945ba1cd5938f841f30ad24274ac",
"sha256": "0a66ba9706f804a0c9bacaf72ed0767ddeb02e62977d4041c6963f814c825674"
},
"downloads": -1,
"filename": "excelify_lib-0.1.0.tar.gz",
"has_sig": false,
"md5_digest": "610b945ba1cd5938f841f30ad24274ac",
"packagetype": "sdist",
"python_version": "source",
"requires_python": ">=3.10",
"size": 22415494,
"upload_time": "2025-07-20T19:32:45",
"upload_time_iso_8601": "2025-07-20T19:32:45.394892Z",
"url": "https://files.pythonhosted.org/packages/16/6a/65f12bc8a43259c4cae673027b8e4fc2b5628b3a136f77bf7694c03ec3fd/excelify_lib-0.1.0.tar.gz",
"yanked": false,
"yanked_reason": null
}
],
"upload_time": "2025-07-20 19:32:45",
"github": true,
"gitlab": false,
"bitbucket": false,
"codeberg": false,
"github_user": "yjhan96",
"github_project": "excelify",
"travis_ci": false,
"coveralls": false,
"github_actions": true,
"lcname": "excelify-lib"
}
