| Name | gcode2dplotterart JSON |
| Version |
2.0.3
 JSON
JSON |
| download |
| home_page | None |
| Summary | A Python library for creating 2D plotter art using GCode |
| upload_time | 2025-02-04 03:59:21 |
| maintainer | None |
| docs_url | None |
| author | Travis Bumgarner |
| requires_python | >=3.8 |
| license | None |
| keywords |
|
| VCS |
|
| bugtrack_url |
|
| requirements |
No requirements were recorded.
|
| Travis-CI |
No Travis.
|
| coveralls test coverage |
No coveralls.
|


# Introduction
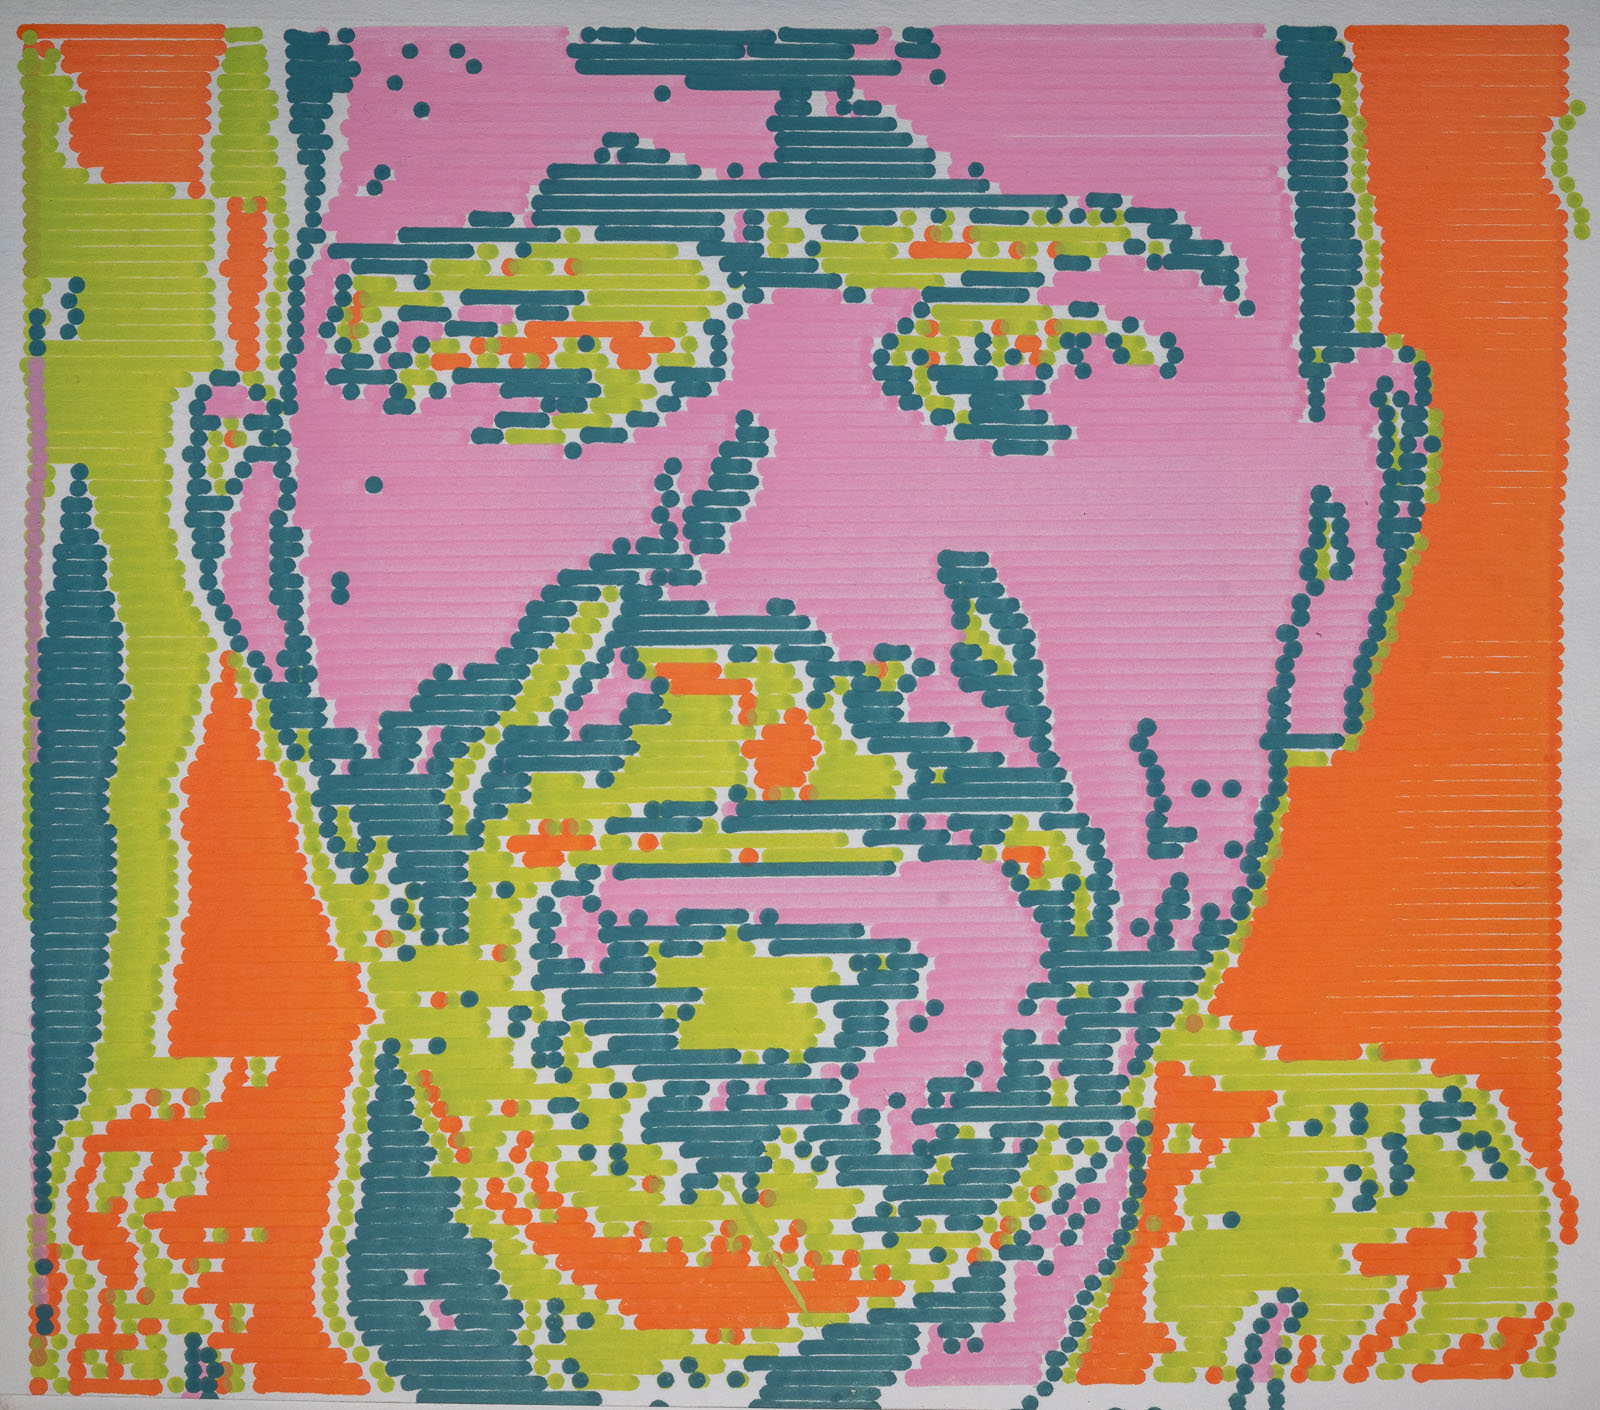
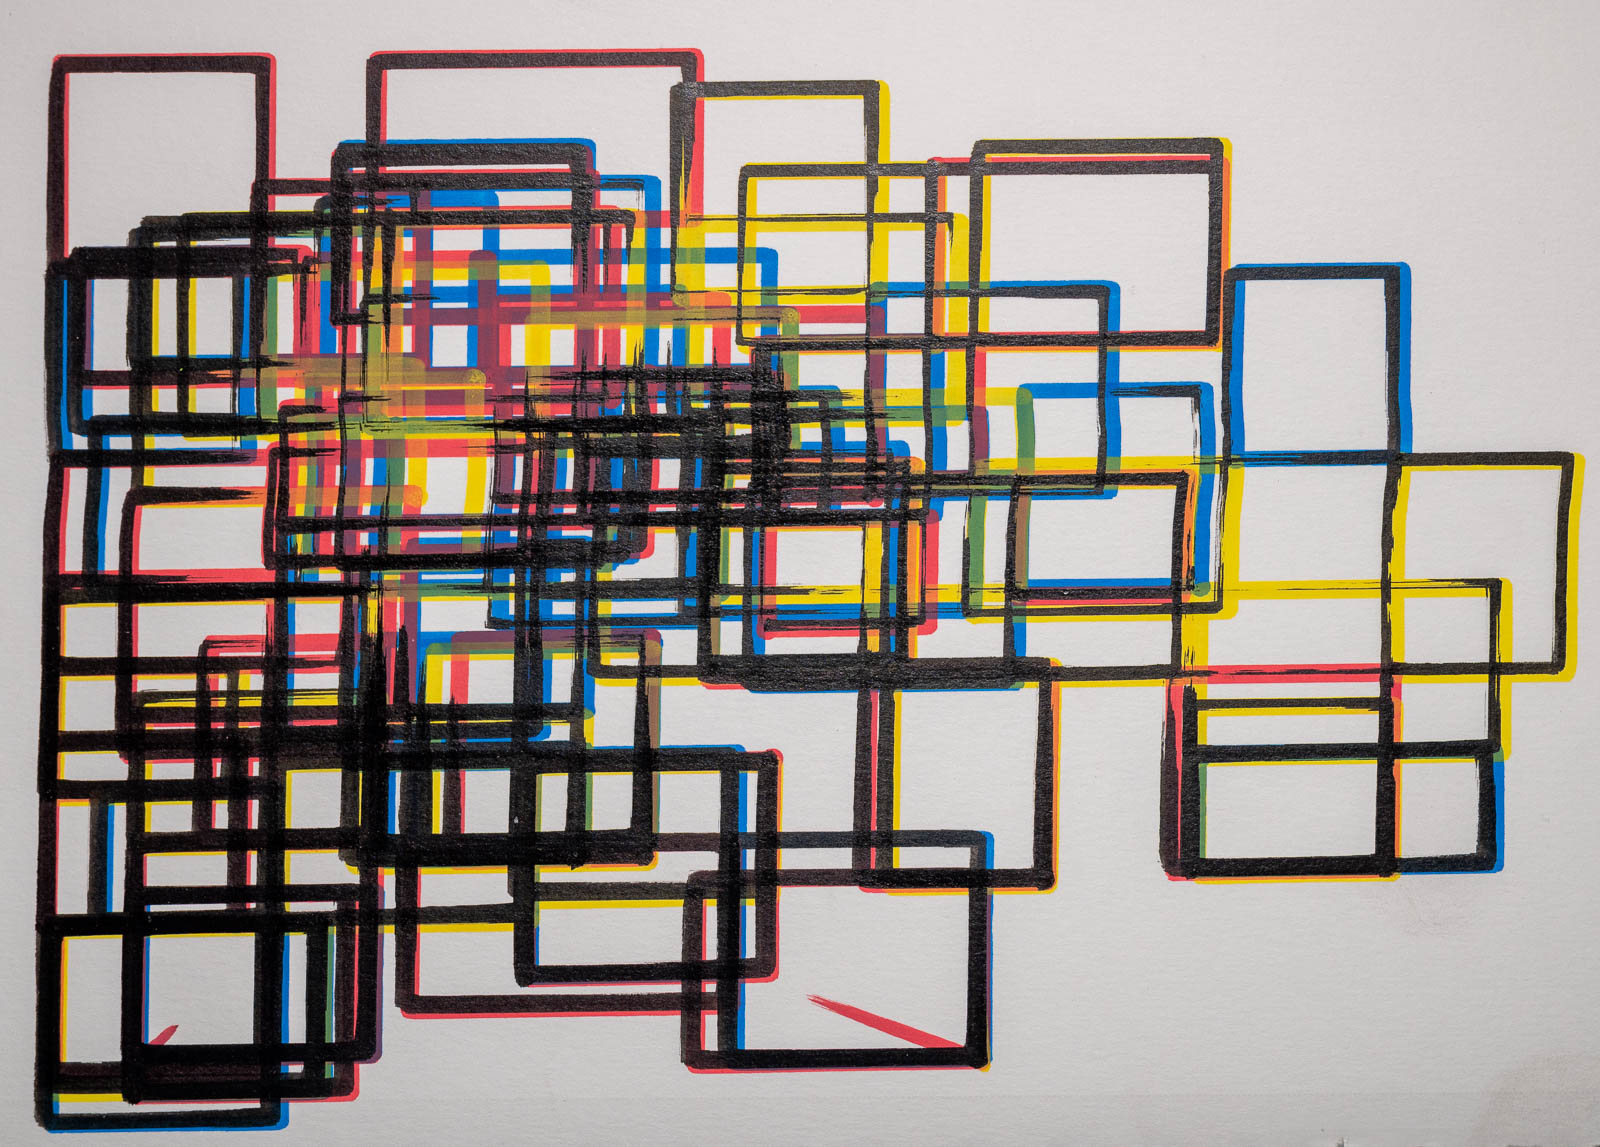
[G-Code](https://marlinfw.org/meta/gcode/) wrapper to generate G-Code for 2D plotter art. Add paths, points, lines, circles, and more and get G-Code instructions to send to your 2D Plotter or [converted 3D Printer](https://travisbumgarner.github.io/gcode2dplotterart/docs/documentation/convert-3d-to-2d).
Here are a few examples of what's been made with this library.
# Quick Start
Below is a quick start example to get you up and running. For a quick start, gallery, and documentation, . [check out the website](https://travisbumgarner.github.io/gcode2dplotterart/).
```python
from gcode2dplotterart import Plotter2D # Change to `Plotter3D` if using a converted 3D printer.
plotter = Plotter2D(
# Specify the dimensions of your plotter
x_min=0,
x_max=200,
y_min=0,
y_max=200,
feed_rate=10000,
# G-Code files are located in `output_directory/title/layer.gcode`
title="Plotter2D Quickstart",
output_directory="./output",
# Give a warning if a plotted point is outside the plotting device's dimensions.
handle_out_of_bounds="Warning",
)
# Setup a layer per plotting instrument used
black_pen_layer = "black_pen_layer"
blue_marker_layer = "blue_marker_layer"
green_marker_layer = "green_marker_layer"
# Create the layers
plotter.add_layer(black_pen_layer, color="black", line_width=1.0)
plotter.add_layer(blue_marker_layer, color="blue", line_width=4.0)
plotter.add_layer(green_marker_layer, color="#027F00", line_width=4.0)
# Add some dots, lines, shapes, and paths.
plotter.layers[black_pen_layer].add_rectangle(
x_start=10, y_start=15, x_end=40, y_end=50
)
plotter.layers[black_pen_layer].add_point(x=30, y=40)
plotter.layers[blue_marker_layer].add_circle(x_center=10, y_center=30, radius=10)
plotter.layers[blue_marker_layer].add_rectangle(x_start=50, y_start=50, x_end=75, y_end=75)
plotter.layers[green_marker_layer].add_path([(10, 10), (20, 25), (30, 15), (1, 100)])
plotter.layers[green_marker_layer].add_line(x_start=70, y_start=80, x_end=70, y_end=15)
# Generate a graphical preview to get a rough idea of what will be plotted.
plotter.preview()
# Output creation to G-Code files to be used in plotting.
plotter.save()
```
# Changelog
[View the changelog](https://travisbumgarner.github.io/gcode2dplotterart/docs/releases)
Raw data
{
"_id": null,
"home_page": null,
"name": "gcode2dplotterart",
"maintainer": null,
"docs_url": null,
"requires_python": ">=3.8",
"maintainer_email": null,
"keywords": null,
"author": "Travis Bumgarner",
"author_email": null,
"download_url": "https://files.pythonhosted.org/packages/fa/fb/55896f6ca23ec66630e3b7c27ea31c8b753f3f1a5df02538ddacc480a704/gcode2dplotterart-2.0.3.tar.gz",
"platform": null,
"description": "\n\n\n\n\n# Introduction\n\n[G-Code](https://marlinfw.org/meta/gcode/) wrapper to generate G-Code for 2D plotter art. Add paths, points, lines, circles, and more and get G-Code instructions to send to your 2D Plotter or [converted 3D Printer](https://travisbumgarner.github.io/gcode2dplotterart/docs/documentation/convert-3d-to-2d).\n\nHere are a few examples of what's been made with this library.\n\n\n\n\n\n\n# Quick Start\n\nBelow is a quick start example to get you up and running. For a quick start, gallery, and documentation, . [check out the website](https://travisbumgarner.github.io/gcode2dplotterart/).\n\n```python\n\nfrom gcode2dplotterart import Plotter2D # Change to `Plotter3D` if using a converted 3D printer.\n\nplotter = Plotter2D(\n # Specify the dimensions of your plotter\n x_min=0,\n x_max=200,\n y_min=0,\n y_max=200,\n feed_rate=10000,\n # G-Code files are located in `output_directory/title/layer.gcode`\n title=\"Plotter2D Quickstart\",\n output_directory=\"./output\",\n # Give a warning if a plotted point is outside the plotting device's dimensions.\n handle_out_of_bounds=\"Warning\",\n)\n\n# Setup a layer per plotting instrument used\nblack_pen_layer = \"black_pen_layer\"\nblue_marker_layer = \"blue_marker_layer\"\ngreen_marker_layer = \"green_marker_layer\"\n\n# Create the layers\nplotter.add_layer(black_pen_layer, color=\"black\", line_width=1.0)\nplotter.add_layer(blue_marker_layer, color=\"blue\", line_width=4.0)\nplotter.add_layer(green_marker_layer, color=\"#027F00\", line_width=4.0)\n\n# Add some dots, lines, shapes, and paths.\nplotter.layers[black_pen_layer].add_rectangle(\n x_start=10, y_start=15, x_end=40, y_end=50\n)\nplotter.layers[black_pen_layer].add_point(x=30, y=40)\nplotter.layers[blue_marker_layer].add_circle(x_center=10, y_center=30, radius=10)\nplotter.layers[blue_marker_layer].add_rectangle(x_start=50, y_start=50, x_end=75, y_end=75)\nplotter.layers[green_marker_layer].add_path([(10, 10), (20, 25), (30, 15), (1, 100)])\nplotter.layers[green_marker_layer].add_line(x_start=70, y_start=80, x_end=70, y_end=15)\n\n# Generate a graphical preview to get a rough idea of what will be plotted.\nplotter.preview()\n\n# Output creation to G-Code files to be used in plotting.\nplotter.save()\n```\n\n# Changelog\n\n[View the changelog](https://travisbumgarner.github.io/gcode2dplotterart/docs/releases)",
"bugtrack_url": null,
"license": null,
"summary": "A Python library for creating 2D plotter art using GCode",
"version": "2.0.3",
"project_urls": null,
"split_keywords": [],
"urls": [
{
"comment_text": null,
"digests": {
"blake2b_256": "560f4e0dc2de8c67753c0dcbd24937509ae96096ad9e8e638e9cedd9120dd1ae",
"md5": "96f5efe0a664fe5371228fc1bf39f509",
"sha256": "27b7572ce633422f26fc6cc2f95b1213dc8154684d00c723c025e682db1b9942"
},
"downloads": -1,
"filename": "gcode2dplotterart-2.0.3-py3-none-any.whl",
"has_sig": false,
"md5_digest": "96f5efe0a664fe5371228fc1bf39f509",
"packagetype": "bdist_wheel",
"python_version": "py3",
"requires_python": ">=3.8",
"size": 25194,
"upload_time": "2025-02-04T03:59:17",
"upload_time_iso_8601": "2025-02-04T03:59:17.749086Z",
"url": "https://files.pythonhosted.org/packages/56/0f/4e0dc2de8c67753c0dcbd24937509ae96096ad9e8e638e9cedd9120dd1ae/gcode2dplotterart-2.0.3-py3-none-any.whl",
"yanked": false,
"yanked_reason": null
},
{
"comment_text": null,
"digests": {
"blake2b_256": "fafb55896f6ca23ec66630e3b7c27ea31c8b753f3f1a5df02538ddacc480a704",
"md5": "0d106510b91ddd29e111c5b2b9e367e6",
"sha256": "34cc6884218778564e9298a4247bf88d6c82813757e803846ac88dda7985404a"
},
"downloads": -1,
"filename": "gcode2dplotterart-2.0.3.tar.gz",
"has_sig": false,
"md5_digest": "0d106510b91ddd29e111c5b2b9e367e6",
"packagetype": "sdist",
"python_version": "source",
"requires_python": ">=3.8",
"size": 16332,
"upload_time": "2025-02-04T03:59:21",
"upload_time_iso_8601": "2025-02-04T03:59:21.170022Z",
"url": "https://files.pythonhosted.org/packages/fa/fb/55896f6ca23ec66630e3b7c27ea31c8b753f3f1a5df02538ddacc480a704/gcode2dplotterart-2.0.3.tar.gz",
"yanked": false,
"yanked_reason": null
}
],
"upload_time": "2025-02-04 03:59:21",
"github": false,
"gitlab": false,
"bitbucket": false,
"codeberg": false,
"lcname": "gcode2dplotterart"
}
