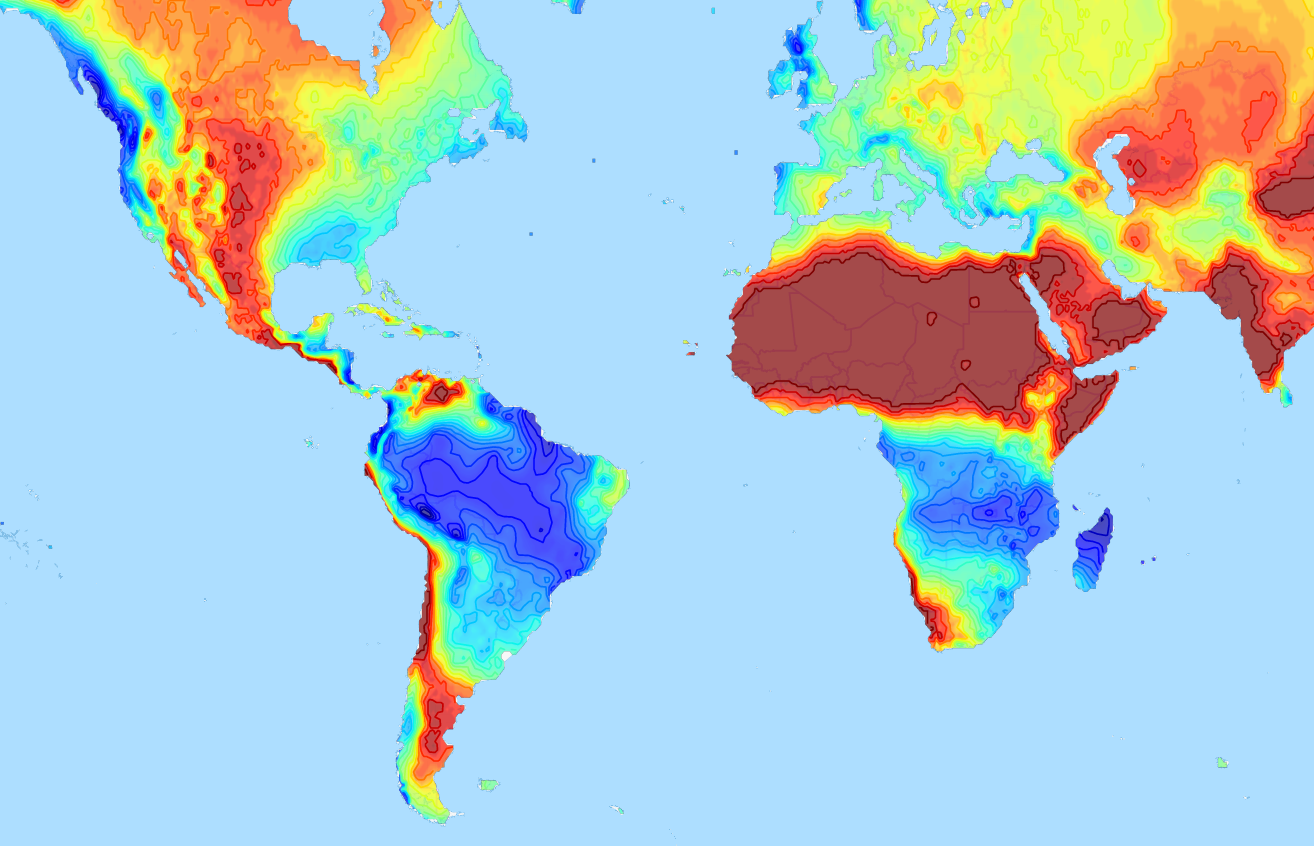
# geojsoncontour
[](https://github.com/bartromgens/geojsoncontour/actions?query=branch%3Amaster) [](https://badge.fury.io/py/geojsoncontour) [](https://coveralls.io/github/bartromgens/geojsoncontour?branch=master)
A Python 3 module to convert matplotlib contour plots to geojson. Supports both contour and contourf plots.
Designed to show geographical [contour plots](http://matplotlib.org/examples/pylab_examples/contour_demo.html),
created with [matplotlib/pyplot](https://github.com/matplotlib/matplotlib), as vector layer on interactive slippy maps like [OpenLayers](https://github.com/openlayers/ol3) and [Leaflet](https://github.com/Leaflet/Leaflet).
Demo project that uses geojsoncontour: [climatemaps.romgens.com](http://climatemaps.romgens.com)

## Installation
Install with pip,
```
pip install geojsoncontour
```
## Usage
Use `contour_to_geojson` to create a geojson with contour lines from a `matplotlib.contour` plot (not filled).
Use `contourf_to_geojson` to create a geojson with filled contours from a `matplotlib.contourf` plot.
### Contour plot to geojson
```python
import numpy
import matplotlib.pyplot as plt
import geojsoncontour
# Create contour data lon_range, lat_range, Z
<your code here>
# Create a contour plot plot from grid (lat, lon) data
figure = plt.figure()
ax = figure.add_subplot(111)
contour = ax.contour(lon_range, lat_range, Z, cmap=plt.cm.jet)
# Convert matplotlib contour to geojson
geojson = geojsoncontour.contour_to_geojson(
contour=contour,
ndigits=3,
unit='m'
)
```
For filled contour plots (`matplotlib.contourf`) use `contourf_to_geojson`.
See [example_contour.py](examples/example_contour.py) and [example_contourf.py](examples/example_contourf.py) for simple but complete examples.
### Show the geojson on a map
An easy way to show the generated geojson on a map is the online geojson renderer [geojson.io](http://geojson.io) or [geojson.tools](http://geojson.tools).
### Style properties
Stroke color and width are set as geojson properties following https://github.com/mapbox/simplestyle-spec.
### Create geojson tiles
Try [geojson-vt](https://github.com/mapbox/geojson-vt) or [tippecanoe](https://github.com/mapbox/tippecanoe) if performance is an issue and you need to tile your geojson contours.
## Development
### Tests
Run all tests,
```
python -m unittest discover
```
### Release
Install setuptools, wheel and twine:
```
python -m pip install --upgrade setuptools wheel twine
```
Increase the version number in `setup.py`.
Create dist:
```
python setup.py sdist bdist_wheel
```
Upload:
```
twine upload dist/*
```
Raw data
{
"_id": null,
"home_page": "http://github.com/bartromgens/geojsoncontour",
"name": "geojsoncontour",
"maintainer": null,
"docs_url": null,
"requires_python": null,
"maintainer_email": null,
"keywords": "contour plot geojson pyplot matplotlib gis map",
"author": "Bart R\u00f6mgens",
"author_email": "bart.romgens@gmail.com",
"download_url": "https://files.pythonhosted.org/packages/59/38/77065f343a80e716914ac916bf1c07c31115719bc66a15f806ede8443471/geojsoncontour-0.5.1.tar.gz",
"platform": null,
"description": "# geojsoncontour\n[](https://github.com/bartromgens/geojsoncontour/actions?query=branch%3Amaster) [](https://badge.fury.io/py/geojsoncontour) [](https://coveralls.io/github/bartromgens/geojsoncontour?branch=master) \nA Python 3 module to convert matplotlib contour plots to geojson. Supports both contour and contourf plots.\n\nDesigned to show geographical [contour plots](http://matplotlib.org/examples/pylab_examples/contour_demo.html), \ncreated with [matplotlib/pyplot](https://github.com/matplotlib/matplotlib), as vector layer on interactive slippy maps like [OpenLayers](https://github.com/openlayers/ol3) and [Leaflet](https://github.com/Leaflet/Leaflet).\n\nDemo project that uses geojsoncontour: [climatemaps.romgens.com](http://climatemaps.romgens.com)\n\n\n\n## Installation\nInstall with pip,\n```\npip install geojsoncontour\n```\n\n## Usage\n\nUse `contour_to_geojson` to create a geojson with contour lines from a `matplotlib.contour` plot (not filled).\nUse `contourf_to_geojson` to create a geojson with filled contours from a `matplotlib.contourf` plot.\n\n### Contour plot to geojson\n```python\nimport numpy\nimport matplotlib.pyplot as plt\nimport geojsoncontour\n\n# Create contour data lon_range, lat_range, Z\n<your code here>\n\n# Create a contour plot plot from grid (lat, lon) data\nfigure = plt.figure()\nax = figure.add_subplot(111)\ncontour = ax.contour(lon_range, lat_range, Z, cmap=plt.cm.jet)\n\n# Convert matplotlib contour to geojson\ngeojson = geojsoncontour.contour_to_geojson(\n contour=contour,\n ndigits=3,\n unit='m'\n)\n```\nFor filled contour plots (`matplotlib.contourf`) use `contourf_to_geojson`.\nSee [example_contour.py](examples/example_contour.py) and [example_contourf.py](examples/example_contourf.py) for simple but complete examples.\n\n### Show the geojson on a map\nAn easy way to show the generated geojson on a map is the online geojson renderer [geojson.io](http://geojson.io) or [geojson.tools](http://geojson.tools).\n\n### Style properties\nStroke color and width are set as geojson properties following https://github.com/mapbox/simplestyle-spec.\n\n### Create geojson tiles\nTry [geojson-vt](https://github.com/mapbox/geojson-vt) or [tippecanoe](https://github.com/mapbox/tippecanoe) if performance is an issue and you need to tile your geojson contours.\n\n\n## Development\n\n### Tests\n\nRun all tests,\n```\npython -m unittest discover\n```\n\n### Release\n\nInstall setuptools, wheel and twine:\n```\npython -m pip install --upgrade setuptools wheel twine\n```\n\nIncrease the version number in `setup.py`.\n\nCreate dist:\n```\npython setup.py sdist bdist_wheel\n```\n\nUpload:\n```\ntwine upload dist/*\n```\n",
"bugtrack_url": null,
"license": "MIT",
"summary": "Convert matplotlib contour plots to geojson",
"version": "0.5.1",
"project_urls": {
"Homepage": "http://github.com/bartromgens/geojsoncontour"
},
"split_keywords": [
"contour",
"plot",
"geojson",
"pyplot",
"matplotlib",
"gis",
"map"
],
"urls": [
{
"comment_text": "",
"digests": {
"blake2b_256": "edae5fbf6ad7a576bdeea04d5fe8cd1258e4df779a388af00860f6f2e550c1c6",
"md5": "981c687591ca4a2953181268024cc6aa",
"sha256": "6b0e38cc3099958d26547a315efd24683a4dbf03ce407d41da10485f3a973b33"
},
"downloads": -1,
"filename": "geojsoncontour-0.5.1-py3-none-any.whl",
"has_sig": false,
"md5_digest": "981c687591ca4a2953181268024cc6aa",
"packagetype": "bdist_wheel",
"python_version": "py3",
"requires_python": null,
"size": 8592,
"upload_time": "2025-01-13T12:59:46",
"upload_time_iso_8601": "2025-01-13T12:59:46.383121Z",
"url": "https://files.pythonhosted.org/packages/ed/ae/5fbf6ad7a576bdeea04d5fe8cd1258e4df779a388af00860f6f2e550c1c6/geojsoncontour-0.5.1-py3-none-any.whl",
"yanked": false,
"yanked_reason": null
},
{
"comment_text": "",
"digests": {
"blake2b_256": "593877065f343a80e716914ac916bf1c07c31115719bc66a15f806ede8443471",
"md5": "658560cf99c8597b424862baca5914c9",
"sha256": "6a6684fe018e415c426912dba524a5833cb59972b768e980245c5605dd5872d6"
},
"downloads": -1,
"filename": "geojsoncontour-0.5.1.tar.gz",
"has_sig": false,
"md5_digest": "658560cf99c8597b424862baca5914c9",
"packagetype": "sdist",
"python_version": "source",
"requires_python": null,
"size": 9925,
"upload_time": "2025-01-13T12:59:47",
"upload_time_iso_8601": "2025-01-13T12:59:47.773915Z",
"url": "https://files.pythonhosted.org/packages/59/38/77065f343a80e716914ac916bf1c07c31115719bc66a15f806ede8443471/geojsoncontour-0.5.1.tar.gz",
"yanked": false,
"yanked_reason": null
}
],
"upload_time": "2025-01-13 12:59:47",
"github": true,
"gitlab": false,
"bitbucket": false,
"codeberg": false,
"github_user": "bartromgens",
"github_project": "geojsoncontour",
"travis_ci": false,
"coveralls": true,
"github_actions": true,
"lcname": "geojsoncontour"
}

