| Name | grafmon JSON |
| Version |
1.1.1
 JSON
JSON |
| download |
| home_page | None |
| Summary | Monitor metrics in a real-time time-series line-graph (a-la perfmon.exe) |
| upload_time | 2024-12-25 10:29:15 |
| maintainer | None |
| docs_url | None |
| author | None |
| requires_python | >=3.7 |
| license | Copyright (c) 2024-2025 Pragmatic Software <pragma78@gmail.com> Permission is hereby granted, free of charge, to any person obtaining a copy of this software and associated documentation files (the "Software"), to deal in the Software without restriction, including without limitation the rights to use, copy, modify, merge, publish, distribute, sublicense, and/or sell copies of the Software, and to permit persons to whom the Software is furnished to do so, subject to the following conditions: The above copyright notice and this permission notice shall be included in all copies or substantial portions of the Software. THE SOFTWARE IS PROVIDED "AS IS", WITHOUT WARRANTY OF ANY KIND, EXPRESS OR IMPLIED, INCLUDING BUT NOT LIMITED TO THE WARRANTIES OF MERCHANTABILITY, FITNESS FOR A PARTICULAR PURPOSE AND NONINFRINGEMENT. IN NO EVENT SHALL THE AUTHORS OR COPYRIGHT HOLDERS BE LIABLE FOR ANY CLAIM, DAMAGES OR OTHER LIABILITY, WHETHER IN AN ACTION OF CONTRACT, TORT OR OTHERWISE, ARISING FROM, OUT OF OR IN CONNECTION WITH THE SOFTWARE OR THE USE OR OTHER DEALINGS IN THE SOFTWARE. |
| keywords |
graph
perfmon
perfmon.exe
pyqtgraph
metrics
monitor
perf
performance
cpu
pcpu
rss
process
memory
ram
|
| VCS |
 |
| bugtrack_url |
|
| requirements |
No requirements were recorded.
|
| Travis-CI |
No Travis.
|
| coveralls test coverage |
No coveralls.
|
# grafmon
Monitor metrics in a real-time time-series line-graph

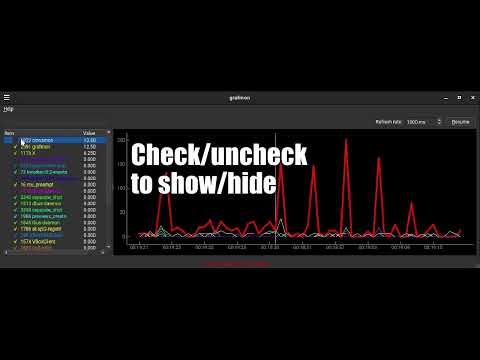
# Demonstration video
[](https://youtube.com/watch?v=o76IbERE7ec)
# Features
* Real-time time-series graph of metrics with several ways to ingest data:
* Streaming from file, socket or STDIN
* Builtin system monitors
* Custom command
* Polished graph interface
* Hover over lines to see data
* Click lines to highlight
* Pause graph updates
* Customize count of ticks along x-axis
* Customize count of labels along x-axis
* Adjustable refresh rate
* Defaults to 1000 ms
* Remembers window position/layout
# Install
pip install grafmon
# Usage
```
usage: grafmon [-h] [-m MONITOR | -c COMMAND | -s STREAM | -f [FILE]] [-r REFRESHRATE] [-t TICKS] [-l LABELS] [--list-monitors]
Monitor metrics in a real-time time-series graph
options:
-h, --help show this help message and exit
-m MONITOR, --monitor MONITOR
Select from builtin monitors to feed data into graph [default: pcpu]
-c COMMAND, --command COMMAND
User command to feed data into graph [example: ps -eo rss,pid,comm --no-headers]
-s STREAM, --stream STREAM
Streaming user command to feed data into graph [example: tail -f logfile]
-f [FILE], --file [FILE]
Continuously read file or STDIN to feed data into graph
-r REFRESHRATE, --refreshrate REFRESHRATE
Refresh rate in milliseconds [default: 1000]
-t TICKS, --ticks TICKS
Count of ticks on X axis [default: 60]
-l LABELS, --labels LABELS
Count of labels on X axis [default: 10]
--list-monitors List available builtin monitors
```
# Builtin monitors
```
avgpcpu Average CPU% (using `ps`) over lifetime of all processes
cuc CPU%, including dead children, in extended ##.### format of all processes
cuu CPU% in extended ##.### format of all processes
drs Data resident set size of all processes
pcpu Immediate CPU% (using `top`) of all processes
pmem Physical memory percentage of all processes
pss Proportional share size of all processes
rbytes Number of bytes really fetched from storage layer of all processes
rchars Number of bytes read from storage of all processes
rops Number of read I/O operations of all processes
rss Resident set size (physical memory usage, in kilobytes) of all processes
sz Physical pages used of all processes
thcount Thread counts of all processes
trs Text resident set (executable code memory usage) of all processes
vsz Virtual memory usage of all processes
wbytes Number of bytes really written to storage layer of all processes
wcbytes Number of canceled write bytes of all processes
wchars Number of bytes written to storage of all processes
wops Number of write I/O operations of all processes
```
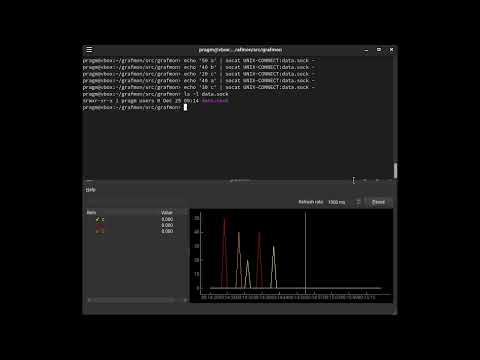
# Custom monitors
Grafmon is not limited to the builtin monitors. Grafmon also accepts user-provided
commands for monitoring. Grafmon can monitor data from files, streams, sockets and STDIN.
Grafmon can be used to easily monitor IoT sensors such as smart plug metrics to track power
usage of appliances, and more!
Demonstration video:
[](https://youtube.com/watch?v=sOQtWdZviTY)
## Data format
The monitor must output lines in the format of `<float> <string>` to STDOUT. The `<float>`
will be the value associated with `<string>`. The `<string>` may contain spaces.
For example, a monitor for household appliance wattage consumption might output:
110 Kitchen Refrigerator
60 Living Room Television
80 Office Computer
130 Kitchen Refrigerator
65 Living Room Television
90 Office Computer
For system processes, it can be helpful to include the PIDs in the `<string>`:
10 2301 X
30 2304 python3
50 2250 qemu
15 2301 X
20 2304 python3
60 2250 qemu
## Custom command
-c COMMAND, --command COMMAND
Grafmon will invoke the command every refresh-rate tick; the command must start and terminate each tick.
This is ideal for executing short-lived processes to fetch data.
For example:
grafmon -c 'ps -eo pcpu,pid,comm --no-headers'
## Streaming
-s STREAM, --stream STREAM
Grafmon will invoke the command once and expects the command to remain running. This is ideal for
fetching data from a long-running process or log file.
For example:
grafmon -s 'tail -f logfile -n0'
grafmon -s 'socat UNIX-LISTEN:data.sock -'
## File or STDIN
-f [FILE], --file [FILE]
Grafmon will open the file and continuously fetch data. If `[FILE]` is omitted, STDIN
will be opened.
For example:
socat TCP-LISTEN:1234 - | grafmon -f
# Customizing ticks and labels
The count of ticks and labels along the x-axis can be customized. The default is 60 ticks
and 10 labels. This is ideal for the default window size and refresh-rate, providing a graph
window containing 1 minute's worth of ticks at 1000 ms per update.
If you prefer more or less ticks, use the `-t TICKS, --ticks TICKS` option.
If you prefer more or less labels, use the `-l LABELS, --labels LABELS` option.
# Notes
This app is aimed at short-term use on personal laptops/desktops. For long-term monitoring of
servers, you should use something like sysstat logging along with grafana/kibana.
I needed an easy-to-install local app that requires no-to-minimal set-up to graph in real-time
various system metrics and custom IoT metrics, notably percentages of CPU usages for all active
processes and wattage usages of my home appliances. The KDE and Gnome system monitors/task
managers graph overall CPU usage rather than per-process usage.
Grafmon is inspired in part by Windows' perfmon.exe. The graph does not scroll, but instead
updates in a horizontally rolling blind. A vertical line will move from left-to-right as the
metrics are read each tick. When the line reaches the end, it resets back to the beginning.
This allows easy hovering over of graph elements to inspect the data. A moving scrolling graph
would be more difficult to hover over the lines and their peaks.
Lines may be clicked on to highlight them to more easily see them in the graph. Lines may
be hovered-over to see a tooltip of their values. Their values will also appear in the status
bar at the bottom of the window.
To zoom the graph in to inspect lower valued lines, you can untick the checkboxes in the list
on the left. Unticking checkboxes for lines with the highest peaks will hide those lines and
the graph will zoom in to fit the next highest peaks.
Raw data
{
"_id": null,
"home_page": null,
"name": "grafmon",
"maintainer": null,
"docs_url": null,
"requires_python": ">=3.7",
"maintainer_email": null,
"keywords": "graph, perfmon, perfmon.exe, pyqtgraph, metrics, monitor, perf, performance, cpu, pcpu, rss, process, memory, ram",
"author": null,
"author_email": "Pragmatic Software <pragma78@gmail.com>",
"download_url": "https://files.pythonhosted.org/packages/7c/29/020f7188e86a95f9c898beb6694137ba478de13d87ce358926a65e1aea09/grafmon-1.1.1.tar.gz",
"platform": null,
"description": "# grafmon\n\nMonitor metrics in a real-time time-series line-graph\n\n\n\n# Demonstration video\n\n[](https://youtube.com/watch?v=o76IbERE7ec)\n\n# Features\n\n* Real-time time-series graph of metrics with several ways to ingest data:\n * Streaming from file, socket or STDIN\n * Builtin system monitors\n * Custom command\n* Polished graph interface\n * Hover over lines to see data\n * Click lines to highlight\n * Pause graph updates\n * Customize count of ticks along x-axis\n * Customize count of labels along x-axis\n* Adjustable refresh rate\n * Defaults to 1000 ms\n* Remembers window position/layout\n\n# Install\n\n pip install grafmon\n\n# Usage\n\n```\nusage: grafmon [-h] [-m MONITOR | -c COMMAND | -s STREAM | -f [FILE]] [-r REFRESHRATE] [-t TICKS] [-l LABELS] [--list-monitors]\n\nMonitor metrics in a real-time time-series graph\n\noptions:\n -h, --help show this help message and exit\n -m MONITOR, --monitor MONITOR\n Select from builtin monitors to feed data into graph [default: pcpu]\n -c COMMAND, --command COMMAND\n User command to feed data into graph [example: ps -eo rss,pid,comm --no-headers]\n -s STREAM, --stream STREAM\n Streaming user command to feed data into graph [example: tail -f logfile]\n -f [FILE], --file [FILE]\n Continuously read file or STDIN to feed data into graph\n -r REFRESHRATE, --refreshrate REFRESHRATE\n Refresh rate in milliseconds [default: 1000]\n -t TICKS, --ticks TICKS\n Count of ticks on X axis [default: 60]\n -l LABELS, --labels LABELS\n Count of labels on X axis [default: 10]\n --list-monitors List available builtin monitors\n```\n\n# Builtin monitors\n\n```\navgpcpu Average CPU% (using `ps`) over lifetime of all processes\ncuc CPU%, including dead children, in extended ##.### format of all processes\ncuu CPU% in extended ##.### format of all processes\ndrs Data resident set size of all processes\npcpu Immediate CPU% (using `top`) of all processes\npmem Physical memory percentage of all processes\npss Proportional share size of all processes\nrbytes Number of bytes really fetched from storage layer of all processes\nrchars Number of bytes read from storage of all processes\nrops Number of read I/O operations of all processes\nrss Resident set size (physical memory usage, in kilobytes) of all processes\nsz Physical pages used of all processes\nthcount Thread counts of all processes\ntrs Text resident set (executable code memory usage) of all processes\nvsz Virtual memory usage of all processes\nwbytes Number of bytes really written to storage layer of all processes\nwcbytes Number of canceled write bytes of all processes\nwchars Number of bytes written to storage of all processes\nwops Number of write I/O operations of all processes\n```\n\n# Custom monitors\n\nGrafmon is not limited to the builtin monitors. Grafmon also accepts user-provided\ncommands for monitoring. Grafmon can monitor data from files, streams, sockets and STDIN.\nGrafmon can be used to easily monitor IoT sensors such as smart plug metrics to track power\nusage of appliances, and more!\n\nDemonstration video:\n\n[](https://youtube.com/watch?v=sOQtWdZviTY)\n\n## Data format\n\nThe monitor must output lines in the format of `<float> <string>` to STDOUT. The `<float>`\nwill be the value associated with `<string>`. The `<string>` may contain spaces.\n\nFor example, a monitor for household appliance wattage consumption might output:\n\n 110 Kitchen Refrigerator\n 60 Living Room Television\n 80 Office Computer\n 130 Kitchen Refrigerator\n 65 Living Room Television\n 90 Office Computer\n\nFor system processes, it can be helpful to include the PIDs in the `<string>`:\n\n 10 2301 X\n 30 2304 python3\n 50 2250 qemu\n 15 2301 X\n 20 2304 python3\n 60 2250 qemu\n\n## Custom command\n\n -c COMMAND, --command COMMAND\n\nGrafmon will invoke the command every refresh-rate tick; the command must start and terminate each tick.\nThis is ideal for executing short-lived processes to fetch data.\n\nFor example:\n\n grafmon -c 'ps -eo pcpu,pid,comm --no-headers'\n\n## Streaming\n\n -s STREAM, --stream STREAM\n\nGrafmon will invoke the command once and expects the command to remain running. This is ideal for\nfetching data from a long-running process or log file.\n\nFor example:\n\n grafmon -s 'tail -f logfile -n0'\n grafmon -s 'socat UNIX-LISTEN:data.sock -'\n\n## File or STDIN\n\n -f [FILE], --file [FILE]\n\nGrafmon will open the file and continuously fetch data. If `[FILE]` is omitted, STDIN\nwill be opened.\n\nFor example:\n\n socat TCP-LISTEN:1234 - | grafmon -f\n\n# Customizing ticks and labels\n\nThe count of ticks and labels along the x-axis can be customized. The default is 60 ticks\nand 10 labels. This is ideal for the default window size and refresh-rate, providing a graph\nwindow containing 1 minute's worth of ticks at 1000 ms per update.\n\nIf you prefer more or less ticks, use the `-t TICKS, --ticks TICKS` option.\n\nIf you prefer more or less labels, use the `-l LABELS, --labels LABELS` option.\n\n# Notes\n\nThis app is aimed at short-term use on personal laptops/desktops. For long-term monitoring of\nservers, you should use something like sysstat logging along with grafana/kibana.\n\nI needed an easy-to-install local app that requires no-to-minimal set-up to graph in real-time\nvarious system metrics and custom IoT metrics, notably percentages of CPU usages for all active\nprocesses and wattage usages of my home appliances. The KDE and Gnome system monitors/task\nmanagers graph overall CPU usage rather than per-process usage.\n\nGrafmon is inspired in part by Windows' perfmon.exe. The graph does not scroll, but instead\nupdates in a horizontally rolling blind. A vertical line will move from left-to-right as the\nmetrics are read each tick. When the line reaches the end, it resets back to the beginning.\nThis allows easy hovering over of graph elements to inspect the data. A moving scrolling graph\nwould be more difficult to hover over the lines and their peaks.\n\nLines may be clicked on to highlight them to more easily see them in the graph. Lines may\nbe hovered-over to see a tooltip of their values. Their values will also appear in the status\nbar at the bottom of the window.\n\nTo zoom the graph in to inspect lower valued lines, you can untick the checkboxes in the list\non the left. Unticking checkboxes for lines with the highest peaks will hide those lines and\nthe graph will zoom in to fit the next highest peaks.\n",
"bugtrack_url": null,
"license": "Copyright (c) 2024-2025 Pragmatic Software <pragma78@gmail.com> Permission is hereby granted, free of charge, to any person obtaining a copy of this software and associated documentation files (the \"Software\"), to deal in the Software without restriction, including without limitation the rights to use, copy, modify, merge, publish, distribute, sublicense, and/or sell copies of the Software, and to permit persons to whom the Software is furnished to do so, subject to the following conditions: The above copyright notice and this permission notice shall be included in all copies or substantial portions of the Software. THE SOFTWARE IS PROVIDED \"AS IS\", WITHOUT WARRANTY OF ANY KIND, EXPRESS OR IMPLIED, INCLUDING BUT NOT LIMITED TO THE WARRANTIES OF MERCHANTABILITY, FITNESS FOR A PARTICULAR PURPOSE AND NONINFRINGEMENT. IN NO EVENT SHALL THE AUTHORS OR COPYRIGHT HOLDERS BE LIABLE FOR ANY CLAIM, DAMAGES OR OTHER LIABILITY, WHETHER IN AN ACTION OF CONTRACT, TORT OR OTHERWISE, ARISING FROM, OUT OF OR IN CONNECTION WITH THE SOFTWARE OR THE USE OR OTHER DEALINGS IN THE SOFTWARE. ",
"summary": "Monitor metrics in a real-time time-series line-graph (a-la perfmon.exe)",
"version": "1.1.1",
"project_urls": {
"Homepage": "https://github.com/pragma-/grafmon",
"Issues": "https://github.com/pragma-/grafmon/issues",
"Repository": "https://github.com/pragma-/grafmon.git"
},
"split_keywords": [
"graph",
" perfmon",
" perfmon.exe",
" pyqtgraph",
" metrics",
" monitor",
" perf",
" performance",
" cpu",
" pcpu",
" rss",
" process",
" memory",
" ram"
],
"urls": [
{
"comment_text": "",
"digests": {
"blake2b_256": "b3de481f8025c9d84e40f955f2d39a4367ce13cc633d68dd30a700bf1b084eb3",
"md5": "16cc6110049d9ae2e5efc3eccf0e9bf7",
"sha256": "d60df8987fc208dc110360eb0a267f2feb6b9cb3d90d1931ae9a12dd77357013"
},
"downloads": -1,
"filename": "grafmon-1.1.1-py3-none-any.whl",
"has_sig": false,
"md5_digest": "16cc6110049d9ae2e5efc3eccf0e9bf7",
"packagetype": "bdist_wheel",
"python_version": "py3",
"requires_python": ">=3.7",
"size": 19677,
"upload_time": "2024-12-25T10:29:13",
"upload_time_iso_8601": "2024-12-25T10:29:13.435337Z",
"url": "https://files.pythonhosted.org/packages/b3/de/481f8025c9d84e40f955f2d39a4367ce13cc633d68dd30a700bf1b084eb3/grafmon-1.1.1-py3-none-any.whl",
"yanked": false,
"yanked_reason": null
},
{
"comment_text": "",
"digests": {
"blake2b_256": "7c29020f7188e86a95f9c898beb6694137ba478de13d87ce358926a65e1aea09",
"md5": "29b34ef6b5fe563a8d512490abf69273",
"sha256": "d2078ea3ac70c74f5765b323225141d51f44632631a03bbe8cfc034cd280798b"
},
"downloads": -1,
"filename": "grafmon-1.1.1.tar.gz",
"has_sig": false,
"md5_digest": "29b34ef6b5fe563a8d512490abf69273",
"packagetype": "sdist",
"python_version": "source",
"requires_python": ">=3.7",
"size": 16862,
"upload_time": "2024-12-25T10:29:15",
"upload_time_iso_8601": "2024-12-25T10:29:15.653057Z",
"url": "https://files.pythonhosted.org/packages/7c/29/020f7188e86a95f9c898beb6694137ba478de13d87ce358926a65e1aea09/grafmon-1.1.1.tar.gz",
"yanked": false,
"yanked_reason": null
}
],
"upload_time": "2024-12-25 10:29:15",
"github": true,
"gitlab": false,
"bitbucket": false,
"codeberg": false,
"github_user": "pragma-",
"github_project": "grafmon",
"travis_ci": false,
"coveralls": false,
"github_actions": false,
"lcname": "grafmon"
}
