[](https://graphizy.readthedocs.io/en/latest/)
[](https://pypi.org/project/graphizy/)
[](https://pypi.org/project/graphizy/)
[](https://github.com/cfosseprez/graphizy/actions/workflows/ci.yml)
[](https://github.com/cfosseprez/graphizy/blob/main/LICENSE)
<img align="left" width="64" height="48" src="https://raw.githubusercontent.com/cfosseprez/graphizy/main/images/logo.png" alt="Graphizy">
# Graphizy
**Graphizy** is a powerful, fast, and flexible Python library for building and analyzing graphs from 2D spatial data. Designed for computational geometry and network visualization, it supports multiple graph types, real-time analysis, memory-enhanced temporal graphs, and comprehensive weight computation systems — all powered by OpenCV and igraph with a modern, unified API.
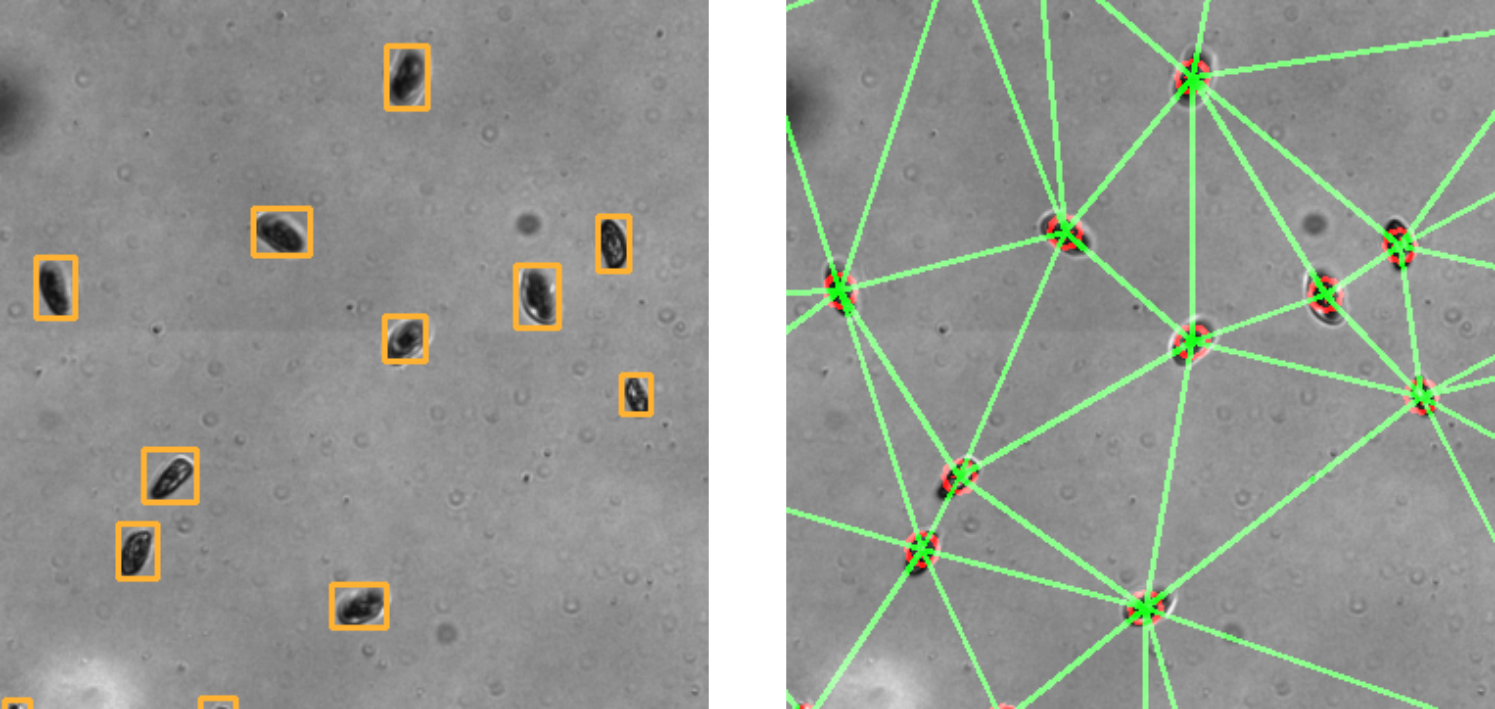
*Convert spatial coordinates to analyzed graphs in milliseconds. Real-time graph analytics accessible through comprehensive igraph integration with enhanced memory and weight systems.*
## Documentation
📖 **[Full Documentation](https://graphizy.readthedocs.io/en/latest/)**
## ✨ Key Features
- **One API for All Graphs**
Create Delaunay, k-NN, MST, Gabriel, Proximity, and even custom graphs with a single make_graph() call. Plugin-friendly, smart defaults, and fully type-safe.
- **Temporal Memory System**
Track how connections evolve over time. Use built-in memory features for persistence-aware analysis, temporal filtering, and age-based visualization.
- **Rich Graph Types, Easily Extended**
From spatial graphs to domain-specific topologies: support includes Delaunay triangulations, proximity graphs, k-nearest neighbors, MSTs, and custom plugins.
- **Instant Network Analysis**
Access over 200 igraph algorithms with real-time stats: clustering, centrality, components, and more. All robust to disconnections. NetworkX compatible.
- **Custom Weights, Real-Time Ready**
Define weights using distance, inverse, Gaussian, or custom formulas. Memory-aware weight updates and vectorized for performance.
- **Advanced Tools for Spatial & Temporal Insights**
Includes percolation thresholds, service accessibility, social dynamics, and time-aware community tracking — all tailored for dynamic networks.
- **Visualization & Streaming**
Visualize network memory with age-based coloring and transparency. Stream updates in real time, or export static snapshots. Comes with CLI tools and interactive demos.
### 🔄 **Unified Graph Creation Interface**
- **Modern API**: Single `make_graph()` method for all graph types
- **Plugin System**: Easily add custom graph algorithms
- **Smart Defaults**: Intelligent parameter handling with memory and weight integration
- **Type Safety**: Runtime configuration validation with detailed error messages
### 📊 **Comprehensive Graph Types**
- **Delaunay Triangulation**: Optimal triangular meshes from point sets
- **Proximity Graphs**: Connect nearby points based on distance thresholds
- **K-Nearest Neighbors**: Connect each point to its k closest neighbors
- **Minimum Spanning Tree**: Minimal connected graph with shortest total edge length
- **Gabriel Graph**: Geometric proximity graph (subset of Delaunay triangulation)
- **Custom Graphs**: Extensible plugin system for domain-specific algorithms
### 🧠 **Advanced Memory Systems**
- **Temporal Analysis**: Track connections across time steps for dynamic systems
- **Smart Integration**: Automatic memory updates with configurable retention policies
- **Age-Based Visualization**: Visual feedback showing connection persistence over time
- **Performance Optimized**: Vectorized operations for real-time applications
### ⚖️ **Sophisticated Weight Computation**
- **Multiple Methods**: Distance, inverse distance, Gaussian, and custom formulas
- **Real-Time Computation**: Optimized fast computers for high-performance applications
- **Edge Attributes**: Compute any edge attribute using mathematical expressions
- **Memory Integration**: Weight computation on memory-enhanced graph structures
### 📈 **Comprehensive Graph Analysis**
- **igraph Integration**: Full access to 200+ graph analysis algorithms
- **Resilient Methods**: Robust analysis that handles disconnected graphs gracefully
- **Real-Time Statistics**: Vertex count, edge count, connectivity, clustering, centrality
- **Component Analysis**: Detailed connectivity and community structure analysis
### 🎨 **Advanced Visualization & Real-Time Processing**
- **Memory Visualization**: Age-based coloring and transparency effects
- **Real-Time Streaming**: High-performance streaming with async support
- **Flexible Configuration**: Runtime-configurable parameters using type-safe dataclasses
- **Interactive Demos**: Built-in demonstrations and CLI tools
## 🚀 Installation
```bash
pip install graphizy
```
For development:
```bash
git clone https://github.com/cfosseprez/graphizy.git
cd graphizy
pip install -e .
```
## ⚡ Quick Start
### Modern Unified Interface
```python
from graphizy import Graphing, GraphizyConfig, generate_and_format_positions
# Generate sample data
data = generate_and_format_positions(size_x=800, size_y=600, num_particles=100)
# Configure and create grapher
config = GraphizyConfig(dimension=(800, 600))
grapher = Graphing(config=config)
# Create different graph types using unified interface
delaunay_graph = grapher.make_graph("delaunay", data)
proximity_graph = grapher.make_graph("proximity", data, proximity_thresh=50.0)
knn_graph = grapher.make_graph("knn", data, k=4)
mst_graph = grapher.make_graph("mst", data)
gabriel_graph = grapher.make_graph("gabriel", data)
# Visualize results
image = grapher.draw_graph(delaunay_graph)
grapher.show_graph(image, "Delaunay Graph")
grapher.save_graph(image, "delaunay.jpg")
```
### Advanced Analysis with Modern API
```python
# Comprehensive graph analysis
results = grapher.get_graph_info(delaunay_graph) # This call is instantaneous
# Print a clean, pre-formatted summary
print(results.summary())
# Access specific metrics as properties (computed on first access)
print(f"Density: {results.density:.3f}")
print(f"Diameter: {results.diameter}")
# Use helper methods for deeper analysis
top_hubs = results.get_top_n_by('degree', n=3)
print(f"Top 3 hubs (by degree): {top_hubs}")
betweenness_stats = results.get_metric_stats('betweenness')
print(f"Betweenness Centrality Stats: {betweenness_stats}")
```
## 🧠 Memory-Enhanced Temporal Graphs
Track connections over time for dynamic system analysis:
```python
import numpy as np
# Initialize memory system
grapher.init_memory_manager(max_memory_size=200, track_edge_ages=True)
# Simulate evolution over time with automatic memory integration
for iteration in range(100):
# Update positions (e.g., particle movement)
data[:, 1:3] += np.random.normal(0, 2, (len(data), 2))
# Create memory-enhanced graph (automatic with smart defaults)
memory_graph = grapher.make_graph("proximity", data, proximity_thresh=60.0)
# Automatically: use_memory=True, update_memory=True, compute_weights=True
# Visualize with age-based coloring every 10 iterations
if iteration % 10 == 0:
memory_image = grapher.draw_memory_graph(
memory_graph,
use_age_colors=True,
alpha_range=(0.3, 1.0) # Older connections fade
)
grapher.save_graph(memory_image, f"memory_frame_{iteration:03d}.jpg")
# Analyze memory evolution
memory_stats = grapher.get_memory_analysis()
print(f"Total historical connections: {memory_stats['total_connections']}")
print(f"Average edge age: {memory_stats['edge_age_stats']['avg_age']:.1f}")
```
## ⚖️ Advanced Weight Computation
Compute sophisticated edge weights with multiple methods:
```python
# Initialize weight computation system
grapher.init_weight_computer(method="gaussian", target_attribute="similarity")
# Create graphs with automatic weight computation
weighted_graph = grapher.make_graph("proximity", data,
proximity_thresh=70.0,
compute_weights=True)
# Analyze edge weights
if 'similarity' in weighted_graph.es.attributes():
weights = weighted_graph.es['similarity']
print(f"Weight statistics: mean={np.mean(weights):.3f}, std={np.std(weights):.3f}")
# Custom weight formulas
grapher.compute_edge_attribute(weighted_graph, "custom_weight",
method="formula",
formula="1.0 / (1.0 + distance * 0.01)")
# Real-time optimized weight computation
grapher.setup_fast_attributes(
distance={"method": "distance", "target": "dist"},
strength={"method": "inverse_distance", "target": "strength"}
)
fast_graph = grapher.make_graph("delaunay", data, compute_weights=False)
grapher.compute_all_attributes_fast(fast_graph) # High-performance computation
```
## 🔄 Automated Multi-Graph Processing
Process multiple graph types automatically with memory and weights:
```python
# Configure automatic processing
grapher.set_graph_type(['delaunay', 'proximity', 'knn', 'mst'])
grapher.update_graph_params('proximity', proximity_thresh=60.0, metric='euclidean')
grapher.update_graph_params('knn', k=5)
# Initialize integrated systems
grapher.init_memory_manager(max_memory_size=150, track_edge_ages=True)
grapher.init_weight_computer(method="distance", target_attribute="weight")
# Process all graph types with full pipeline: graph → memory → weights
all_graphs = grapher.update_graphs(data) # Smart defaults: use_memory=True, update_memory=True, compute_weights=True
# Analyze results
for graph_type, graph in all_graphs.items():
if graph:
info = grapher.get_graph_info(graph)
print(f"{graph_type}: {info['edge_count']} edges, density={info['density']:.3f}")
# Check for computed weights
if 'weight' in graph.es.attributes():
weights = graph.es['weight']
print(f" Weights: avg={np.mean(weights):.3f}")
```
## 🎯 Graph Types Comparison
| Graph Type | Connectivity | Typical Edges | Use Case | Memory Compatible | Weight Compatible |
|------------|--------------|---------------|----------|-------------------|-------------------|
| **Delaunay** | Always | ~3n | Mesh generation, spatial analysis | ✅ | ✅ |
| **Proximity** | Variable | ~distance² | Local neighborhoods, clustering | ✅ | ✅ |
| **K-NN** | Variable | k×n | Machine learning, recommendation | ✅ | ✅ |
| **MST** | Always | n-1 | Minimal connectivity, optimization | ✅ | ✅ |
| **Gabriel** | Variable | ⊆ Delaunay | Wireless networks, geometric constraints | ✅ | ✅ |
| **Memory** | Variable | Historical | Temporal analysis, evolution tracking | N/A | ✅ |
## 🏃♂️ Real-Time Streaming
High-performance real-time graph processing:
```python
# Create stream manager for real-time processing
stream_manager = grapher.create_stream_manager(
buffer_size=1000,
update_interval=0.05, # 20 FPS
auto_memory=True
)
# Add real-time visualization callback
def visualize_callback(graphs):
if 'proximity' in graphs and graphs['proximity']:
image = grapher.draw_memory_graph(graphs['proximity'], use_age_colors=True)
grapher.show_graph(image, "Real-time Graph", block=False)
stream_manager.add_callback(visualize_callback)
stream_manager.start_streaming()
# Feed real-time data
for frame in data_stream:
stream_manager.push_data(frame)
# Async streaming for high-performance applications
async_manager = grapher.create_async_stream_manager(buffer_size=2000)
# ... async processing
```
## 🔧 Plugin System
Easily extend Graphizy with custom graph types:
```python
from graphizy import graph_type_plugin
import igraph as ig
@graph_type_plugin(
name="custom_algorithm",
description="Your custom graph algorithm",
category="custom",
parameters={
"threshold": {"type": "float", "default": 0.5, "description": "Algorithm threshold"}
}
)
def create_custom_graph(data_points, dimension, **kwargs):
# Your algorithm implementation
# ... create igraph Graph
return graph
# Use immediately with unified interface
custom_graph = grapher.make_graph("custom_algorithm", data, threshold=0.7)
```
## 📊 Performance & Scalability
- **Real-time Processing**: Handle 1000+ points at 60+ FPS
- **Memory Efficiency**: Optimized data structures with configurable memory limits
- **Vectorized Operations**: NumPy and OpenCV optimizations throughout
- **Async Support**: High-performance asynchronous streaming capabilities
- **Smart Caching**: Intelligent caching of expensive computations
## 🛠️ Advanced Configuration
Type-safe, runtime-configurable parameters:
```python
# Comprehensive configuration
config = GraphizyConfig(
dimension=(1200, 800),
drawing={
"line_color": (255, 0, 0),
"point_color": (0, 255, 255),
"line_thickness": 2,
"point_radius": 8
},
graph={
"proximity_threshold": 75.0,
"distance_metric": "euclidean"
},
memory={
"max_memory_size": 200,
"auto_update_from_proximity": True
},
weight={
"auto_compute_weights": True,
"weight_method": "gaussian"
}
)
grapher = Graphing(config=config)
# Runtime updates
grapher.update_config(
drawing={"line_thickness": 3},
memory={"max_memory_size": 300}
)
```
## 📚 Examples & Documentation
Comprehensive examples demonstrating all features:
- **`1_basic_usage.py`** - Modern unified interface and all graph types
- **`2_graph_metrics.py`** - Advanced analysis with resilient methods
- **`3_advanced_memory.py`** - Memory systems and temporal analysis
- **`4_weight_computation.py`** - Weight systems and custom formulas
- **`5_add_new_graph_type.py`** - Plugin system and custom algorithms
- **`6_stream_example.py`** - Real-time streaming and async processing
```bash
# Run examples
python examples/1_basic_usage.py
python examples/2_graph_metrics.py
python examples/3_advanced_memory.py
# Interactive demo
python examples/0_interactive_demo.py
```
## 🔬 Advanced Use Cases
### Scientific Computing
```python
# Particle physics simulations with temporal tracking
grapher.init_memory_manager(max_memory_size=1000, track_edge_ages=True)
for timestep in simulation:
particle_graph = grapher.make_graph("delaunay", particle_positions[timestep])
analyze_particle_interactions(particle_graph)
```
### Network Analysis
```python
# Social network evolution with weight analysis
grapher.init_weight_computer(method="inverse_distance", target_attribute="friendship_strength")
social_graph = grapher.make_graph("proximity", user_positions,
proximity_thresh=influence_radius,
compute_weights=True)
```
### Computer Vision
```python
# Feature point tracking in video streams
async for frame_features in video_stream:
feature_graph = grapher.make_graph("knn", frame_features, k=8)
track_feature_evolution(feature_graph)
```
## 📋 Requirements
- **Python** >= 3.8
- **NumPy** >= 1.20.0
- **OpenCV** >= 4.5.0
- **python-igraph** >= 0.9.0
- **SciPy** >= 1.7.0 (for KNN and MST)
- **networkx** >= 3.0 (for NetworkX bridge)
## 🧪 Development & Testing
```bash
# Install development dependencies
pip install -e ".[dev]"
# Run tests with coverage
pytest tests/ --cov=graphizy --cov-report=html
# Code quality
black src/
flake8 src/
mypy src/graphizy/
# Performance testing
python examples/benchmark_comparison.py
```
## 📈 Changelog
### v0.1.17 (Current)
- ✅ **Unified make_graph() Interface**: Single method for all graph types
- ✅ **Enhanced Memory Systems**: Smart defaults and vectorized operations
- ✅ **Advanced Weight Computation**: Multiple methods with real-time optimization
- ✅ **Resilient Analysis Methods**: Robust handling of disconnected graphs
- ✅ **Plugin System Enhancements**: Advanced parameter validation and documentation
- ✅ **Real-Time Streaming**: Async support and performance optimizations
- ✅ **Comprehensive Documentation**: Updated examples and API reference
### Previous Versions
- **v0.1.16**: Added MST and Gabriel graph types, enhanced memory visualization
- **v0.1.15**: Initial memory system and weight computation
- **v0.1.14**: Plugin system and custom graph types
- **v0.1.13**: Core graph types and visualization
## 🤝 Contributing
We welcome contributions! Please see our [Contributing Guide](CONTRIBUTING.md) for details.
1. Fork the repository
2. Create a feature branch (`git checkout -b feature/amazing-feature`)
3. Add comprehensive tests for new functionality
4. Ensure all tests pass (`pytest tests/`)
5. Update documentation and examples
6. Commit changes (`git commit -m 'Add amazing feature'`)
7. Push to branch (`git push origin feature/amazing-feature`)
8. Open a Pull Request
## 📄 License
**GPL-2.0-or-later** License - see [LICENSE](LICENSE) file for details.
## 👨💻 Author
**Charles Fosseprez**
📧 Email: charles.fosseprez.pro@gmail.com
🐙 GitHub: [@cfosseprez](https://github.com/cfosseprez)
📖 Documentation: [graphizy.readthedocs.io](https://graphizy.readthedocs.io/)
## 🙏 Acknowledgments
Built with powerful open-source libraries:
- [OpenCV](https://opencv.org/) for high-performance computer vision operations
- [igraph](https://igraph.org/) for comprehensive graph analysis algorithms
- [NumPy](https://numpy.org/) for efficient numerical computations
- [SciPy](https://scipy.org/) for scientific computing functions
---
*Built with ❤️ for computational geometry, network analysis, and real-time graph processing*
Raw data
{
"_id": null,
"home_page": "https://github.com/cfosseprez/graphizy",
"name": "graphizy",
"maintainer": null,
"docs_url": null,
"requires_python": ">=3.8",
"maintainer_email": null,
"keywords": "graph, delaunay, triangulation, visualization, computational-geometry",
"author": "Charles Fosseprez",
"author_email": "charles.fosseprez.pro@gmail.com",
"download_url": "https://files.pythonhosted.org/packages/a2/97/97871bbc5b08ca312f6f7d4081b8c095d8c74e18d967822d30f5b8d3e47d/graphizy-0.1.20.tar.gz",
"platform": null,
"description": "[](https://graphizy.readthedocs.io/en/latest/)\n[](https://pypi.org/project/graphizy/)\n[](https://pypi.org/project/graphizy/)\n[](https://github.com/cfosseprez/graphizy/actions/workflows/ci.yml)\n[](https://github.com/cfosseprez/graphizy/blob/main/LICENSE)\n\n<img align=\"left\" width=\"64\" height=\"48\" src=\"https://raw.githubusercontent.com/cfosseprez/graphizy/main/images/logo.png\" alt=\"Graphizy\"> \n\n# Graphizy \n\n**Graphizy** is a powerful, fast, and flexible Python library for building and analyzing graphs from 2D spatial data. Designed for computational geometry and network visualization, it supports multiple graph types, real-time analysis, memory-enhanced temporal graphs, and comprehensive weight computation systems \u2014 all powered by OpenCV and igraph with a modern, unified API.\n\n\n\n*Convert spatial coordinates to analyzed graphs in milliseconds. Real-time graph analytics accessible through comprehensive igraph integration with enhanced memory and weight systems.*\n\n## Documentation\n\n\ud83d\udcd6 **[Full Documentation](https://graphizy.readthedocs.io/en/latest/)**\n\n ## \u2728 Key Features\n \n- **One API for All Graphs**\nCreate Delaunay, k-NN, MST, Gabriel, Proximity, and even custom graphs with a single make_graph() call. Plugin-friendly, smart defaults, and fully type-safe.\n\n- **Temporal Memory System**\nTrack how connections evolve over time. Use built-in memory features for persistence-aware analysis, temporal filtering, and age-based visualization.\n\n- **Rich Graph Types, Easily Extended**\nFrom spatial graphs to domain-specific topologies: support includes Delaunay triangulations, proximity graphs, k-nearest neighbors, MSTs, and custom plugins.\n\n- **Instant Network Analysis**\nAccess over 200 igraph algorithms with real-time stats: clustering, centrality, components, and more. All robust to disconnections. NetworkX compatible.\n\n- **Custom Weights, Real-Time Ready**\nDefine weights using distance, inverse, Gaussian, or custom formulas. Memory-aware weight updates and vectorized for performance.\n\n- **Advanced Tools for Spatial & Temporal Insights**\nIncludes percolation thresholds, service accessibility, social dynamics, and time-aware community tracking \u2014 all tailored for dynamic networks.\n\n- **Visualization & Streaming**\nVisualize network memory with age-based coloring and transparency. Stream updates in real time, or export static snapshots. Comes with CLI tools and interactive demos.\n\n### \ud83d\udd04 **Unified Graph Creation Interface**\n- **Modern API**: Single `make_graph()` method for all graph types\n- **Plugin System**: Easily add custom graph algorithms \n- **Smart Defaults**: Intelligent parameter handling with memory and weight integration\n- **Type Safety**: Runtime configuration validation with detailed error messages\n\n### \ud83d\udcca **Comprehensive Graph Types**\n- **Delaunay Triangulation**: Optimal triangular meshes from point sets\n- **Proximity Graphs**: Connect nearby points based on distance thresholds \n- **K-Nearest Neighbors**: Connect each point to its k closest neighbors\n- **Minimum Spanning Tree**: Minimal connected graph with shortest total edge length\n- **Gabriel Graph**: Geometric proximity graph (subset of Delaunay triangulation)\n- **Custom Graphs**: Extensible plugin system for domain-specific algorithms\n\n### \ud83e\udde0 **Advanced Memory Systems**\n- **Temporal Analysis**: Track connections across time steps for dynamic systems\n- **Smart Integration**: Automatic memory updates with configurable retention policies\n- **Age-Based Visualization**: Visual feedback showing connection persistence over time\n- **Performance Optimized**: Vectorized operations for real-time applications\n\n### \u2696\ufe0f **Sophisticated Weight Computation**\n- **Multiple Methods**: Distance, inverse distance, Gaussian, and custom formulas\n- **Real-Time Computation**: Optimized fast computers for high-performance applications\n- **Edge Attributes**: Compute any edge attribute using mathematical expressions\n- **Memory Integration**: Weight computation on memory-enhanced graph structures\n\n### \ud83d\udcc8 **Comprehensive Graph Analysis**\n- **igraph Integration**: Full access to 200+ graph analysis algorithms\n- **Resilient Methods**: Robust analysis that handles disconnected graphs gracefully\n- **Real-Time Statistics**: Vertex count, edge count, connectivity, clustering, centrality\n- **Component Analysis**: Detailed connectivity and community structure analysis\n\n### \ud83c\udfa8 **Advanced Visualization & Real-Time Processing**\n- **Memory Visualization**: Age-based coloring and transparency effects\n- **Real-Time Streaming**: High-performance streaming with async support\n- **Flexible Configuration**: Runtime-configurable parameters using type-safe dataclasses\n- **Interactive Demos**: Built-in demonstrations and CLI tools\n\n## \ud83d\ude80 Installation\n\n```bash\npip install graphizy\n```\n\nFor development:\n```bash\ngit clone https://github.com/cfosseprez/graphizy.git\ncd graphizy\npip install -e .\n```\n\n## \u26a1 Quick Start\n\n### Modern Unified Interface\n\n```python\nfrom graphizy import Graphing, GraphizyConfig, generate_and_format_positions\n\n# Generate sample data\ndata = generate_and_format_positions(size_x=800, size_y=600, num_particles=100)\n\n# Configure and create grapher\nconfig = GraphizyConfig(dimension=(800, 600))\ngrapher = Graphing(config=config)\n\n# Create different graph types using unified interface\ndelaunay_graph = grapher.make_graph(\"delaunay\", data)\nproximity_graph = grapher.make_graph(\"proximity\", data, proximity_thresh=50.0)\nknn_graph = grapher.make_graph(\"knn\", data, k=4)\nmst_graph = grapher.make_graph(\"mst\", data)\ngabriel_graph = grapher.make_graph(\"gabriel\", data)\n\n# Visualize results\nimage = grapher.draw_graph(delaunay_graph)\ngrapher.show_graph(image, \"Delaunay Graph\")\ngrapher.save_graph(image, \"delaunay.jpg\")\n```\n\n### Advanced Analysis with Modern API\n\n```python\n# Comprehensive graph analysis\nresults = grapher.get_graph_info(delaunay_graph) # This call is instantaneous\n\n# Print a clean, pre-formatted summary\nprint(results.summary())\n\n# Access specific metrics as properties (computed on first access)\nprint(f\"Density: {results.density:.3f}\")\nprint(f\"Diameter: {results.diameter}\")\n\n# Use helper methods for deeper analysis\ntop_hubs = results.get_top_n_by('degree', n=3)\nprint(f\"Top 3 hubs (by degree): {top_hubs}\")\n\nbetweenness_stats = results.get_metric_stats('betweenness')\nprint(f\"Betweenness Centrality Stats: {betweenness_stats}\")\n```\n\n## \ud83e\udde0 Memory-Enhanced Temporal Graphs\n\nTrack connections over time for dynamic system analysis:\n\n```python\nimport numpy as np\n\n# Initialize memory system\ngrapher.init_memory_manager(max_memory_size=200, track_edge_ages=True)\n\n# Simulate evolution over time with automatic memory integration\nfor iteration in range(100):\n # Update positions (e.g., particle movement)\n data[:, 1:3] += np.random.normal(0, 2, (len(data), 2))\n \n # Create memory-enhanced graph (automatic with smart defaults)\n memory_graph = grapher.make_graph(\"proximity\", data, proximity_thresh=60.0)\n # Automatically: use_memory=True, update_memory=True, compute_weights=True\n \n # Visualize with age-based coloring every 10 iterations\n if iteration % 10 == 0:\n memory_image = grapher.draw_memory_graph(\n memory_graph, \n use_age_colors=True,\n alpha_range=(0.3, 1.0) # Older connections fade\n )\n grapher.save_graph(memory_image, f\"memory_frame_{iteration:03d}.jpg\")\n\n# Analyze memory evolution\nmemory_stats = grapher.get_memory_analysis()\nprint(f\"Total historical connections: {memory_stats['total_connections']}\")\nprint(f\"Average edge age: {memory_stats['edge_age_stats']['avg_age']:.1f}\")\n```\n\n## \u2696\ufe0f Advanced Weight Computation\n\nCompute sophisticated edge weights with multiple methods:\n\n```python\n# Initialize weight computation system\ngrapher.init_weight_computer(method=\"gaussian\", target_attribute=\"similarity\")\n\n# Create graphs with automatic weight computation\nweighted_graph = grapher.make_graph(\"proximity\", data, \n proximity_thresh=70.0,\n compute_weights=True)\n\n# Analyze edge weights\nif 'similarity' in weighted_graph.es.attributes():\n weights = weighted_graph.es['similarity']\n print(f\"Weight statistics: mean={np.mean(weights):.3f}, std={np.std(weights):.3f}\")\n\n# Custom weight formulas\ngrapher.compute_edge_attribute(weighted_graph, \"custom_weight\", \n method=\"formula\", \n formula=\"1.0 / (1.0 + distance * 0.01)\")\n\n# Real-time optimized weight computation\ngrapher.setup_fast_attributes(\n distance={\"method\": \"distance\", \"target\": \"dist\"},\n strength={\"method\": \"inverse_distance\", \"target\": \"strength\"}\n)\nfast_graph = grapher.make_graph(\"delaunay\", data, compute_weights=False)\ngrapher.compute_all_attributes_fast(fast_graph) # High-performance computation\n```\n\n## \ud83d\udd04 Automated Multi-Graph Processing\n\nProcess multiple graph types automatically with memory and weights:\n\n```python\n# Configure automatic processing\ngrapher.set_graph_type(['delaunay', 'proximity', 'knn', 'mst'])\ngrapher.update_graph_params('proximity', proximity_thresh=60.0, metric='euclidean')\ngrapher.update_graph_params('knn', k=5)\n\n# Initialize integrated systems\ngrapher.init_memory_manager(max_memory_size=150, track_edge_ages=True)\ngrapher.init_weight_computer(method=\"distance\", target_attribute=\"weight\")\n\n# Process all graph types with full pipeline: graph \u2192 memory \u2192 weights\nall_graphs = grapher.update_graphs(data) # Smart defaults: use_memory=True, update_memory=True, compute_weights=True\n\n# Analyze results\nfor graph_type, graph in all_graphs.items():\n if graph:\n info = grapher.get_graph_info(graph)\n print(f\"{graph_type}: {info['edge_count']} edges, density={info['density']:.3f}\")\n \n # Check for computed weights\n if 'weight' in graph.es.attributes():\n weights = graph.es['weight']\n print(f\" Weights: avg={np.mean(weights):.3f}\")\n```\n\n## \ud83c\udfaf Graph Types Comparison\n\n| Graph Type | Connectivity | Typical Edges | Use Case | Memory Compatible | Weight Compatible |\n|------------|--------------|---------------|----------|-------------------|-------------------|\n| **Delaunay** | Always | ~3n | Mesh generation, spatial analysis | \u2705 | \u2705 |\n| **Proximity** | Variable | ~distance\u00b2 | Local neighborhoods, clustering | \u2705 | \u2705 |\n| **K-NN** | Variable | k\u00d7n | Machine learning, recommendation | \u2705 | \u2705 |\n| **MST** | Always | n-1 | Minimal connectivity, optimization | \u2705 | \u2705 |\n| **Gabriel** | Variable | \u2286 Delaunay | Wireless networks, geometric constraints | \u2705 | \u2705 |\n| **Memory** | Variable | Historical | Temporal analysis, evolution tracking | N/A | \u2705 |\n\n## \ud83c\udfc3\u200d\u2642\ufe0f Real-Time Streaming\n\nHigh-performance real-time graph processing:\n\n```python\n# Create stream manager for real-time processing\nstream_manager = grapher.create_stream_manager(\n buffer_size=1000,\n update_interval=0.05, # 20 FPS\n auto_memory=True\n)\n\n# Add real-time visualization callback\ndef visualize_callback(graphs):\n if 'proximity' in graphs and graphs['proximity']:\n image = grapher.draw_memory_graph(graphs['proximity'], use_age_colors=True)\n grapher.show_graph(image, \"Real-time Graph\", block=False)\n\nstream_manager.add_callback(visualize_callback)\nstream_manager.start_streaming()\n\n# Feed real-time data\nfor frame in data_stream:\n stream_manager.push_data(frame)\n\n# Async streaming for high-performance applications\nasync_manager = grapher.create_async_stream_manager(buffer_size=2000)\n# ... async processing\n```\n\n## \ud83d\udd27 Plugin System\n\nEasily extend Graphizy with custom graph types:\n\n```python\nfrom graphizy import graph_type_plugin\nimport igraph as ig\n\n@graph_type_plugin(\n name=\"custom_algorithm\",\n description=\"Your custom graph algorithm\",\n category=\"custom\",\n parameters={\n \"threshold\": {\"type\": \"float\", \"default\": 0.5, \"description\": \"Algorithm threshold\"}\n }\n)\ndef create_custom_graph(data_points, dimension, **kwargs):\n # Your algorithm implementation\n # ... create igraph Graph\n return graph\n\n# Use immediately with unified interface\ncustom_graph = grapher.make_graph(\"custom_algorithm\", data, threshold=0.7)\n```\n\n## \ud83d\udcca Performance & Scalability\n\n- **Real-time Processing**: Handle 1000+ points at 60+ FPS\n- **Memory Efficiency**: Optimized data structures with configurable memory limits\n- **Vectorized Operations**: NumPy and OpenCV optimizations throughout\n- **Async Support**: High-performance asynchronous streaming capabilities\n- **Smart Caching**: Intelligent caching of expensive computations\n\n## \ud83d\udee0\ufe0f Advanced Configuration\n\nType-safe, runtime-configurable parameters:\n\n```python\n# Comprehensive configuration\nconfig = GraphizyConfig(\n dimension=(1200, 800),\n drawing={\n \"line_color\": (255, 0, 0),\n \"point_color\": (0, 255, 255), \n \"line_thickness\": 2,\n \"point_radius\": 8\n },\n graph={\n \"proximity_threshold\": 75.0,\n \"distance_metric\": \"euclidean\"\n },\n memory={\n \"max_memory_size\": 200,\n \"auto_update_from_proximity\": True\n },\n weight={\n \"auto_compute_weights\": True,\n \"weight_method\": \"gaussian\"\n }\n)\n\ngrapher = Graphing(config=config)\n\n# Runtime updates\ngrapher.update_config(\n drawing={\"line_thickness\": 3},\n memory={\"max_memory_size\": 300}\n)\n```\n\n## \ud83d\udcda Examples & Documentation\n\nComprehensive examples demonstrating all features:\n\n- **`1_basic_usage.py`** - Modern unified interface and all graph types\n- **`2_graph_metrics.py`** - Advanced analysis with resilient methods\n- **`3_advanced_memory.py`** - Memory systems and temporal analysis\n- **`4_weight_computation.py`** - Weight systems and custom formulas\n- **`5_add_new_graph_type.py`** - Plugin system and custom algorithms\n- **`6_stream_example.py`** - Real-time streaming and async processing\n\n```bash\n# Run examples\npython examples/1_basic_usage.py\npython examples/2_graph_metrics.py\npython examples/3_advanced_memory.py\n\n# Interactive demo\npython examples/0_interactive_demo.py\n```\n\n## \ud83d\udd2c Advanced Use Cases\n\n### Scientific Computing\n```python\n# Particle physics simulations with temporal tracking\ngrapher.init_memory_manager(max_memory_size=1000, track_edge_ages=True)\nfor timestep in simulation:\n particle_graph = grapher.make_graph(\"delaunay\", particle_positions[timestep])\n analyze_particle_interactions(particle_graph)\n```\n\n### Network Analysis\n```python\n# Social network evolution with weight analysis\ngrapher.init_weight_computer(method=\"inverse_distance\", target_attribute=\"friendship_strength\")\nsocial_graph = grapher.make_graph(\"proximity\", user_positions, \n proximity_thresh=influence_radius,\n compute_weights=True)\n```\n\n### Computer Vision\n```python\n# Feature point tracking in video streams\nasync for frame_features in video_stream:\n feature_graph = grapher.make_graph(\"knn\", frame_features, k=8)\n track_feature_evolution(feature_graph)\n```\n\n## \ud83d\udccb Requirements\n\n- **Python** >= 3.8\n- **NumPy** >= 1.20.0\n- **OpenCV** >= 4.5.0 \n- **python-igraph** >= 0.9.0\n- **SciPy** >= 1.7.0 (for KNN and MST)\n- **networkx** >= 3.0 (for NetworkX bridge)\n\n## \ud83e\uddea Development & Testing\n\n```bash\n# Install development dependencies\npip install -e \".[dev]\"\n\n# Run tests with coverage\npytest tests/ --cov=graphizy --cov-report=html\n\n# Code quality\nblack src/\nflake8 src/\nmypy src/graphizy/\n\n# Performance testing\npython examples/benchmark_comparison.py\n```\n\n## \ud83d\udcc8 Changelog\n\n### v0.1.17 (Current)\n- \u2705 **Unified make_graph() Interface**: Single method for all graph types\n- \u2705 **Enhanced Memory Systems**: Smart defaults and vectorized operations \n- \u2705 **Advanced Weight Computation**: Multiple methods with real-time optimization\n- \u2705 **Resilient Analysis Methods**: Robust handling of disconnected graphs\n- \u2705 **Plugin System Enhancements**: Advanced parameter validation and documentation\n- \u2705 **Real-Time Streaming**: Async support and performance optimizations\n- \u2705 **Comprehensive Documentation**: Updated examples and API reference\n\n### Previous Versions\n- **v0.1.16**: Added MST and Gabriel graph types, enhanced memory visualization\n- **v0.1.15**: Initial memory system and weight computation\n- **v0.1.14**: Plugin system and custom graph types\n- **v0.1.13**: Core graph types and visualization\n\n## \ud83e\udd1d Contributing\n\nWe welcome contributions! Please see our [Contributing Guide](CONTRIBUTING.md) for details.\n\n1. Fork the repository\n2. Create a feature branch (`git checkout -b feature/amazing-feature`)\n3. Add comprehensive tests for new functionality \n4. Ensure all tests pass (`pytest tests/`)\n5. Update documentation and examples\n6. Commit changes (`git commit -m 'Add amazing feature'`)\n7. Push to branch (`git push origin feature/amazing-feature`)\n8. Open a Pull Request\n\n## \ud83d\udcc4 License\n\n**GPL-2.0-or-later** License - see [LICENSE](LICENSE) file for details.\n\n## \ud83d\udc68\u200d\ud83d\udcbb Author\n\n**Charles Fosseprez** \n\ud83d\udce7 Email: charles.fosseprez.pro@gmail.com \n\ud83d\udc19 GitHub: [@cfosseprez](https://github.com/cfosseprez) \n\ud83d\udcd6 Documentation: [graphizy.readthedocs.io](https://graphizy.readthedocs.io/)\n\n## \ud83d\ude4f Acknowledgments\n\nBuilt with powerful open-source libraries:\n- [OpenCV](https://opencv.org/) for high-performance computer vision operations\n- [igraph](https://igraph.org/) for comprehensive graph analysis algorithms \n- [NumPy](https://numpy.org/) for efficient numerical computations\n- [SciPy](https://scipy.org/) for scientific computing functions\n\n---\n\n*Built with \u2764\ufe0f for computational geometry, network analysis, and real-time graph processing*",
"bugtrack_url": null,
"license": "GPL-2.0-or-later",
"summary": "Graphizy is a fast, flexible Python library for building and analyzing computational geometry-based graphs from 2D coordinates.",
"version": "0.1.20",
"project_urls": {
"Documentation": "https://graphizy.readthedocs.io/en/latest/",
"Homepage": "https://github.com/cfosseprez/graphizy",
"Issues": "https://github.com/cfosseprez/graphizy/issues",
"Repository": "https://github.com/cfosseprez/graphizy"
},
"split_keywords": [
"graph",
" delaunay",
" triangulation",
" visualization",
" computational-geometry"
],
"urls": [
{
"comment_text": "",
"digests": {
"blake2b_256": "a785a8f506b625b68cd0116798558529d1f3e585d144e12bd2c6d3b0dbe790f4",
"md5": "de5d922a072cf460848119906a885d79",
"sha256": "4362df93bd85a61a26ae3a06ec49a9ac525d494ba9157a0548287dd21e9173ad"
},
"downloads": -1,
"filename": "graphizy-0.1.20-py3-none-any.whl",
"has_sig": false,
"md5_digest": "de5d922a072cf460848119906a885d79",
"packagetype": "bdist_wheel",
"python_version": "py3",
"requires_python": ">=3.8",
"size": 114444,
"upload_time": "2025-08-07T02:39:56",
"upload_time_iso_8601": "2025-08-07T02:39:56.081405Z",
"url": "https://files.pythonhosted.org/packages/a7/85/a8f506b625b68cd0116798558529d1f3e585d144e12bd2c6d3b0dbe790f4/graphizy-0.1.20-py3-none-any.whl",
"yanked": false,
"yanked_reason": null
},
{
"comment_text": "",
"digests": {
"blake2b_256": "a29797871bbc5b08ca312f6f7d4081b8c095d8c74e18d967822d30f5b8d3e47d",
"md5": "a849dfb5673e40bedde15cdb4607189c",
"sha256": "5bed6d7a5979b0e4ac2e011407ba2db7785a3f394b39e810513ae6da79dab6a1"
},
"downloads": -1,
"filename": "graphizy-0.1.20.tar.gz",
"has_sig": false,
"md5_digest": "a849dfb5673e40bedde15cdb4607189c",
"packagetype": "sdist",
"python_version": "source",
"requires_python": ">=3.8",
"size": 149179,
"upload_time": "2025-08-07T02:39:58",
"upload_time_iso_8601": "2025-08-07T02:39:58.019462Z",
"url": "https://files.pythonhosted.org/packages/a2/97/97871bbc5b08ca312f6f7d4081b8c095d8c74e18d967822d30f5b8d3e47d/graphizy-0.1.20.tar.gz",
"yanked": false,
"yanked_reason": null
}
],
"upload_time": "2025-08-07 02:39:58",
"github": true,
"gitlab": false,
"bitbucket": false,
"codeberg": false,
"github_user": "cfosseprez",
"github_project": "graphizy",
"travis_ci": false,
"coveralls": false,
"github_actions": true,
"lcname": "graphizy"
}

