| Name | grid2viz JSON |
| Version |
1.4.1.post1
 JSON
JSON |
| download |
| home_page | |
| Summary | Grid2Op Visualization companion app. |
| upload_time | 2023-02-02 13:24:34 |
| maintainer | |
| docs_url | None |
| author | Mario Jothy |
| requires_python | >=3.7,<4.0 |
| license | MPL |
| keywords |
|
| VCS |
|
| bugtrack_url |
|
| requirements |
No requirements were recorded.
|
| Travis-CI |
No Travis.
|
| coveralls test coverage |
No coveralls.
|
# Grid2Viz: The Grid2Op Visualization companion app
Grid2Viz is a web application that offers several interactive views into the results of Reinforcement Learning agents that ran on the [Grid2Op](https://github.com/rte-france/Grid2Op) platform. It is part of the [GridAlive](https://github.com/rte-france/gridAlive) lab ecosystem.
* [0 Demo Gallery](#demo-gallery)
* [1 Documentation](#documentation)
* [2 Installation](#installation)
* [3 Run the application](#run-grid2viz)
* [4 Getting Started](#getting-started)
* [5 Caching](#caching)
* [6 Interface](#interface)
* [7 Contributing](#contributing)
* [8 Trouble shooting](#troubleshooting)
### Video highlighting Grid2viz analyzis capabilities
[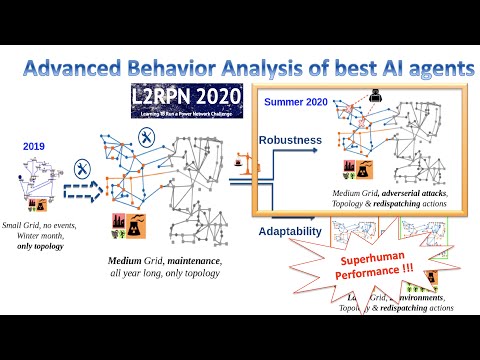](https://www.youtube.com/watch?v=xlqS-CzvMwk)
<em>Through this 10-minute video, the behavior of best AI agents from [L2RPN NeurIPS competition](https://l2rpn.chalearn.org/competitions) is analyzed with Grid2viz under a very interesting and tense scenario.</em>
### Try it out in your browser with Heroku
------------------
**WAnt to reproduce the analysis of the video above !?** Give it a try in your own browser through this url: https://grid2viz-neurips.herokuapp.com/
------------------
## Demo Gallery
<!--- #[](https://mybinder.org/v2/gh/mjothy/grid2viz/jupyter_dash?urlpath=lab)#if launching jupyter lab directly-->
You can otherwise launch a longer demo in your web navigator by running the Grid2viz_demo notebook through Binder by clicking the Binder button. The[Demo repositories used here presents the **best agent results of NeurIPS 2020 L2RPN Competition** .
<!---[](https://mybinder.org/v2/gh/mjothy/grid2viz/master/?urlpath=git-pull?repo=https://github.com/marota/Grid2viz-dataset-NeurIPS-Robustness%26amp%3Burlpath=tree/../%26amp%3Burlpath=tree/Grid2Viz_demo.ipynb%3Fautodecode)--><!--- 1rst urlpath to download the dataset from a new github - 2nd urlpath to get back to a parent root directory - 3rd urlpath to directly load the notebook -->
[](https://mybinder.org/v2/gh/marota/Grid2viz-dataset-NeurIPS-Robustness/HEAD)
One third IEEE118 region NeurIPS Robustness Track Demo - [Demo repository](https://github.com/marota/Grid2viz-dataset-NeurIPS-Robustness) here

[](https://mybinder.org/v2/gh/marota/Grid2viz-dataset-NeurIPS-Adaptability/HEAD)
IEEE118 NeurIPS Adaptability Track Demo - [Demo repository](https://github.com/marota/Grid2viz-dataset-NeurIPS-Adaptability) here.

## Documentation
go to: https://grid2viz.readthedocs.io/en/latest/
## Installation
### Requirements:
* Python >= 3.6
#### (Optional, recommended) Step 1: Create a virtual environment
```commandline
pip3 install -U virtualenv
python3 -m virtualenv venv_grid2viz
```
#### Step 2: Install from pypi
```commandline
source venv_grid2viz/bin/activate
pip install -U grid2viz
```
#### Step 2 (bis): Install from sources
```commandline
source venv_grid2viz/bin/activate
git clone https://github.com/rte-france/grid2viz.git
cd grid2Viz/
pip install -U
```
## Run Grid2Viz
```
usage: grid2viz [-h] [--agents_path AGENTS_PATH] [--env_path ENV_PATH]
[--port PORT] [--debug]
Grid2Viz
optional arguments:
-h, --help show this help message and exit
--agents_path AGENTS_PATH
The path where the episode logs of the Agents to compare are
stored. (default to None to study the example agents
provided with the package)
--env_path ENV_PATH The path where the environment config is stored.
(default to None to use the provided default
environment)
--port PORT The port to serve grid2viz on. (default to 8050)
--debug Enable debug mode for developers. (default to False)
--n_cores Number of cores to generate cache or load cache faster (default to 1)
--cache Create upfront all necessary cache for grid2viz, to avoid waiting for some cache generation online
--warm-start "If True, the application is warm started based on the parameters defined in the WARMSTART section of the config.ini file. (default to False)
```
For example:
```commandline
source venv_grid2viz/bin/activate
grid2viz --port 8000
```
> **_WARNING_** Due to the caching operation the first run can take a while. All the agents present in the configuration files
will be computed and then registered in cache. Depending on your agents it could take between 5 to 15min. You can follow the progress in the console.
You can however generate all the cache over all agents and scenarios before end with `--cache=True`
```commandline
grid2viz --port 8000 --agents_path AGENTS_PATH --n_cores Max_Cores --cache
```
## Getting started
In order to use this tool, you need to have serialized the RL process of grid2op. The expected file system is :
- root_dir (agents_path)
- agent_1
- scenario_1
- scenario_2
- agent_2
- scenario_1
- scenario_2
- scenario_3
Each of the scenario_* files have to contain all files given by serialisation of your RL through grid2op.
In order to add a new agent to the app, you will have to add the agent's folder to this root_dir
For the update process of this folder chain, see the section `Caching` (in particular, when you want to overwrite the current
agents in root_dir with new versions with the same names)
In the config.ini of this repo:
- `agents_dir` is the path to your agents logs data directory.
- `env_dir` is the path to the environment configuration directory. It contains a single file :
- coords.csv : The csv file that lists the coordinates of nodes in the network
Changing this config.ini file will require a restart of the server to update.
Grid2Viz provide 2 agents with a scenario for one day and for one month available in `/grid2viz/data/agents` folder:
- do-nothing-baseline
- greedy-baseline
By default the config.ini is targeting these agents as well as the environment configuration folders.
## Caching
The cache system allows you to only compute long calculations of the app once per agent/scenario.
The app will create a folder `_cache` in the `base_dir` of the config.ini which will contain these long calculations serialized.
If you add a new folder in your `base_dir` (either an agent, or a scenario) you will have to restart the server so the app
reads the folder tree again.
**_WARNING_** : If you overwrite the agents while they were already cached, you will have to manually reset the cache so the app
knows to compute everything again with the updated data. To do so, you just need to delete the `_cache` folder.
## Interface
#### Scenario Selection
This page display up to 15 scenarios with for each one a brief summary using the best agent's performances.

#### Scenario Overview
On this page are displayed the best agent's kpi to see his performances. It's also here that you can select an agent that will
be used as reference agent in the other pages to compare to the studied agents.

#### Agent Overview
Here's displayed your reference agent's performances. You can select an agent to study to compare it with your reference via the
dropdown on the page. The study agent selected will be used as study agent on the last page.
In the *"instant and cumulated reward"* graph you can point timestep that will be use in the next page to study
action in a specific timestep area.

#### Agent Study
The Agent Study page will display kpi of your reference agent compared to your study agent on your selected timestep area.
You will also see a summary of the previous page's kpi.

## CONTRIBUTING
As agent behavior analysis is still an active field of research and new ideas can come along the way, we welcome contributions to develop:
* new relevant visualizations (within grid2viz/grid2viz/src/kpi)
* new interactions (see nameOfTab_clbk.py) within the application
* existing feature improvements are also welcome.
## Run the tests
To run the tests, execute the following command:
```commandline
python3 -m unittest discover --start-directory tests --buffer
```
## Limitations
The app is still missing a couple features, namely a graph for visualising the flow through time, and the last line of the last screen, which will show all informations regarding the actions and observations at the selected timestep.
The Actions KPIs and the distances as well as the topological action cluster "object changed" is in alpha feature. We will need some new features from the core API to finish these features.
## Troubleshooting
### MacOS
Some mac users have been experimenting issues when lauching the app, raising the following message:
`socket.gaierror: [Errno 8] nodename nor servname provided, or not known`
The following steps might help you to overcome the issue:
1. Open your terminal
2. Type `echo $HOST` and copy the results
3. Open the file `/etc/hosts` and make sure you include: <br>
`127.0.0.1 PASTE RESULTS FROM echo $HOST`
4. Save it and close it
5. Launch grid2viz
Raw data
{
"_id": null,
"home_page": "",
"name": "grid2viz",
"maintainer": "",
"docs_url": null,
"requires_python": ">=3.7,<4.0",
"maintainer_email": "",
"keywords": "",
"author": "Mario Jothy",
"author_email": "mario.jothy@artelys.com",
"download_url": "https://files.pythonhosted.org/packages/f4/60/885479f9f84dc3e40e4c8ec67e833ce83be4669ae4d454ea5438285085d8/grid2viz-1.4.1.post1.tar.gz",
"platform": null,
"description": "\n# Grid2Viz: The Grid2Op Visualization companion app\n\nGrid2Viz is a web application that offers several interactive views into the results of Reinforcement Learning agents that ran on the [Grid2Op](https://github.com/rte-france/Grid2Op) platform. It is part of the [GridAlive](https://github.com/rte-france/gridAlive) lab ecosystem.\n\n* [0 Demo Gallery](#demo-gallery)\n* [1 Documentation](#documentation)\n* [2 Installation](#installation)\n* [3 Run the application](#run-grid2viz)\n* [4 Getting Started](#getting-started)\n* [5 Caching](#caching)\n* [6 Interface](#interface)\n* [7 Contributing](#contributing)\n* [8 Trouble shooting](#troubleshooting)\n \n### Video highlighting Grid2viz analyzis capabilities\n[](https://www.youtube.com/watch?v=xlqS-CzvMwk)\n\n<em>Through this 10-minute video, the behavior of best AI agents from [L2RPN NeurIPS competition](https://l2rpn.chalearn.org/competitions) is analyzed with Grid2viz under a very interesting and tense scenario.</em>\n\n### Try it out in your browser with Heroku\n------------------\n\n**WAnt to reproduce the analysis of the video above !?** Give it a try in your own browser through this url: https://grid2viz-neurips.herokuapp.com/ \n\n------------------\n\n## Demo Gallery\n<!--- #[](https://mybinder.org/v2/gh/mjothy/grid2viz/jupyter_dash?urlpath=lab)#if launching jupyter lab directly-->\n\nYou can otherwise launch a longer demo in your web navigator by running the Grid2viz_demo notebook through Binder by clicking the Binder button. The[Demo repositories used here presents the **best agent results of NeurIPS 2020 L2RPN Competition** .\n\n<!---[](https://mybinder.org/v2/gh/mjothy/grid2viz/master/?urlpath=git-pull?repo=https://github.com/marota/Grid2viz-dataset-NeurIPS-Robustness%26amp%3Burlpath=tree/../%26amp%3Burlpath=tree/Grid2Viz_demo.ipynb%3Fautodecode)--><!--- 1rst urlpath to download the dataset from a new github - 2nd urlpath to get back to a parent root directory - 3rd urlpath to directly load the notebook -->\n[](https://mybinder.org/v2/gh/marota/Grid2viz-dataset-NeurIPS-Robustness/HEAD)\nOne third IEEE118 region NeurIPS Robustness Track Demo - [Demo repository](https://github.com/marota/Grid2viz-dataset-NeurIPS-Robustness) here\n\n\n[](https://mybinder.org/v2/gh/marota/Grid2viz-dataset-NeurIPS-Adaptability/HEAD) \nIEEE118 NeurIPS Adaptability Track Demo - [Demo repository](https://github.com/marota/Grid2viz-dataset-NeurIPS-Adaptability) here.\n\n\n\n## Documentation\ngo to: https://grid2viz.readthedocs.io/en/latest/\n\n## Installation\n### Requirements:\n* Python >= 3.6\n\n#### (Optional, recommended) Step 1: Create a virtual environment\n```commandline\npip3 install -U virtualenv\npython3 -m virtualenv venv_grid2viz\n```\n\n#### Step 2: Install from pypi\n```commandline\nsource venv_grid2viz/bin/activate\npip install -U grid2viz\n```\n\n\n#### Step 2 (bis): Install from sources\n```commandline\nsource venv_grid2viz/bin/activate\ngit clone https://github.com/rte-france/grid2viz.git\ncd grid2Viz/\npip install -U\n```\n\n\n## Run Grid2Viz\n```\nusage: grid2viz [-h] [--agents_path AGENTS_PATH] [--env_path ENV_PATH]\n [--port PORT] [--debug]\n\nGrid2Viz\n\noptional arguments:\n -h, --help show this help message and exit\n --agents_path AGENTS_PATH\n The path where the episode logs of the Agents to compare are\n stored. (default to None to study the example agents\n provided with the package)\n --env_path ENV_PATH The path where the environment config is stored.\n (default to None to use the provided default\n environment)\n --port PORT The port to serve grid2viz on. (default to 8050)\n --debug Enable debug mode for developers. (default to False)\n --n_cores Number of cores to generate cache or load cache faster (default to 1)\n --cache Create upfront all necessary cache for grid2viz, to avoid waiting for some cache generation online \n --warm-start \"If True, the application is warm started based on the parameters defined in the WARMSTART section of the config.ini file. (default to False)\n```\n\nFor example:\n\n```commandline\nsource venv_grid2viz/bin/activate\ngrid2viz --port 8000\n```\n\n> **_WARNING_** Due to the caching operation the first run can take a while. All the agents present in the configuration files\nwill be computed and then registered in cache. Depending on your agents it could take between 5 to 15min. You can follow the progress in the console.\nYou can however generate all the cache over all agents and scenarios before end with `--cache=True`\n```commandline\ngrid2viz --port 8000 --agents_path AGENTS_PATH --n_cores Max_Cores --cache \n```\n\n## Getting started\n\nIn order to use this tool, you need to have serialized the RL process of grid2op. The expected file system is :\n- root_dir (agents_path)\n - agent_1\n - scenario_1\n - scenario_2\n - agent_2\n - scenario_1\n - scenario_2\n - scenario_3\n\nEach of the scenario_* files have to contain all files given by serialisation of your RL through grid2op.\nIn order to add a new agent to the app, you will have to add the agent's folder to this root_dir\nFor the update process of this folder chain, see the section `Caching` (in particular, when you want to overwrite the current\nagents in root_dir with new versions with the same names)\n\nIn the config.ini of this repo:\n - `agents_dir` is the path to your agents logs data directory.\n - `env_dir` is the path to the environment configuration directory. It contains a single file :\n - coords.csv : The csv file that lists the coordinates of nodes in the network\n\nChanging this config.ini file will require a restart of the server to update.\n\nGrid2Viz provide 2 agents with a scenario for one day and for one month available in `/grid2viz/data/agents` folder:\n\n- do-nothing-baseline\n- greedy-baseline\n\nBy default the config.ini is targeting these agents as well as the environment configuration folders.\n\n## Caching\n\nThe cache system allows you to only compute long calculations of the app once per agent/scenario.\nThe app will create a folder `_cache` in the `base_dir` of the config.ini which will contain these long calculations serialized.\n\nIf you add a new folder in your `base_dir` (either an agent, or a scenario) you will have to restart the server so the app\nreads the folder tree again.\n\n**_WARNING_** : If you overwrite the agents while they were already cached, you will have to manually reset the cache so the app\nknows to compute everything again with the updated data. To do so, you just need to delete the `_cache` folder.\n\n## Interface\n#### Scenario Selection\nThis page display up to 15 scenarios with for each one a brief summary using the best agent's performances.\n\n\n\n\n#### Scenario Overview\nOn this page are displayed the best agent's kpi to see his performances. It's also here that you can select an agent that will\nbe used as reference agent in the other pages to compare to the studied agents.\n\n\n\n#### Agent Overview\nHere's displayed your reference agent's performances. You can select an agent to study to compare it with your reference via the\ndropdown on the page. The study agent selected will be used as study agent on the last page.\n\nIn the *\"instant and cumulated reward\"* graph you can point timestep that will be use in the next page to study\naction in a specific timestep area.\n\n\n\n\n#### Agent Study\nThe Agent Study page will display kpi of your reference agent compared to your study agent on your selected timestep area.\nYou will also see a summary of the previous page's kpi.\n\n\n\n## CONTRIBUTING\nAs agent behavior analysis is still an active field of research and new ideas can come along the way, we welcome contributions to develop:\n* new relevant visualizations (within grid2viz/grid2viz/src/kpi) \n* new interactions (see nameOfTab_clbk.py) within the application\n* existing feature improvements are also welcome.\n\n## Run the tests\n\nTo run the tests, execute the following command:\n\n```commandline\npython3 -m unittest discover --start-directory tests --buffer\n```\n\n## Limitations\nThe app is still missing a couple features, namely a graph for visualising the flow through time, and the last line of the last screen, which will show all informations regarding the actions and observations at the selected timestep.\n\nThe Actions KPIs and the distances as well as the topological action cluster \"object changed\" is in alpha feature. We will need some new features from the core API to finish these features.\n\n## Troubleshooting\n### MacOS\nSome mac users have been experimenting issues when lauching the app, raising the following message:\n\n`socket.gaierror: [Errno 8] nodename nor servname provided, or not known`\n\nThe following steps might help you to overcome the issue:\n\n1. Open your terminal\n2. Type `echo $HOST` and copy the results\n3. Open the file `/etc/hosts` and make sure you include: <br>\n `127.0.0.1 PASTE RESULTS FROM echo $HOST`\n4. Save it and close it\n5. Launch grid2viz\n\n\n",
"bugtrack_url": null,
"license": "MPL",
"summary": "Grid2Op Visualization companion app.",
"version": "1.4.1.post1",
"split_keywords": [],
"urls": [
{
"comment_text": "",
"digests": {
"blake2b_256": "e3cbadaa08bc03d9a588cf7bb47a47d82f00db15abcb0b4ed044fe78cb51d5aa",
"md5": "8ff8d45e9161fc6f320daa17ac1e8984",
"sha256": "bfa7542619019efe316ca2de7b516afa8219d0601226f072f1ab17ea6bda324c"
},
"downloads": -1,
"filename": "grid2viz-1.4.1.post1-py3-none-any.whl",
"has_sig": false,
"md5_digest": "8ff8d45e9161fc6f320daa17ac1e8984",
"packagetype": "bdist_wheel",
"python_version": "py3",
"requires_python": ">=3.7,<4.0",
"size": 21381555,
"upload_time": "2023-02-02T13:24:00",
"upload_time_iso_8601": "2023-02-02T13:24:00.899772Z",
"url": "https://files.pythonhosted.org/packages/e3/cb/adaa08bc03d9a588cf7bb47a47d82f00db15abcb0b4ed044fe78cb51d5aa/grid2viz-1.4.1.post1-py3-none-any.whl",
"yanked": false,
"yanked_reason": null
},
{
"comment_text": "",
"digests": {
"blake2b_256": "f460885479f9f84dc3e40e4c8ec67e833ce83be4669ae4d454ea5438285085d8",
"md5": "52431be72a75f83838ff45e9776cb85c",
"sha256": "4435a4e8ce071780862992342c326d11e5df9d41f3975c3d120a199b0d225ff9"
},
"downloads": -1,
"filename": "grid2viz-1.4.1.post1.tar.gz",
"has_sig": false,
"md5_digest": "52431be72a75f83838ff45e9776cb85c",
"packagetype": "sdist",
"python_version": "source",
"requires_python": ">=3.7,<4.0",
"size": 21214099,
"upload_time": "2023-02-02T13:24:34",
"upload_time_iso_8601": "2023-02-02T13:24:34.547136Z",
"url": "https://files.pythonhosted.org/packages/f4/60/885479f9f84dc3e40e4c8ec67e833ce83be4669ae4d454ea5438285085d8/grid2viz-1.4.1.post1.tar.gz",
"yanked": false,
"yanked_reason": null
}
],
"upload_time": "2023-02-02 13:24:34",
"github": false,
"gitlab": false,
"bitbucket": false,
"lcname": "grid2viz"
}
