[](https://badge.fury.io/py/hciplot)
# HCIplot
``HCIplot`` -- High-contrast Imaging Plotting library. The goal of this
library is to be the "Swiss army" solution for plotting and visualizing
multi-dimensional high-contrast imaging datacubes on ``JupyterLab``.
While visualizing FITS files is straightforward with SaoImage DS9 or any
other FITS viewer, exploring the content of an HCI datacube as an
in-memory ``numpy`` array (for example when running your ``Jupyter``
session on a remote machine) is far from easy.
``HCIplot`` contains two functions, ``plot_frames`` and ``plot_cubes``,
and relies on the ``matplotlib`` and ``HoloViews`` libraries and
``ImageMagick``. ``HCIplot`` allows to:
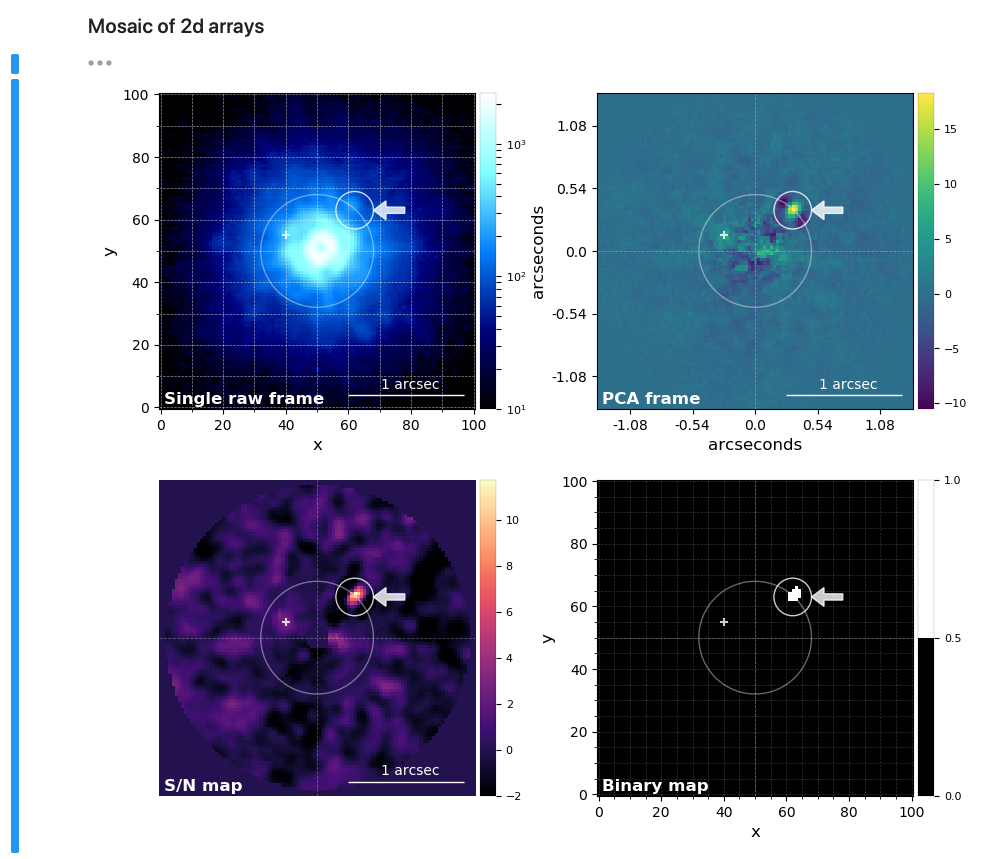
* Plot a single frame (2d array) or create a mosaic of frames.
* Annotate and save publication ready frames/mosaics.
* Visualize 2d arrays as surface plots.
* Create interactive plots when handling 3d or 4d arrays (thanks to
``HoloViews``)

* Save to disk a 3d array as an animation (gif or mp4).
## Installation
You can install ``HCIplot`` with ``pip``:
```
pip install hciplot
```
``JupyterLab`` can be installed either with ``pip`` or with ``conda``:
```
conda install -c conda-forge jupyterlab
```
The ``PyViz`` extension must be installed to display the ``holoviews``
widgets on ``JupyterLab``:
```
jupyter labextension install @pyviz/jupyterlab_pyviz
```
If you want to create animations with ``plot_cubes`` you need to install
``ImageMagick`` with your system's package manager (e.g. brew if you are
on MacOS or apt-get if you are on Ubuntu).
Raw data
{
"_id": null,
"home_page": "https://github.com/carlgogo/hciplot",
"name": "hciplot",
"maintainer": "",
"docs_url": null,
"requires_python": "",
"maintainer_email": "",
"keywords": "plotting,hci,package",
"author": "Carlos Alberto Gomez Gonzalez, Valentin Christiaens",
"author_email": "valentinchrist@hotmail.com",
"download_url": "https://files.pythonhosted.org/packages/03/a3/1eda051ae8e5035e2ebd56ca1316690527e0403bacc66c97f4f6cc2ee843/hciplot-0.2.5.tar.gz",
"platform": null,
"description": "[](https://badge.fury.io/py/hciplot)\n\n# HCIplot\n\n``HCIplot`` -- High-contrast Imaging Plotting library. The goal of this\nlibrary is to be the \"Swiss army\" solution for plotting and visualizing \nmulti-dimensional high-contrast imaging datacubes on ``JupyterLab``. \nWhile visualizing FITS files is straightforward with SaoImage DS9 or any\nother FITS viewer, exploring the content of an HCI datacube as an \nin-memory ``numpy`` array (for example when running your ``Jupyter`` \nsession on a remote machine) is far from easy. \n\n``HCIplot`` contains two functions, ``plot_frames`` and ``plot_cubes``,\nand relies on the ``matplotlib`` and ``HoloViews`` libraries and \n``ImageMagick``. ``HCIplot`` allows to:\n\n* Plot a single frame (2d array) or create a mosaic of frames.\n\n\n \n* Annotate and save publication ready frames/mosaics.\n\n* Visualize 2d arrays as surface plots.\n\n* Create interactive plots when handling 3d or 4d arrays (thanks to \n``HoloViews``)\n\n\n\n* Save to disk a 3d array as an animation (gif or mp4).\n\n\n## Installation\n\nYou can install ``HCIplot`` with ``pip``:\n\n```\npip install hciplot\n```\n\n``JupyterLab`` can be installed either with ``pip`` or with ``conda``:\n\n```\nconda install -c conda-forge jupyterlab\n```\n\nThe ``PyViz`` extension must be installed to display the ``holoviews`` \nwidgets on ``JupyterLab``:\n\n``` \njupyter labextension install @pyviz/jupyterlab_pyviz\n```\n\nIf you want to create animations with ``plot_cubes`` you need to install\n``ImageMagick`` with your system's package manager (e.g. brew if you are \non MacOS or apt-get if you are on Ubuntu). \n",
"bugtrack_url": null,
"license": "MIT",
"summary": "High-contrast Imaging Plotting library",
"version": "0.2.5",
"project_urls": {
"Download": "https://github.com/carlgogo/hciplot/archive/refs/tags/v0.1.8.tar.gz",
"Homepage": "https://github.com/carlgogo/hciplot"
},
"split_keywords": [
"plotting",
"hci",
"package"
],
"urls": [
{
"comment_text": "",
"digests": {
"blake2b_256": "b2fcc99239d855245827b4cdc13a4f68aa0e9545c4b69c98dd35f939baf30c5a",
"md5": "04b12c433e5eb6b7f92df7d123bc3d0a",
"sha256": "f68ea82bd02db21126aa831021a0a509f60d4afaced553fde49bbef917d48ae9"
},
"downloads": -1,
"filename": "hciplot-0.2.5-py2.py3-none-any.whl",
"has_sig": false,
"md5_digest": "04b12c433e5eb6b7f92df7d123bc3d0a",
"packagetype": "bdist_wheel",
"python_version": "py2.py3",
"requires_python": null,
"size": 15122,
"upload_time": "2023-08-01T16:22:17",
"upload_time_iso_8601": "2023-08-01T16:22:17.555034Z",
"url": "https://files.pythonhosted.org/packages/b2/fc/c99239d855245827b4cdc13a4f68aa0e9545c4b69c98dd35f939baf30c5a/hciplot-0.2.5-py2.py3-none-any.whl",
"yanked": false,
"yanked_reason": null
},
{
"comment_text": "",
"digests": {
"blake2b_256": "03a31eda051ae8e5035e2ebd56ca1316690527e0403bacc66c97f4f6cc2ee843",
"md5": "e9370e84b0b2db9d2c4b3a0611bad2c6",
"sha256": "e018f9a2c795db42a0006b06f5c430e7b6a488fd3773da5ab49b51a4baabe38f"
},
"downloads": -1,
"filename": "hciplot-0.2.5.tar.gz",
"has_sig": false,
"md5_digest": "e9370e84b0b2db9d2c4b3a0611bad2c6",
"packagetype": "sdist",
"python_version": "source",
"requires_python": null,
"size": 17514,
"upload_time": "2023-08-01T16:22:19",
"upload_time_iso_8601": "2023-08-01T16:22:19.500123Z",
"url": "https://files.pythonhosted.org/packages/03/a3/1eda051ae8e5035e2ebd56ca1316690527e0403bacc66c97f4f6cc2ee843/hciplot-0.2.5.tar.gz",
"yanked": false,
"yanked_reason": null
}
],
"upload_time": "2023-08-01 16:22:19",
"github": true,
"gitlab": false,
"bitbucket": false,
"codeberg": false,
"github_user": "carlgogo",
"github_project": "hciplot",
"travis_ci": false,
"coveralls": false,
"github_actions": false,
"requirements": [],
"lcname": "hciplot"
}

