# iptables-graph
Visualize iptables packet flow as [Graphviz](https://graphviz.org) diagrams. Convert [iptables-save](https://man7.org/linux/man-pages/man8/iptables-save.8.html) output to DOT, SVG, or PNG formats.
> Inspired by [AChingYo/iptables-graph](https://github.com/AChingYo/iptables-graph)
[](https://pypi.org/project/iptables-graph/)
[](https://hub.docker.com/r/sanghaklee/iptables-graph)
[](LICENSE)
## Features
- 📊 Visualize packet flow through all iptables tables (raw, mangle, nat, filter)
- 🎨 Color-coded tables and chains for easy understanding
- 🔗 Show custom chains and jump targets
- 📤 Multiple output formats: DOT, SVG, PNG
- 🐳 Docker-based (no host dependencies!)
- 📦 PyPI package (pipx install)
## Quick Start
### Option 1: Docker (Recommended)
No installation required! Just pull and run:
```bash
# Pull from Docker Hub
docker pull sanghaklee/iptables-graph
# Use it
sudo iptables-save | docker run --rm -i sanghaklee/iptables-graph
# Generate SVG
sudo iptables-save | docker run --rm -i sanghaklee/iptables-graph -f svg > graph.svg
# Generate PNG
sudo iptables-save | docker run --rm -i sanghaklee/iptables-graph -f png > example.png
```
**Create an alias for convenience:**
```bash
# Add to ~/.bashrc or ~/.zshrc
alias iptables-graph='docker run --rm -i sanghaklee/iptables-graph'
# Now use it like a regular command
sudo iptables-save | iptables-graph
sudo iptables-save | iptables-graph -f svg > graph.svg
```
### Option 2: PyPI Package
Install via pip:
```bash
pipx install iptables-graph
```
Use it:
```bash
# Generate DOT format
sudo iptables-save | iptables-graph > graph.dot
# Generate SVG (requires graphviz installed)
sudo iptables-save | iptables-graph -f svg > graph.svg
# Generate PNG (requires graphviz installed)
sudo iptables-save | iptables-graph -f png > example.png
```
**Note**: For SVG/PNG conversion, you need to install graphviz:
```bash
# Debian/Ubuntu
sudo apt-get install graphviz
# RHEL/CentOS
sudo yum install graphviz
# macOS
brew install graphviz
```
## Usage
### Basic DOT Output
```bash
sudo iptables-save | iptables-graph
```
Output:
```dot
digraph {
graph [pad="0.5", nodesep="0.5", ranksep="2"];
node [shape=plain]
rankdir=LR;
...
}
```
### Generate SVG Diagram
```bash
sudo iptables-save | iptables-graph -f svg > graph.svg
```
### Generate PNG Image
```bash
sudo iptables-save | iptables-graph -f png > example.png
```
### Read from File
```bash
# Save iptables rules to file
sudo iptables-save > rules.txt
# Generate diagram
cat rules.txt | iptables-graph -f svg > diagram.svg
```
### Using with Docker Volumes
```bash
# For file input/output with Docker
docker run --rm sanghaklee/iptables-graph \
-v $(pwd):/data
-i /data/iptables-save.txt
-f svg
-o /data/diagram.svg
```
## Command Line Options
```
usage: iptables-graph [-h] [-i INPUT] [-o OUTPUT] [-f {dot,svg,png}]
iptables-save output → Graphviz converter (dot/svg/png)
optional arguments:
-h, --help show this help message and exit
-i INPUT, --input INPUT
Input file (default: stdin)
-o OUTPUT, --output OUTPUT
Output file (default: stdout)
-f {dot,svg,png}, --format {dot,svg,png}
Output format: dot (default), svg, or png
```
## Example Output
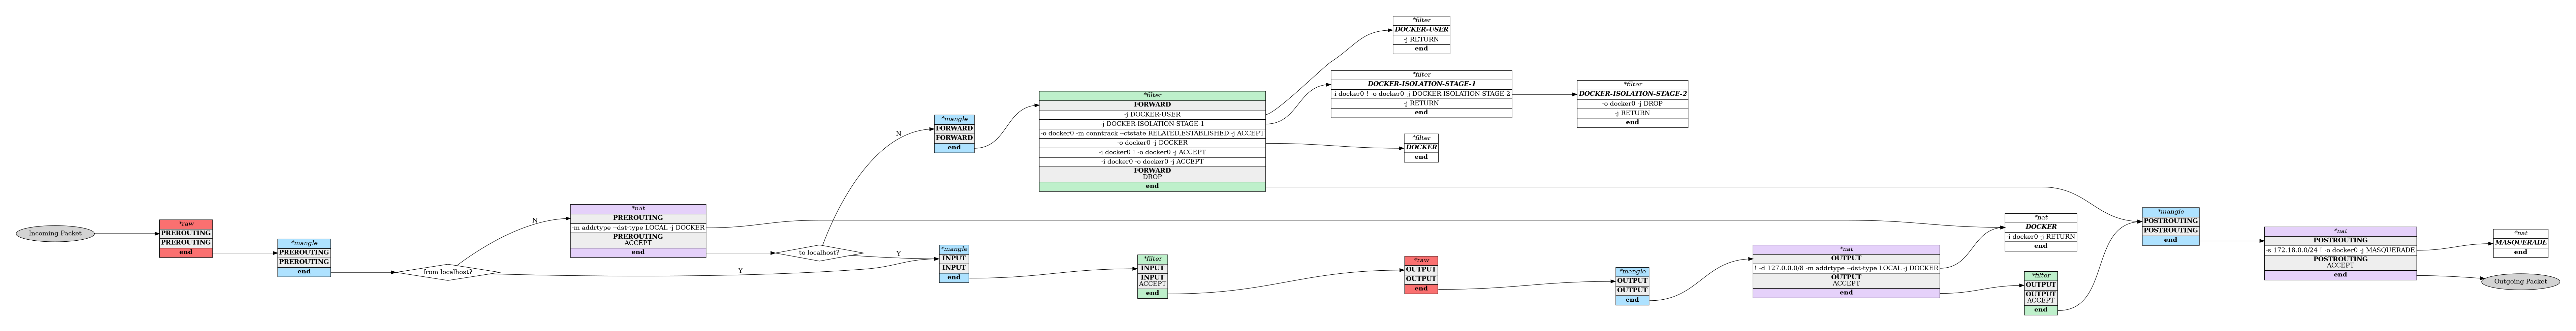
### Color Scheme
- 🔴 **raw** table: Red (#FA7070)
- 🔵 **mangle** table: Blue (#AEE2FF)
- 🟣 **nat** table: Purple (#E5D1FA)
- 🟢 **filter** table: Green (#BEF0CB)
## How It Works
1. **Parse** `iptables-save` output to extract rules, chains, and policies
2. **Generate** Graphviz DOT format with color-coded tables
3. **Convert** (optional) to SVG or PNG using graphviz
## Requirements
### Docker Method
- Docker only
### PyPI Method
- Python 3.7+
- Graphviz (optional, for SVG/PNG conversion)
## Contributing
Contributions are welcome! Please see [CONTRIBUTING.md](CONTRIBUTING.md) for development setup, building, and release process.
## License
[MIT License](LICENSE)
## Links
- PyPI: https://pypi.org/project/iptables-graph/
- Docker Hub: https://hub.docker.com/r/sanghaklee/iptables-graph
- GitHub: https://github.com/SangHakLee/iptables-graph
- Issues: https://github.com/SangHakLee/iptables-graph/issues
Raw data
{
"_id": null,
"home_page": "https://github.com/SangHakLee/iptables-graph",
"name": "iptables-graph",
"maintainer": null,
"docs_url": null,
"requires_python": "<4.0,>=3.7",
"maintainer_email": null,
"keywords": "iptables, firewall, visualization, graphviz, network, security",
"author": "sanghaklee",
"author_email": "code.ryan.lee@gmail.com",
"download_url": "https://files.pythonhosted.org/packages/6d/03/814f31de10833fe96a4743bd8f4750bd88e08c38fae855ae85f2831913f9/iptables_graph-1.0.0.tar.gz",
"platform": null,
"description": "# iptables-graph\n\nVisualize iptables packet flow as [Graphviz](https://graphviz.org) diagrams. Convert [iptables-save](https://man7.org/linux/man-pages/man8/iptables-save.8.html) output to DOT, SVG, or PNG formats.\n\n> Inspired by [AChingYo/iptables-graph](https://github.com/AChingYo/iptables-graph)\n\n[](https://pypi.org/project/iptables-graph/)\n[](https://hub.docker.com/r/sanghaklee/iptables-graph)\n[](LICENSE)\n\n## Features\n\n- \ud83d\udcca Visualize packet flow through all iptables tables (raw, mangle, nat, filter)\n- \ud83c\udfa8 Color-coded tables and chains for easy understanding\n- \ud83d\udd17 Show custom chains and jump targets\n- \ud83d\udce4 Multiple output formats: DOT, SVG, PNG\n- \ud83d\udc33 Docker-based (no host dependencies!)\n- \ud83d\udce6 PyPI package (pipx install)\n\n## Quick Start\n\n### Option 1: Docker (Recommended)\n\nNo installation required! Just pull and run:\n\n```bash\n# Pull from Docker Hub\ndocker pull sanghaklee/iptables-graph\n\n# Use it\nsudo iptables-save | docker run --rm -i sanghaklee/iptables-graph\n\n# Generate SVG\nsudo iptables-save | docker run --rm -i sanghaklee/iptables-graph -f svg > graph.svg\n\n# Generate PNG\nsudo iptables-save | docker run --rm -i sanghaklee/iptables-graph -f png > example.png\n```\n\n**Create an alias for convenience:**\n\n```bash\n# Add to ~/.bashrc or ~/.zshrc\nalias iptables-graph='docker run --rm -i sanghaklee/iptables-graph'\n\n# Now use it like a regular command\nsudo iptables-save | iptables-graph\nsudo iptables-save | iptables-graph -f svg > graph.svg\n```\n\n### Option 2: PyPI Package\n\nInstall via pip:\n\n```bash\npipx install iptables-graph\n```\n\nUse it:\n\n```bash\n# Generate DOT format\nsudo iptables-save | iptables-graph > graph.dot\n\n# Generate SVG (requires graphviz installed)\nsudo iptables-save | iptables-graph -f svg > graph.svg\n\n# Generate PNG (requires graphviz installed)\nsudo iptables-save | iptables-graph -f png > example.png\n```\n\n**Note**: For SVG/PNG conversion, you need to install graphviz:\n```bash\n# Debian/Ubuntu\nsudo apt-get install graphviz\n\n# RHEL/CentOS\nsudo yum install graphviz\n\n# macOS\nbrew install graphviz\n```\n\n## Usage\n\n### Basic DOT Output\n\n```bash\nsudo iptables-save | iptables-graph\n```\n\nOutput:\n```dot\ndigraph {\n graph [pad=\"0.5\", nodesep=\"0.5\", ranksep=\"2\"];\n node [shape=plain]\n rankdir=LR;\n ...\n}\n```\n\n### Generate SVG Diagram\n\n```bash\nsudo iptables-save | iptables-graph -f svg > graph.svg\n```\n\n### Generate PNG Image\n\n```bash\nsudo iptables-save | iptables-graph -f png > example.png\n```\n\n### Read from File\n\n```bash\n# Save iptables rules to file\nsudo iptables-save > rules.txt\n\n# Generate diagram\ncat rules.txt | iptables-graph -f svg > diagram.svg\n```\n\n### Using with Docker Volumes\n\n```bash\n# For file input/output with Docker\ndocker run --rm sanghaklee/iptables-graph \\\n -v $(pwd):/data\n -i /data/iptables-save.txt \n -f svg \n -o /data/diagram.svg\n```\n\n## Command Line Options\n\n```\nusage: iptables-graph [-h] [-i INPUT] [-o OUTPUT] [-f {dot,svg,png}]\n\niptables-save output \u2192 Graphviz converter (dot/svg/png)\n\noptional arguments:\n -h, --help show this help message and exit\n -i INPUT, --input INPUT\n Input file (default: stdin)\n -o OUTPUT, --output OUTPUT\n Output file (default: stdout)\n -f {dot,svg,png}, --format {dot,svg,png}\n Output format: dot (default), svg, or png\n```\n\n## Example Output\n\n\n\n### Color Scheme\n\n- \ud83d\udd34 **raw** table: Red (#FA7070)\n- \ud83d\udd35 **mangle** table: Blue (#AEE2FF)\n- \ud83d\udfe3 **nat** table: Purple (#E5D1FA)\n- \ud83d\udfe2 **filter** table: Green (#BEF0CB)\n\n## How It Works\n\n1. **Parse** `iptables-save` output to extract rules, chains, and policies\n2. **Generate** Graphviz DOT format with color-coded tables\n3. **Convert** (optional) to SVG or PNG using graphviz\n\n## Requirements\n\n### Docker Method\n- Docker only\n\n### PyPI Method\n- Python 3.7+\n- Graphviz (optional, for SVG/PNG conversion)\n\n## Contributing\n\nContributions are welcome! Please see [CONTRIBUTING.md](CONTRIBUTING.md) for development setup, building, and release process.\n\n## License\n\n[MIT License](LICENSE)\n\n## Links\n\n- PyPI: https://pypi.org/project/iptables-graph/\n- Docker Hub: https://hub.docker.com/r/sanghaklee/iptables-graph\n- GitHub: https://github.com/SangHakLee/iptables-graph\n- Issues: https://github.com/SangHakLee/iptables-graph/issues\n\n",
"bugtrack_url": null,
"license": "MIT",
"summary": "Visualize iptables packet flow as Graphviz diagrams",
"version": "1.0.0",
"project_urls": {
"Homepage": "https://github.com/SangHakLee/iptables-graph",
"Repository": "https://github.com/SangHakLee/iptables-graph"
},
"split_keywords": [
"iptables",
" firewall",
" visualization",
" graphviz",
" network",
" security"
],
"urls": [
{
"comment_text": null,
"digests": {
"blake2b_256": "bc1a72a4506fb6c7aafe6be49ecb4163d210754f2ebcfc6f02fa0700f036f83d",
"md5": "80d35cb9ed5034527a3dfdbf97e5fef9",
"sha256": "66ffbbd8c088a2d0ea4a651cd40cba3b3883a6f525efb578da09044496a2868d"
},
"downloads": -1,
"filename": "iptables_graph-1.0.0-py3-none-any.whl",
"has_sig": false,
"md5_digest": "80d35cb9ed5034527a3dfdbf97e5fef9",
"packagetype": "bdist_wheel",
"python_version": "py3",
"requires_python": "<4.0,>=3.7",
"size": 7824,
"upload_time": "2025-11-01T03:18:51",
"upload_time_iso_8601": "2025-11-01T03:18:51.812325Z",
"url": "https://files.pythonhosted.org/packages/bc/1a/72a4506fb6c7aafe6be49ecb4163d210754f2ebcfc6f02fa0700f036f83d/iptables_graph-1.0.0-py3-none-any.whl",
"yanked": false,
"yanked_reason": null
},
{
"comment_text": null,
"digests": {
"blake2b_256": "6d03814f31de10833fe96a4743bd8f4750bd88e08c38fae855ae85f2831913f9",
"md5": "7320b417cb3ae09ee4a9e85a1fcc884d",
"sha256": "d8659345a5ddf6af5be67d215827f2943887b2df7a3bc1bf265e672c9a687958"
},
"downloads": -1,
"filename": "iptables_graph-1.0.0.tar.gz",
"has_sig": false,
"md5_digest": "7320b417cb3ae09ee4a9e85a1fcc884d",
"packagetype": "sdist",
"python_version": "source",
"requires_python": "<4.0,>=3.7",
"size": 7119,
"upload_time": "2025-11-01T03:18:53",
"upload_time_iso_8601": "2025-11-01T03:18:53.961540Z",
"url": "https://files.pythonhosted.org/packages/6d/03/814f31de10833fe96a4743bd8f4750bd88e08c38fae855ae85f2831913f9/iptables_graph-1.0.0.tar.gz",
"yanked": false,
"yanked_reason": null
}
],
"upload_time": "2025-11-01 03:18:53",
"github": true,
"gitlab": false,
"bitbucket": false,
"codeberg": false,
"github_user": "SangHakLee",
"github_project": "iptables-graph",
"travis_ci": false,
"coveralls": false,
"github_actions": false,
"requirements": [
{
"name": "pyinstaller",
"specs": [
[
">=",
"5.0"
]
]
},
{
"name": "build",
"specs": [
[
">=",
"0.10.0"
]
]
},
{
"name": "twine",
"specs": [
[
">=",
"4.0.0"
]
]
}
],
"lcname": "iptables-graph"
}

