| Name | klv-system-monitor JSON |
| Version |
0.1.4
 JSON
JSON |
| download |
| home_page | None |
| Summary | Cross-platform-ish system monitor (tested on Linux & Windows). Clean PyQt UI for CPU, memory, network and filesystems. |
| upload_time | 2025-08-30 18:44:39 |
| maintainer | None |
| docs_url | None |
| author | None |
| requires_python | >=3.9 |
| license | MIT License
Copyright (c) 2025 Karel López Vilaret (TimeMatters)
Permission is hereby granted, free of charge, to any person obtaining a copy
of this software and associated documentation files (the "Software"), to deal
in the Software without restriction, including without limitation the rights
to use, copy, modify, merge, publish, distribute, sublicense, and/or sell
copies of the Software, and to permit persons to whom the Software is
furnished to do so, subject to the following conditions:
The above copyright notice and this permission notice shall be included in all
copies or substantial portions of the Software.
THE SOFTWARE IS PROVIDED "AS IS", WITHOUT WARRANTY OF ANY KIND, EXPRESS OR
IMPLIED, INCLUDING BUT NOT LIMITED TO THE WARRANTIES OF MERCHANTABILITY,
FITNESS FOR A PARTICULAR PURPOSE AND NONINFRINGEMENT. IN NO EVENT SHALL THE
AUTHORS OR COPYRIGHT HOLDERS BE LIABLE FOR ANY CLAIM, DAMAGES OR OTHER
LIABILITY, WHETHER IN AN ACTION OF CONTRACT, TORT OR OTHERWISE, ARISING FROM,
OUT OF OR IN CONNECTION WITH THE SOFTWARE OR THE USE OR OTHER DEALINGS IN THE
SOFTWARE.
|
| keywords |
system monitor
monitoring
psutil
pyqt5
pyqtgraph
cpu
memory
network
filesystem
linux
windows
|
| VCS |
 |
| bugtrack_url |
|
| requirements |
No requirements were recorded.
|
| Travis-CI |
No Travis.
|
| coveralls test coverage |
No coveralls.
|
# KLV-System-Monitor
**KLV System Monitor** is a lightweight system monitor written in Python (PyQt5 + psutil) with a focus on **clarity, low overhead, and control**.
It takes inspiration from **GNOME/Ubuntu System Monitor** and brings a similarly clean experience to **Linux and Windows**, while adding features that were missing elsewhere.
- **Three CPU views**: **Multi thread**, **General view**, and **Multi window** (selectable in **Preferences**).
- **Configurable smoothing and refresh**: decoupled refresh rates for plots vs. text/labels; per-subsystem EMA alphas (CPU, memory, network).
- **Tunable visuals**: line width, colors (per-core or mono), grid toggles, antialiasing, translucent fill for CPU areas, and frequency labels per core.
- **Efficient updates**: process table refreshes **only when visible**; file systems view refreshes **on demand**.
- **Power tools**: filter and sort processes; clear current selection (stop following) and **kill selected** (when permitted).
---
<p align="center">
💡 <b>If you find this project useful, please give it a ⭐ Star and consider 👁 Watch to get updates on new releases.</b><br>
Your support helps me improve and keep adding features 🚀
</p>
---
## Feature tour
### 1) CPU — General view (single curve)
Shows total CPU usage over the last 60 seconds with a fixed **0–100%** Y-axis.
The average CPU frequency, CPU temperature (when supported) and total CPU usage are displayed beneath the chart.
Smoothing (EMA) and antialiasing can be enabled/disabled in **Preferences**.
**How to read this view**
- **X-axis**: time window (seconds).
- **Y-axis**: total CPU utilization (%).
- **Footer**: average CPU frequency across cores, CPU temperature (if supported), and total CPU usage.
---
### 2) CPU — Multi-thread view (all cores)
Per-CPU utilization is plotted **simultaneously**, one colored line per core/thread.
Each legend entry shows **CPU name → current % and frequency** (if frequency display is enabled).
Line thickness, colors, smoothing and grids are configurable in **Preferences**.
**Tips**
- Colors are persistent and can be customized.
- Toggle extra smoothing for a look similar to GNOME System Monitor.
---
### 3) CPU — Parallel processes tracking
An example of a parallel workload starting and ramping up.
You can see how multiple threads pick up work at the same time and how the smoothing avoids jagged spikes while keeping short-term dynamics readable.
---
### 4) CPU — Multi-window per-core view
Compact **grid of mini-plots**: one small chart per core.
Great for many-core systems; the grid is scrollable and the number of columns is configurable.
You can optionally show axes, match label color to plot color, or use a mono color for all mini-plots.
---
### 5) Memory, Swap and Network
Two stacked panels:
- **Memory & Swap**: filled area chart with used memory and cache; swap status is shown on the right.
- **Network**: receive/send rates (per second) plus totals since the start of the session.
Both panels support optional EMA smoothing and gridlines.
---
### 6) File Systems tab
Overview of mounted file systems and low-level disk I/O:
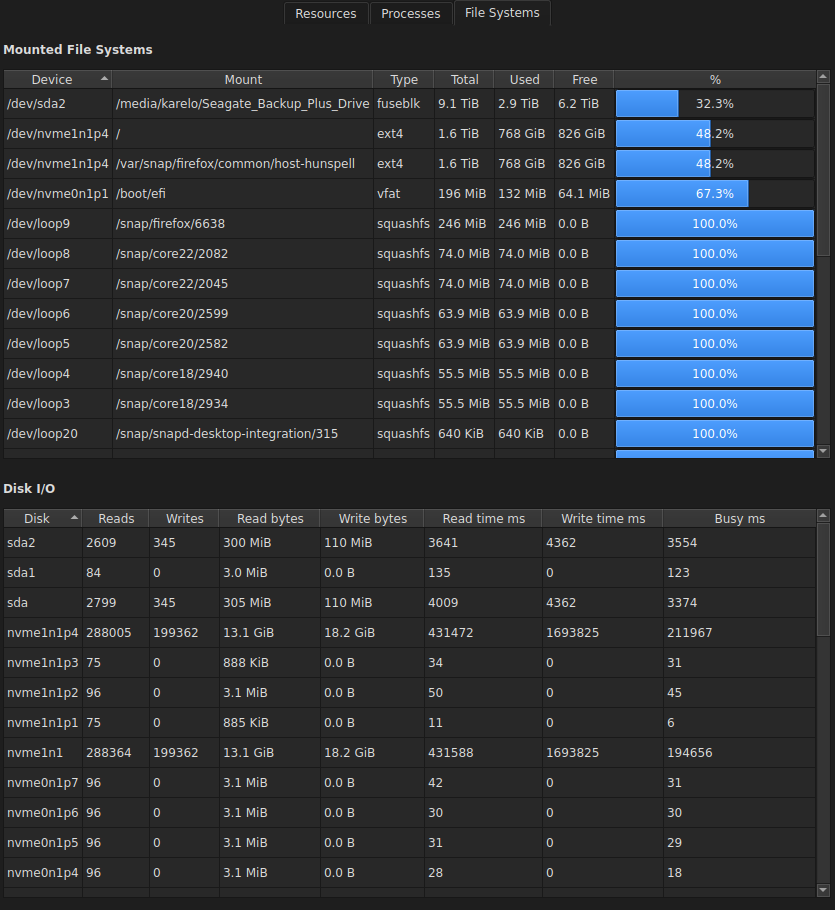
**Mounted File Systems**
- Columns: **Device**, **Mount**, **Type**, **Total**, **Used**, **Free**, **%**.
- The percentage column includes a horizontal utilization bar.
**Disk I/O**
- Per-disk counters since boot: **reads / writes / read bytes / write bytes / read time / write time / busy ms**.
---
### 7) Processes tab
A fast, filterable process table that updates only when the tab is visible (to reduce overhead).
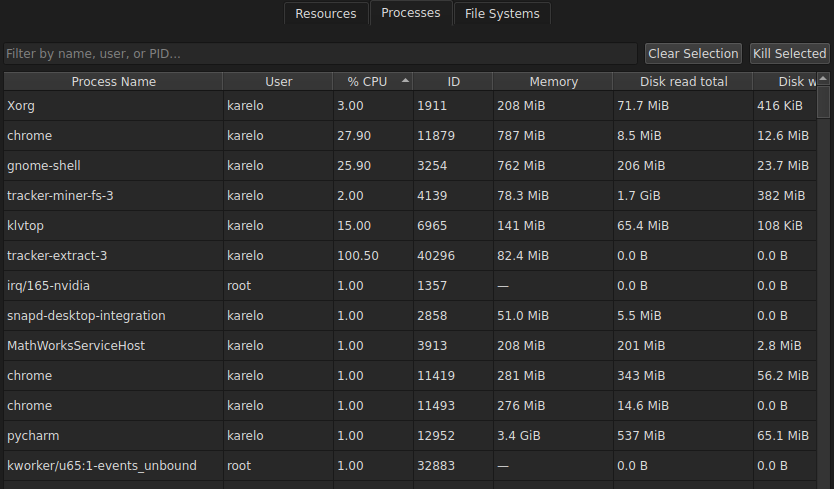
**Features**
- **Filter box** (top-left): search by process name, user, or PID.
- Click column headers to **sort** (ascending/descending).
- Columns: **Process Name**, **User**, **% CPU**, **PID**, **Memory**, **Disk read total**, **Disk write total**, …
- **Clear Selection**: stops following the current process (if you were tracking one).
- **Kill Selected**: terminates selected processes (requires sufficient permissions).
The refresh interval of this tab is configurable in **Preferences**.
---
### 8) Preferences
All performance, smoothing and UI options in one place:
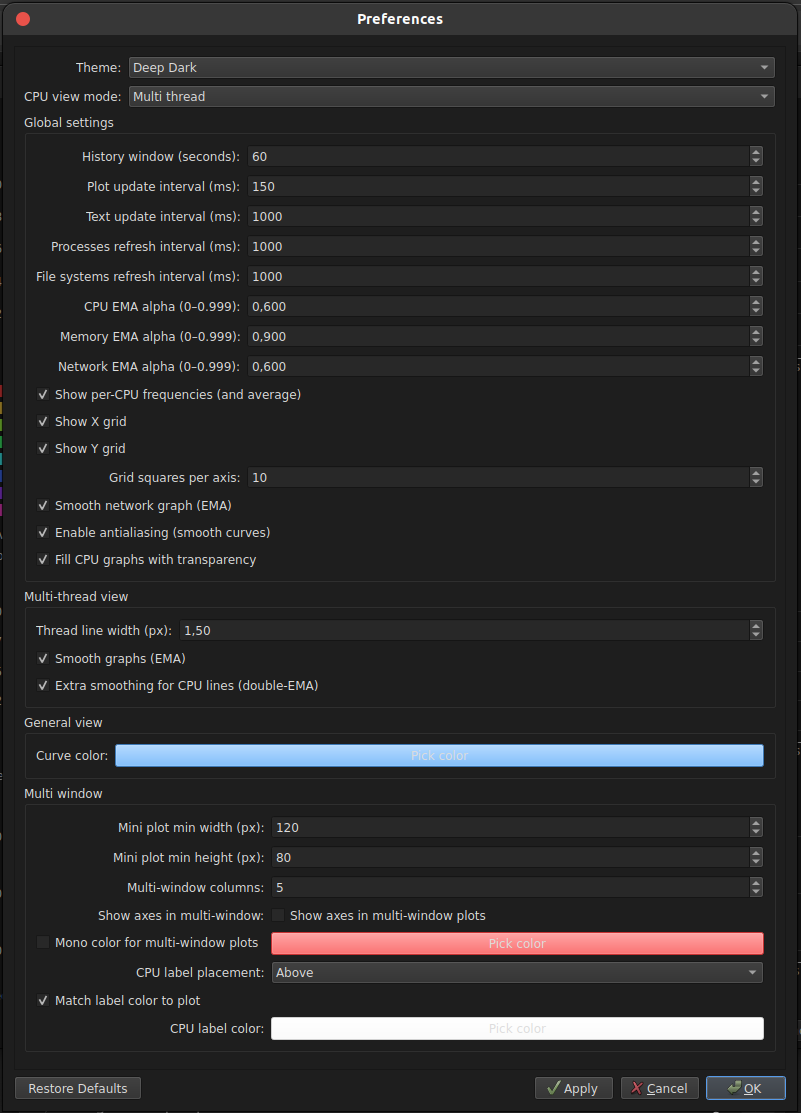
**Global settings**
- **History window (seconds)** — width of the time window.
- **Plot update interval (ms)** — how often lines are redrawn.
- **Text update interval (ms)** — how often labels (%/GHz) refresh.
- **Processes refresh interval (ms)**, **File systems refresh interval (ms)** — decoupled from plot updates.
- **CPU / Memory / Network EMA alpha** — smoothing strength (0–0.999).
- **Show per-CPU frequencies (and average)** — overlay GHz per core + mean.
- **Show X/Y grid**, **Grid squares per axis**.
- **Smooth network graph (EMA)**, **Enable antialiasing**, **Fill CPU graphs with transparency**.
**Multi-thread view**
- **Thread line width (px)**.
- **Smooth graphs (EMA)** and **Extra smoothing for CPU lines (double-EMA)**.
**General view**
- **Curve color** for the single-curve CPU view.
**Multi-window**
- **Mini plot min width/height (px)**, **columns count** (grid layout).
- **Show axes in multi-window plots**.
- **Mono color for multi-window plots** (or per-core colors).
- **CPU label placement** and **Match label color to plot**.
Footer buttons: **Restore Defaults**, **Apply**, **Cancel**, **OK**.
---
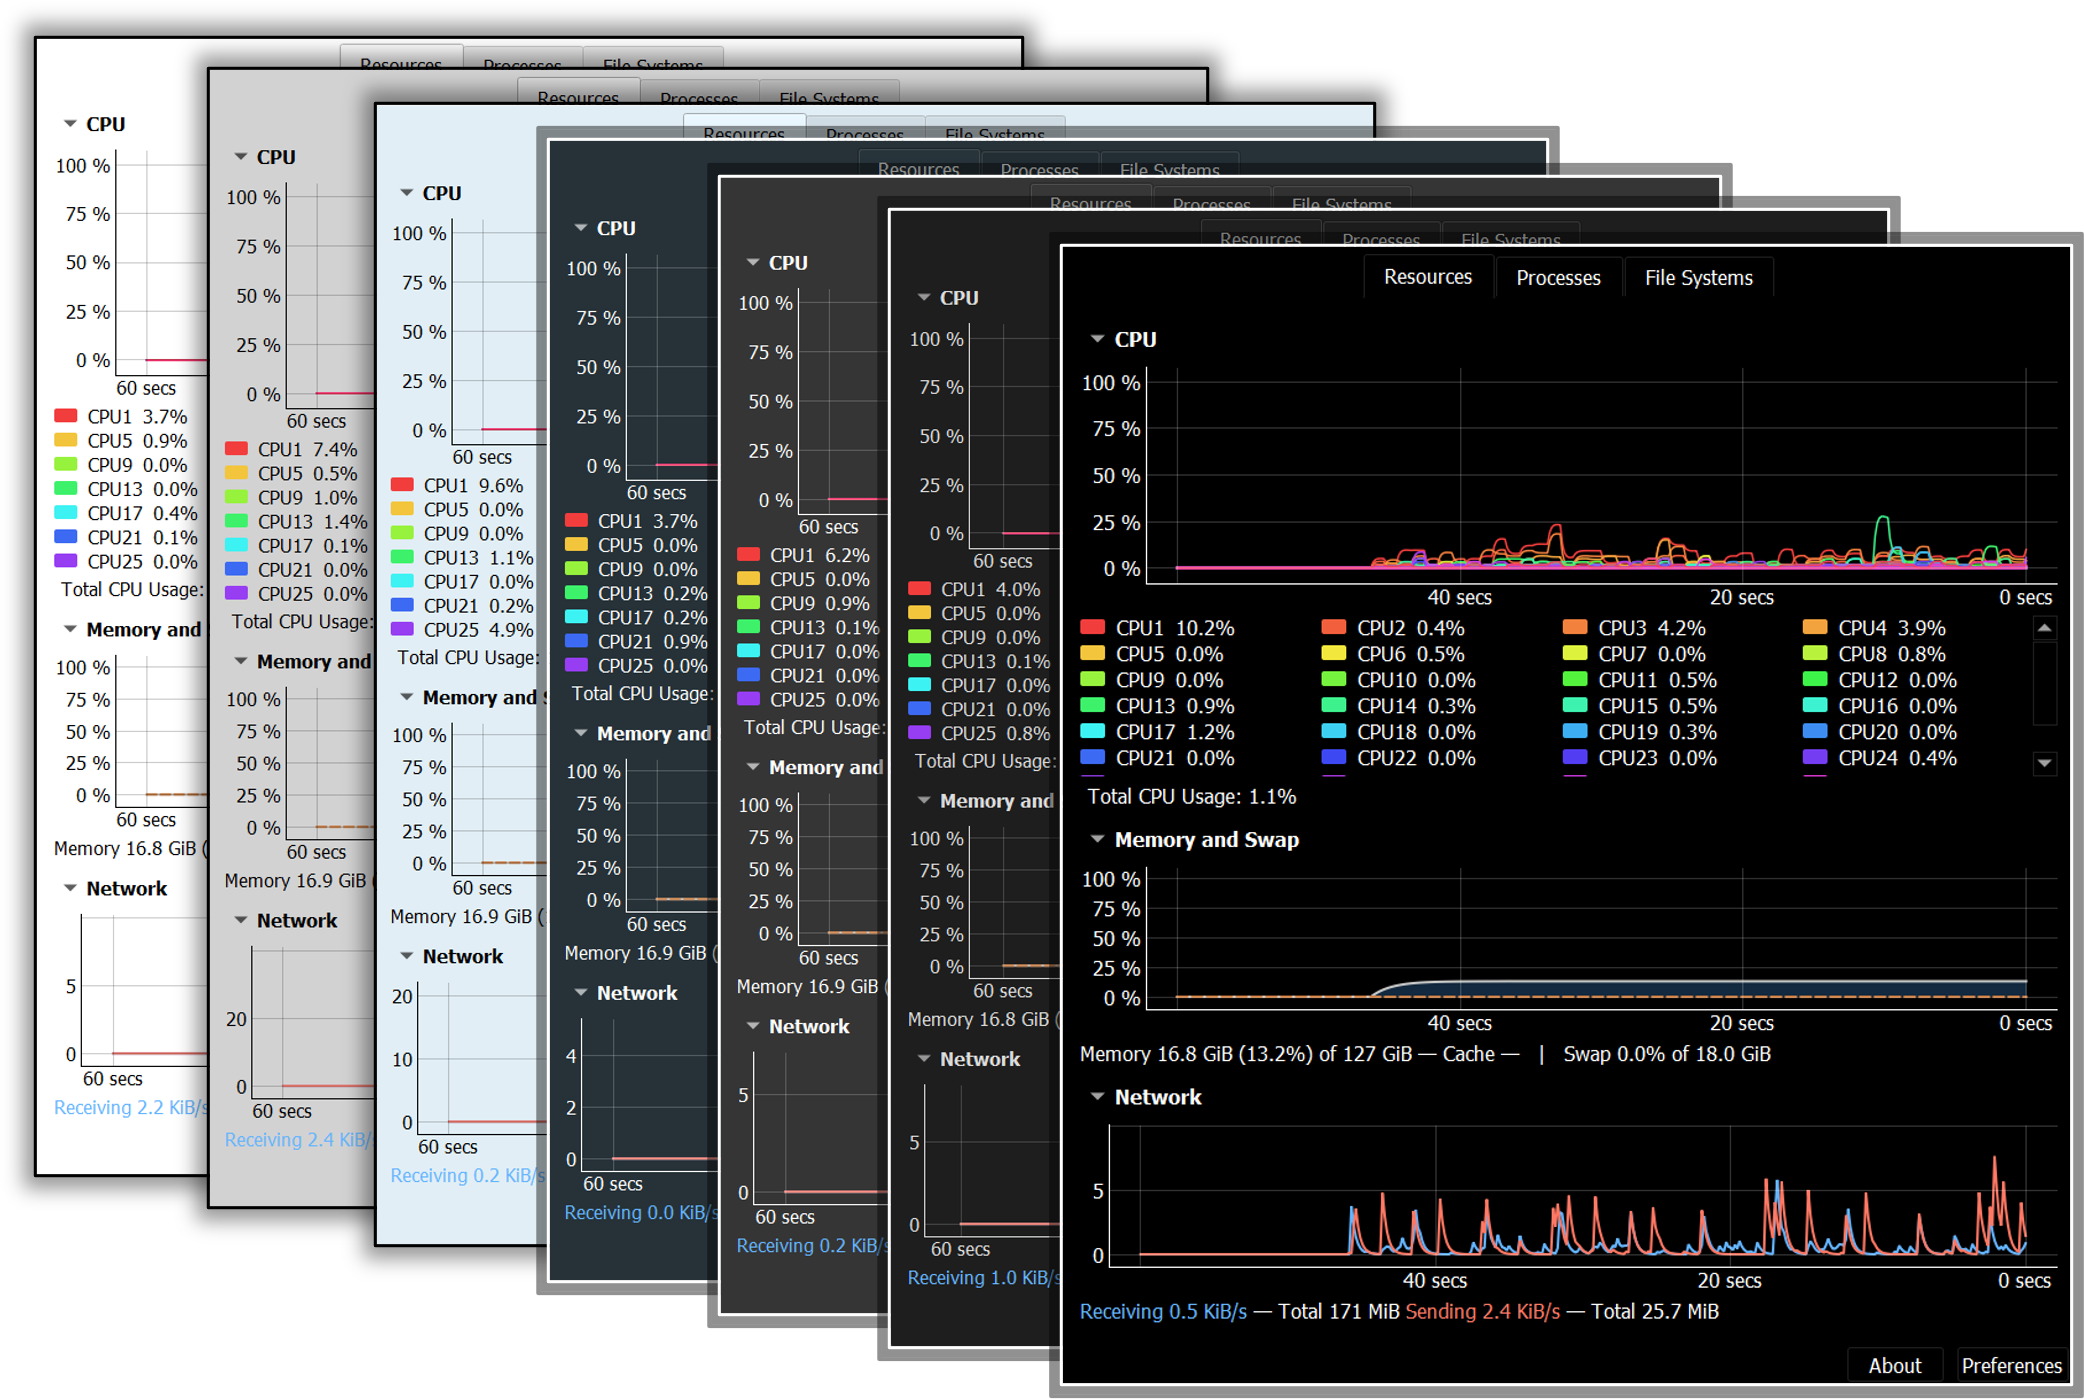
### Themes & Appearance
KLV System Monitor ships with multiple built-in themes ranging from light to deep dark.
Charts, legends and UI widgets adapt automatically to the selected theme to preserve contrast and readability.
<!-- If you want it to also render on PyPI, use a raw GitHub URL instead:
-->
**Highlights**
- **Theme selector** in **Preferences → Theme** (instant preview).
- High-contrast palettes for per-CPU lines and legends in both light and dark modes.
- Optional **antialiasing** for extra-smooth curves (toggle in Preferences).
- Grid visibility (X/Y), line width, mono/per-core colors, and label color matching are all configurable.
- The general CPU view keeps a fixed **0–100%** Y-axis for consistent reading across themes.
---
## Requirements
| Software | Minimum Version | Notes |
|----------|-----------------|---------------------------------------------------------|
| **Python** | 3.10 | Installed automatically if you use the one-click installers |
---
## Installation
You can install KLV System Monitor in two ways:
### 1. One-click installers <sup>(recommended)</sup>
1. **Download** the ZIP package:
**[📦 One-click Installers](https://github.com/karellopez/KLV-System-Monitor/raw/main/Installers/Installers.zip
)**
2. **Extract** the ZIP file and run the script for your operating system:
| OS | Script | How to Run | Duration |
|------------------|----------------------------------|--------------------------------------------------------------------------------------------------------------------------------------------------------------------------------------------------------------------|---------|
| **Windows 10/11**| `install_klv_system_monitor.bat` | Double-click. This will open a terminal and the installation will start.<br/>If you are not familiar to terminals, please, do not be afraid. <br/>This script do not have any permission to make undesired things. | ≈ 5 min |
| **Linux** | `install_klv_system_monitor.sh` | Open a terminal in the path of the installer and type: <br/>`./klv_system_monitor.sh` | ≈ 5 min |
3. After the installation finishes, you will find two shortcuts on your desktop:
| OS | Launch | Uninstall |
|-------------|-----------------------------------|---------------------------------|
| **Windows** | `run_KLVSystemMonitor.bat` | `uninstall_KLVSystemMonitor.bat` |
| **Linux** | **KLV System Monitor** (launcher) | `Uninstall KLV System Monitor` |
---
### 2. Install in a virtual environment (advanced)
```bash
# 1. Create a virtual environment
python3 -m venv <env_name>
# 2. Activate it
source <env_name>/bin/activate # On Windows: <env_name>\Scripts\activate
# 3. Install BIDS Manager from GitHub
pip install klv-system-monitor
```
The package declares all dependencies, so installation
pulls everything required to run the GUI and helper scripts.
All core requirements are version pinned in `pyproject.toml` to ensure
consistent installations.
After installation the following commands become available:
- `klvtop` – main GUI containing all KLV System Monitor functionalities
Raw data
{
"_id": null,
"home_page": null,
"name": "klv-system-monitor",
"maintainer": null,
"docs_url": null,
"requires_python": ">=3.9",
"maintainer_email": null,
"keywords": "system monitor, monitoring, psutil, PyQt5, pyqtgraph, CPU, memory, network, filesystem, Linux, Windows",
"author": null,
"author_email": "Karel L\u00f3pez Vilaret <karel.mauricio.lopez.vilaret@uni-oldenburg.de>",
"download_url": "https://files.pythonhosted.org/packages/74/03/f7d7d05a32d77becc351d87d26136c81af1d68ebe59c0a41c113a02e4a6e/klv_system_monitor-0.1.4.tar.gz",
"platform": null,
"description": "# KLV-System-Monitor\n\n**KLV System Monitor** is a lightweight system monitor written in Python (PyQt5 + psutil) with a focus on **clarity, low overhead, and control**. \nIt takes inspiration from **GNOME/Ubuntu System Monitor** and brings a similarly clean experience to **Linux and Windows**, while adding features that were missing elsewhere.\n\n- **Three CPU views**: **Multi thread**, **General view**, and **Multi window** (selectable in **Preferences**).\n- **Configurable smoothing and refresh**: decoupled refresh rates for plots vs. text/labels; per-subsystem EMA alphas (CPU, memory, network).\n- **Tunable visuals**: line width, colors (per-core or mono), grid toggles, antialiasing, translucent fill for CPU areas, and frequency labels per core.\n- **Efficient updates**: process table refreshes **only when visible**; file systems view refreshes **on demand**.\n- **Power tools**: filter and sort processes; clear current selection (stop following) and **kill selected** (when permitted).\n\n---\n\n<p align=\"center\">\n \ud83d\udca1 <b>If you find this project useful, please give it a \u2b50 Star and consider \ud83d\udc41 Watch to get updates on new releases.</b><br>\n Your support helps me improve and keep adding features \ud83d\ude80\n</p>\n\n---\n\n\n## Feature tour\n\n### 1) CPU \u2014 General view (single curve)\nShows total CPU usage over the last 60 seconds with a fixed **0\u2013100%** Y-axis.\n The average CPU frequency, CPU temperature (when supported) and total CPU usage are displayed beneath the chart.\nSmoothing (EMA) and antialiasing can be enabled/disabled in **Preferences**.\n\n\n\n**How to read this view**\n- **X-axis**: time window (seconds). \n- **Y-axis**: total CPU utilization (%). \n- **Footer**: average CPU frequency across cores, CPU temperature (if supported), and total CPU usage.\n\n---\n\n### 2) CPU \u2014 Multi-thread view (all cores)\nPer-CPU utilization is plotted **simultaneously**, one colored line per core/thread. \nEach legend entry shows **CPU name \u2192 current % and frequency** (if frequency display is enabled). \nLine thickness, colors, smoothing and grids are configurable in **Preferences**.\n\n\n\n**Tips**\n- Colors are persistent and can be customized. \n- Toggle extra smoothing for a look similar to GNOME System Monitor.\n\n---\n\n### 3) CPU \u2014 Parallel processes tracking\nAn example of a parallel workload starting and ramping up. \nYou can see how multiple threads pick up work at the same time and how the smoothing avoids jagged spikes while keeping short-term dynamics readable.\n\n\n\n---\n\n### 4) CPU \u2014 Multi-window per-core view\nCompact **grid of mini-plots**: one small chart per core. \nGreat for many-core systems; the grid is scrollable and the number of columns is configurable. \nYou can optionally show axes, match label color to plot color, or use a mono color for all mini-plots.\n\n\n\n---\n\n### 5) Memory, Swap and Network\nTwo stacked panels:\n- **Memory & Swap**: filled area chart with used memory and cache; swap status is shown on the right. \n- **Network**: receive/send rates (per second) plus totals since the start of the session. \nBoth panels support optional EMA smoothing and gridlines.\n\n\n\n---\n\n### 6) File Systems tab\nOverview of mounted file systems and low-level disk I/O:\n\n\n\n**Mounted File Systems**\n- Columns: **Device**, **Mount**, **Type**, **Total**, **Used**, **Free**, **%**. \n- The percentage column includes a horizontal utilization bar.\n\n**Disk I/O**\n- Per-disk counters since boot: **reads / writes / read bytes / write bytes / read time / write time / busy ms**.\n\n---\n\n### 7) Processes tab\nA fast, filterable process table that updates only when the tab is visible (to reduce overhead).\n\n\n\n**Features**\n- **Filter box** (top-left): search by process name, user, or PID. \n- Click column headers to **sort** (ascending/descending). \n- Columns: **Process Name**, **User**, **% CPU**, **PID**, **Memory**, **Disk read total**, **Disk write total**, \u2026 \n- **Clear Selection**: stops following the current process (if you were tracking one). \n- **Kill Selected**: terminates selected processes (requires sufficient permissions).\n\nThe refresh interval of this tab is configurable in **Preferences**.\n\n---\n\n### 8) Preferences\nAll performance, smoothing and UI options in one place:\n\n\n\n**Global settings**\n- **History window (seconds)** \u2014 width of the time window. \n- **Plot update interval (ms)** \u2014 how often lines are redrawn. \n- **Text update interval (ms)** \u2014 how often labels (%/GHz) refresh. \n- **Processes refresh interval (ms)**, **File systems refresh interval (ms)** \u2014 decoupled from plot updates. \n- **CPU / Memory / Network EMA alpha** \u2014 smoothing strength (0\u20130.999). \n- **Show per-CPU frequencies (and average)** \u2014 overlay GHz per core + mean. \n- **Show X/Y grid**, **Grid squares per axis**. \n- **Smooth network graph (EMA)**, **Enable antialiasing**, **Fill CPU graphs with transparency**.\n\n**Multi-thread view**\n- **Thread line width (px)**. \n- **Smooth graphs (EMA)** and **Extra smoothing for CPU lines (double-EMA)**.\n\n**General view**\n- **Curve color** for the single-curve CPU view.\n\n**Multi-window**\n- **Mini plot min width/height (px)**, **columns count** (grid layout). \n- **Show axes in multi-window plots**. \n- **Mono color for multi-window plots** (or per-core colors). \n- **CPU label placement** and **Match label color to plot**.\n\nFooter buttons: **Restore Defaults**, **Apply**, **Cancel**, **OK**.\n\n---\n\n### Themes & Appearance\n\nKLV System Monitor ships with multiple built-in themes ranging from light to deep dark. \nCharts, legends and UI widgets adapt automatically to the selected theme to preserve contrast and readability.\n\n\n<!-- If you want it to also render on PyPI, use a raw GitHub URL instead:\n-->\n\n**Highlights**\n- **Theme selector** in **Preferences \u2192 Theme** (instant preview).\n- High-contrast palettes for per-CPU lines and legends in both light and dark modes.\n- Optional **antialiasing** for extra-smooth curves (toggle in Preferences).\n- Grid visibility (X/Y), line width, mono/per-core colors, and label color matching are all configurable.\n- The general CPU view keeps a fixed **0\u2013100%** Y-axis for consistent reading across themes.\n\n\n---\n\n## Requirements\n\n| Software | Minimum Version | Notes |\n|----------|-----------------|---------------------------------------------------------|\n| **Python** | 3.10 | Installed automatically if you use the one-click installers |\n\n---\n\n## Installation\n\nYou can install KLV System Monitor in two ways:\n\n### 1. One-click installers <sup>(recommended)</sup>\n\n1. **Download** the ZIP package: \n **[\ud83d\udce6 One-click Installers](https://github.com/karellopez/KLV-System-Monitor/raw/main/Installers/Installers.zip\n)**\n2. **Extract** the ZIP file and run the script for your operating system:\n\n| OS | Script | How to Run | Duration |\n|------------------|----------------------------------|--------------------------------------------------------------------------------------------------------------------------------------------------------------------------------------------------------------------|---------|\n| **Windows 10/11**| `install_klv_system_monitor.bat` | Double-click. This will open a terminal and the installation will start.<br/>If you are not familiar to terminals, please, do not be afraid. <br/>This script do not have any permission to make undesired things. | \u2248 5 min |\n| **Linux** | `install_klv_system_monitor.sh` | Open a terminal in the path of the installer and type: <br/>`./klv_system_monitor.sh` | \u2248 5 min |\n\n3. After the installation finishes, you will find two shortcuts on your desktop:\n\n| OS | Launch | Uninstall |\n|-------------|-----------------------------------|---------------------------------|\n| **Windows** | `run_KLVSystemMonitor.bat` | `uninstall_KLVSystemMonitor.bat` |\n| **Linux** | **KLV System Monitor** (launcher) | `Uninstall KLV System Monitor` |\n\n---\n\n### 2. Install in a virtual environment (advanced)\n\n```bash\n# 1. Create a virtual environment\npython3 -m venv <env_name>\n\n# 2. Activate it\nsource <env_name>/bin/activate # On Windows: <env_name>\\Scripts\\activate\n\n# 3. Install BIDS Manager from GitHub\npip install klv-system-monitor\n```\nThe package declares all dependencies, so installation\npulls everything required to run the GUI and helper scripts.\nAll core requirements are version pinned in `pyproject.toml` to ensure\nconsistent installations.\n\nAfter installation the following commands become available:\n\n- `klvtop` \u2013 main GUI containing all KLV System Monitor functionalities\n",
"bugtrack_url": null,
"license": "MIT License\n \n Copyright (c) 2025 Karel L\u00f3pez Vilaret (TimeMatters)\n \n Permission is hereby granted, free of charge, to any person obtaining a copy\n of this software and associated documentation files (the \"Software\"), to deal\n in the Software without restriction, including without limitation the rights\n to use, copy, modify, merge, publish, distribute, sublicense, and/or sell\n copies of the Software, and to permit persons to whom the Software is\n furnished to do so, subject to the following conditions:\n \n The above copyright notice and this permission notice shall be included in all\n copies or substantial portions of the Software.\n \n THE SOFTWARE IS PROVIDED \"AS IS\", WITHOUT WARRANTY OF ANY KIND, EXPRESS OR\n IMPLIED, INCLUDING BUT NOT LIMITED TO THE WARRANTIES OF MERCHANTABILITY,\n FITNESS FOR A PARTICULAR PURPOSE AND NONINFRINGEMENT. IN NO EVENT SHALL THE\n AUTHORS OR COPYRIGHT HOLDERS BE LIABLE FOR ANY CLAIM, DAMAGES OR OTHER\n LIABILITY, WHETHER IN AN ACTION OF CONTRACT, TORT OR OTHERWISE, ARISING FROM,\n OUT OF OR IN CONNECTION WITH THE SOFTWARE OR THE USE OR OTHER DEALINGS IN THE\n SOFTWARE.\n ",
"summary": "Cross-platform-ish system monitor (tested on Linux & Windows). Clean PyQt UI for CPU, memory, network and filesystems.",
"version": "0.1.4",
"project_urls": {
"Author (LinkedIn)": "https://www.linkedin.com/in/karel-l%C3%B3pez-vilaret/",
"Changelog": "https://github.com/karellopez/KLV-System-Monitor/releases",
"Homepage": "https://github.com/karellopez/KLV-System-Monitor",
"Issues": "https://github.com/karellopez/KLV-System-Monitor/issues",
"Repository": "https://github.com/karellopez/KLV-System-Monitor"
},
"split_keywords": [
"system monitor",
" monitoring",
" psutil",
" pyqt5",
" pyqtgraph",
" cpu",
" memory",
" network",
" filesystem",
" linux",
" windows"
],
"urls": [
{
"comment_text": null,
"digests": {
"blake2b_256": "0ad53b5a2ea256a7704220cce0398c74357c59d0bdece29e4a3f4c03e6ab249f",
"md5": "d3bf519352103164af1303122a3f8ff3",
"sha256": "8ebcb8e127b9d3ec1171cd053993d026cceafbff9e1b3c003e266b45ea790973"
},
"downloads": -1,
"filename": "klv_system_monitor-0.1.4-py3-none-any.whl",
"has_sig": false,
"md5_digest": "d3bf519352103164af1303122a3f8ff3",
"packagetype": "bdist_wheel",
"python_version": "py3",
"requires_python": ">=3.9",
"size": 1063018,
"upload_time": "2025-08-30T18:44:36",
"upload_time_iso_8601": "2025-08-30T18:44:36.261347Z",
"url": "https://files.pythonhosted.org/packages/0a/d5/3b5a2ea256a7704220cce0398c74357c59d0bdece29e4a3f4c03e6ab249f/klv_system_monitor-0.1.4-py3-none-any.whl",
"yanked": false,
"yanked_reason": null
},
{
"comment_text": null,
"digests": {
"blake2b_256": "7403f7d7d05a32d77becc351d87d26136c81af1d68ebe59c0a41c113a02e4a6e",
"md5": "82c3791b64f39b4cd29f28fc074a54d4",
"sha256": "bd774b05782e16d87988f66cd093c37e2ce9420edc361c347dac82910cf157ec"
},
"downloads": -1,
"filename": "klv_system_monitor-0.1.4.tar.gz",
"has_sig": false,
"md5_digest": "82c3791b64f39b4cd29f28fc074a54d4",
"packagetype": "sdist",
"python_version": "source",
"requires_python": ">=3.9",
"size": 1067337,
"upload_time": "2025-08-30T18:44:39",
"upload_time_iso_8601": "2025-08-30T18:44:39.720725Z",
"url": "https://files.pythonhosted.org/packages/74/03/f7d7d05a32d77becc351d87d26136c81af1d68ebe59c0a41c113a02e4a6e/klv_system_monitor-0.1.4.tar.gz",
"yanked": false,
"yanked_reason": null
}
],
"upload_time": "2025-08-30 18:44:39",
"github": true,
"gitlab": false,
"bitbucket": false,
"codeberg": false,
"github_user": "karellopez",
"github_project": "KLV-System-Monitor",
"travis_ci": false,
"coveralls": false,
"github_actions": false,
"lcname": "klv-system-monitor"
}
