# matplotlib-label-lines
[](https://github.com/cphyc/matplotlib-label-lines/actions/workflows/pytest.yml)
[](https://pypi.org/project/matplotlib-label-lines/)
[](https://pypi.org/project/matplotlib-label-lines)
[](https://codecov.io/gh/cphyc/matplotlib-label-lines)
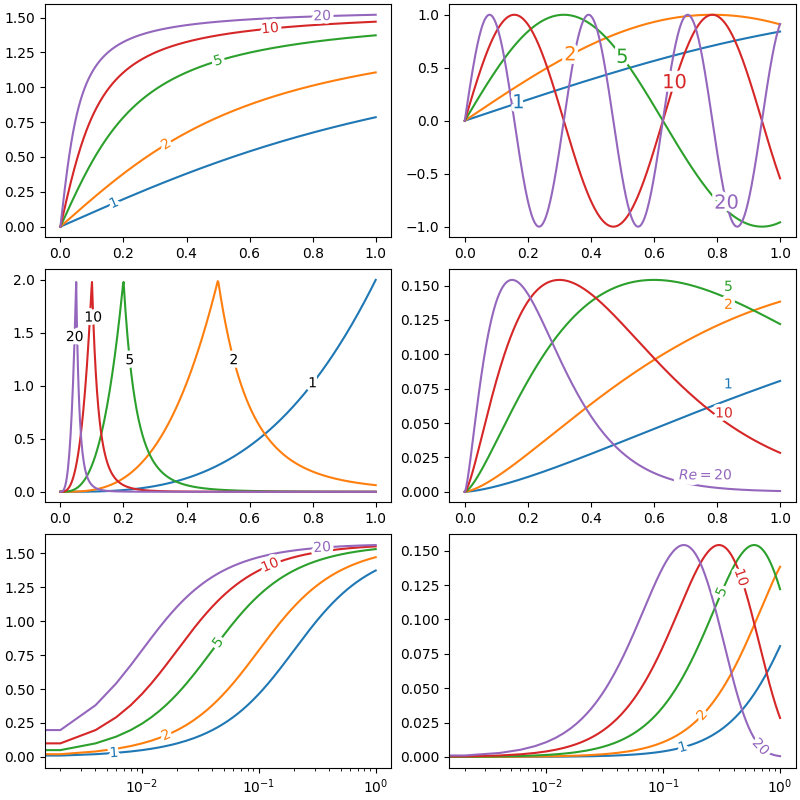
Easily label line(s) using matplotlib.
The code is heavily based on http://stackoverflow.com/questions/16992038/inline-labels-in-matplotlib (original code from NauticalMile).
## Install
Just do:
```bash
pip install matplotlib-label-lines
```
You can try it online on binder [](https://mybinder.org/v2/gh/cphyc/matplotlib-label-lines/master), get some inspiration from [the example](https://github.com/cphyc/matplotlib-label-lines/blob/master/example/matplotlib_label_lines.ipynb) or from the following script:
```python
import numpy as np
from matplotlib import pyplot as plt
from scipy.stats import chi2, loglaplace
from labellines import labelLine, labelLines
X = np.linspace(0, 1, 500)
A = [1, 2, 5, 10, 20]
funcs = [np.arctan, np.sin, loglaplace(4).pdf, chi2(5).pdf]
fig, axes = plt.subplots(ncols=2, nrows=3, constrained_layout=True, figsize=(8, 8))
axes = axes.flatten()
ax = axes[0]
for a in A:
ax.plot(X, np.arctan(a * X), label=str(a))
labelLines(ax.get_lines(), zorder=2.5)
ax = axes[1]
for a in A:
ax.plot(X, np.sin(a * X), label=str(a))
labelLines(ax.get_lines(), align=False, fontsize=14)
ax = axes[2]
for a in A:
ax.plot(X, loglaplace(4).pdf(a * X), label=str(a))
xvals = [0.8, 0.55, 0.22, 0.104, 0.045]
labelLines(ax.get_lines(), align=False, xvals=xvals, color="k")
ax = axes[3]
for a in A:
ax.plot(X, chi2(5).pdf(a * X), label=str(a))
lines = ax.get_lines()
l1 = lines[-1]
labelLine(
l1,
0.6,
label=r"$Re=${}".format(l1.get_label()),
ha="left",
va="bottom",
align=False,
backgroundcolor="none",
)
labelLines(lines[:-1], yoffsets=0.01, align=False, backgroundcolor="none")
# labelLines also supports log-scaled x-axes
ax = axes[4]
for a in A:
ax.semilogx(X, np.arctan(5 * a * X), label=str(a))
labelLines(ax.get_lines(), zorder=2.5)
ax = axes[5]
for a in A:
ax.semilogx(X, chi2(5).pdf(a * X), label=str(a))
labelLines(ax.get_lines(), xvals=(0.1, 1), zorder=2.5)
fig.show()
```
# Citing
If you're using this package for research purposes, consider citing the [Zenodo entry (https://zenodo.org/record/7428071)](https://zenodo.org/record/7428071).
Raw data
{
"_id": null,
"home_page": "https://github.com/cphyc/matplotlib-label-lines",
"name": "matplotlib-label-lines",
"maintainer": "",
"docs_url": null,
"requires_python": ">=3.8",
"maintainer_email": "",
"keywords": "",
"author": "Corentin Cadiou",
"author_email": "contact@cphyc.me",
"download_url": "https://files.pythonhosted.org/packages/f1/d0/e6f49a6ef20f98aaa613df30f335ea7b4e2933f6d1f459b97e6cf364b85c/matplotlib_label_lines-0.7.0.tar.gz",
"platform": null,
"description": "# matplotlib-label-lines\n[](https://github.com/cphyc/matplotlib-label-lines/actions/workflows/pytest.yml)\n[](https://pypi.org/project/matplotlib-label-lines/)\n[](https://pypi.org/project/matplotlib-label-lines)\n[](https://codecov.io/gh/cphyc/matplotlib-label-lines)\n\nEasily label line(s) using matplotlib.\n\nThe code is heavily based on http://stackoverflow.com/questions/16992038/inline-labels-in-matplotlib (original code from NauticalMile).\n\n## Install\n\nJust do:\n```bash\npip install matplotlib-label-lines\n```\nYou can try it online on binder [](https://mybinder.org/v2/gh/cphyc/matplotlib-label-lines/master), get some inspiration from [the example](https://github.com/cphyc/matplotlib-label-lines/blob/master/example/matplotlib_label_lines.ipynb) or from the following script:\n```python\nimport numpy as np\nfrom matplotlib import pyplot as plt\nfrom scipy.stats import chi2, loglaplace\n\nfrom labellines import labelLine, labelLines\n\nX = np.linspace(0, 1, 500)\nA = [1, 2, 5, 10, 20]\nfuncs = [np.arctan, np.sin, loglaplace(4).pdf, chi2(5).pdf]\n\nfig, axes = plt.subplots(ncols=2, nrows=3, constrained_layout=True, figsize=(8, 8))\n\naxes = axes.flatten()\n\nax = axes[0]\nfor a in A:\n ax.plot(X, np.arctan(a * X), label=str(a))\n\nlabelLines(ax.get_lines(), zorder=2.5)\n\nax = axes[1]\nfor a in A:\n ax.plot(X, np.sin(a * X), label=str(a))\n\nlabelLines(ax.get_lines(), align=False, fontsize=14)\n\nax = axes[2]\nfor a in A:\n ax.plot(X, loglaplace(4).pdf(a * X), label=str(a))\n\nxvals = [0.8, 0.55, 0.22, 0.104, 0.045]\nlabelLines(ax.get_lines(), align=False, xvals=xvals, color=\"k\")\n\nax = axes[3]\nfor a in A:\n ax.plot(X, chi2(5).pdf(a * X), label=str(a))\n\nlines = ax.get_lines()\nl1 = lines[-1]\nlabelLine(\n l1,\n 0.6,\n label=r\"$Re=${}\".format(l1.get_label()),\n ha=\"left\",\n va=\"bottom\",\n align=False,\n backgroundcolor=\"none\",\n)\nlabelLines(lines[:-1], yoffsets=0.01, align=False, backgroundcolor=\"none\")\n\n# labelLines also supports log-scaled x-axes\nax = axes[4]\nfor a in A:\n ax.semilogx(X, np.arctan(5 * a * X), label=str(a))\n\nlabelLines(ax.get_lines(), zorder=2.5)\n\nax = axes[5]\nfor a in A:\n ax.semilogx(X, chi2(5).pdf(a * X), label=str(a))\n\nlabelLines(ax.get_lines(), xvals=(0.1, 1), zorder=2.5)\n\nfig.show()\n```\n\n\n# Citing\nIf you're using this package for research purposes, consider citing the [Zenodo entry (https://zenodo.org/record/7428071)](https://zenodo.org/record/7428071).\n",
"bugtrack_url": null,
"license": "MIT",
"summary": "Label lines in matplotlib.",
"version": "0.7.0",
"project_urls": {
"Homepage": "https://github.com/cphyc/matplotlib-label-lines"
},
"split_keywords": [],
"urls": [
{
"comment_text": "",
"digests": {
"blake2b_256": "3c6baa49d85637f6c13c48756d8e75ae00a2e355b6f5a55f0964fa996a7c49d0",
"md5": "1caac12c9ffd11b57faeecffd650c0ff",
"sha256": "31f9ea9de749152d5ef2a1b5e400cba965ec4574bb8a32c30361dd32dd2bfd95"
},
"downloads": -1,
"filename": "matplotlib_label_lines-0.7.0-py3-none-any.whl",
"has_sig": false,
"md5_digest": "1caac12c9ffd11b57faeecffd650c0ff",
"packagetype": "bdist_wheel",
"python_version": "py3",
"requires_python": ">=3.8",
"size": 12830,
"upload_time": "2023-09-08T09:35:54",
"upload_time_iso_8601": "2023-09-08T09:35:54.249214Z",
"url": "https://files.pythonhosted.org/packages/3c/6b/aa49d85637f6c13c48756d8e75ae00a2e355b6f5a55f0964fa996a7c49d0/matplotlib_label_lines-0.7.0-py3-none-any.whl",
"yanked": false,
"yanked_reason": null
},
{
"comment_text": "",
"digests": {
"blake2b_256": "f1d0e6f49a6ef20f98aaa613df30f335ea7b4e2933f6d1f459b97e6cf364b85c",
"md5": "bc37a945b3b32c2ebe0df992a65c91db",
"sha256": "db2ba7afe34a733f7c02d29b16217069cf412c12ce6a452991adb71b9c4fd16f"
},
"downloads": -1,
"filename": "matplotlib_label_lines-0.7.0.tar.gz",
"has_sig": false,
"md5_digest": "bc37a945b3b32c2ebe0df992a65c91db",
"packagetype": "sdist",
"python_version": "source",
"requires_python": ">=3.8",
"size": 13178,
"upload_time": "2023-09-08T09:35:55",
"upload_time_iso_8601": "2023-09-08T09:35:55.998285Z",
"url": "https://files.pythonhosted.org/packages/f1/d0/e6f49a6ef20f98aaa613df30f335ea7b4e2933f6d1f459b97e6cf364b85c/matplotlib_label_lines-0.7.0.tar.gz",
"yanked": false,
"yanked_reason": null
}
],
"upload_time": "2023-09-08 09:35:55",
"github": true,
"gitlab": false,
"bitbucket": false,
"codeberg": false,
"github_user": "cphyc",
"github_project": "matplotlib-label-lines",
"travis_ci": false,
"coveralls": true,
"github_actions": true,
"lcname": "matplotlib-label-lines"
}


