# molplotly
[](https://www.rdkit.org/)
[](https://pypi.python.org/pypi/molplotly)
[](https://pepy.tech/project/molplotly)
[](https://python.org/downloads)
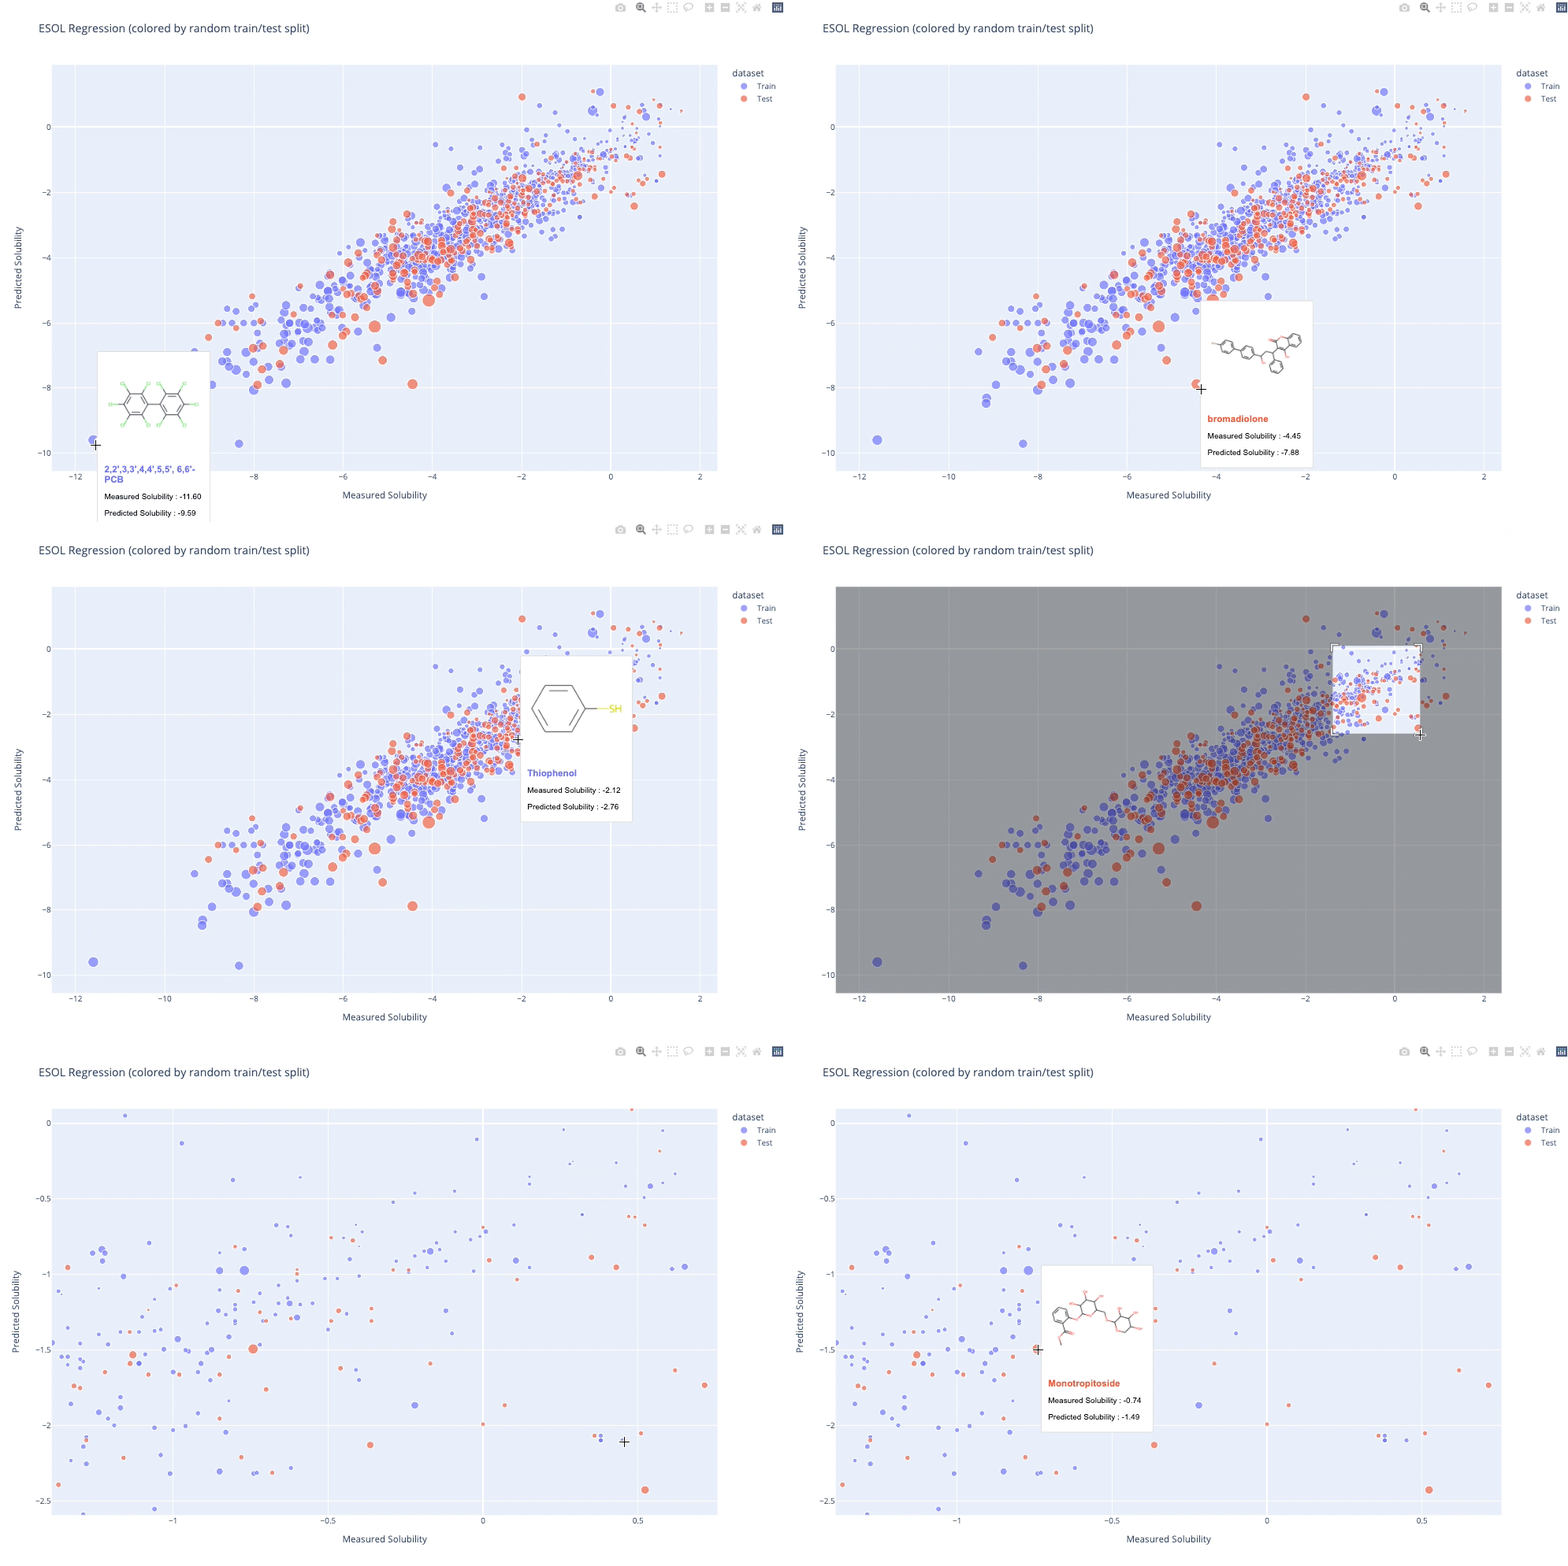
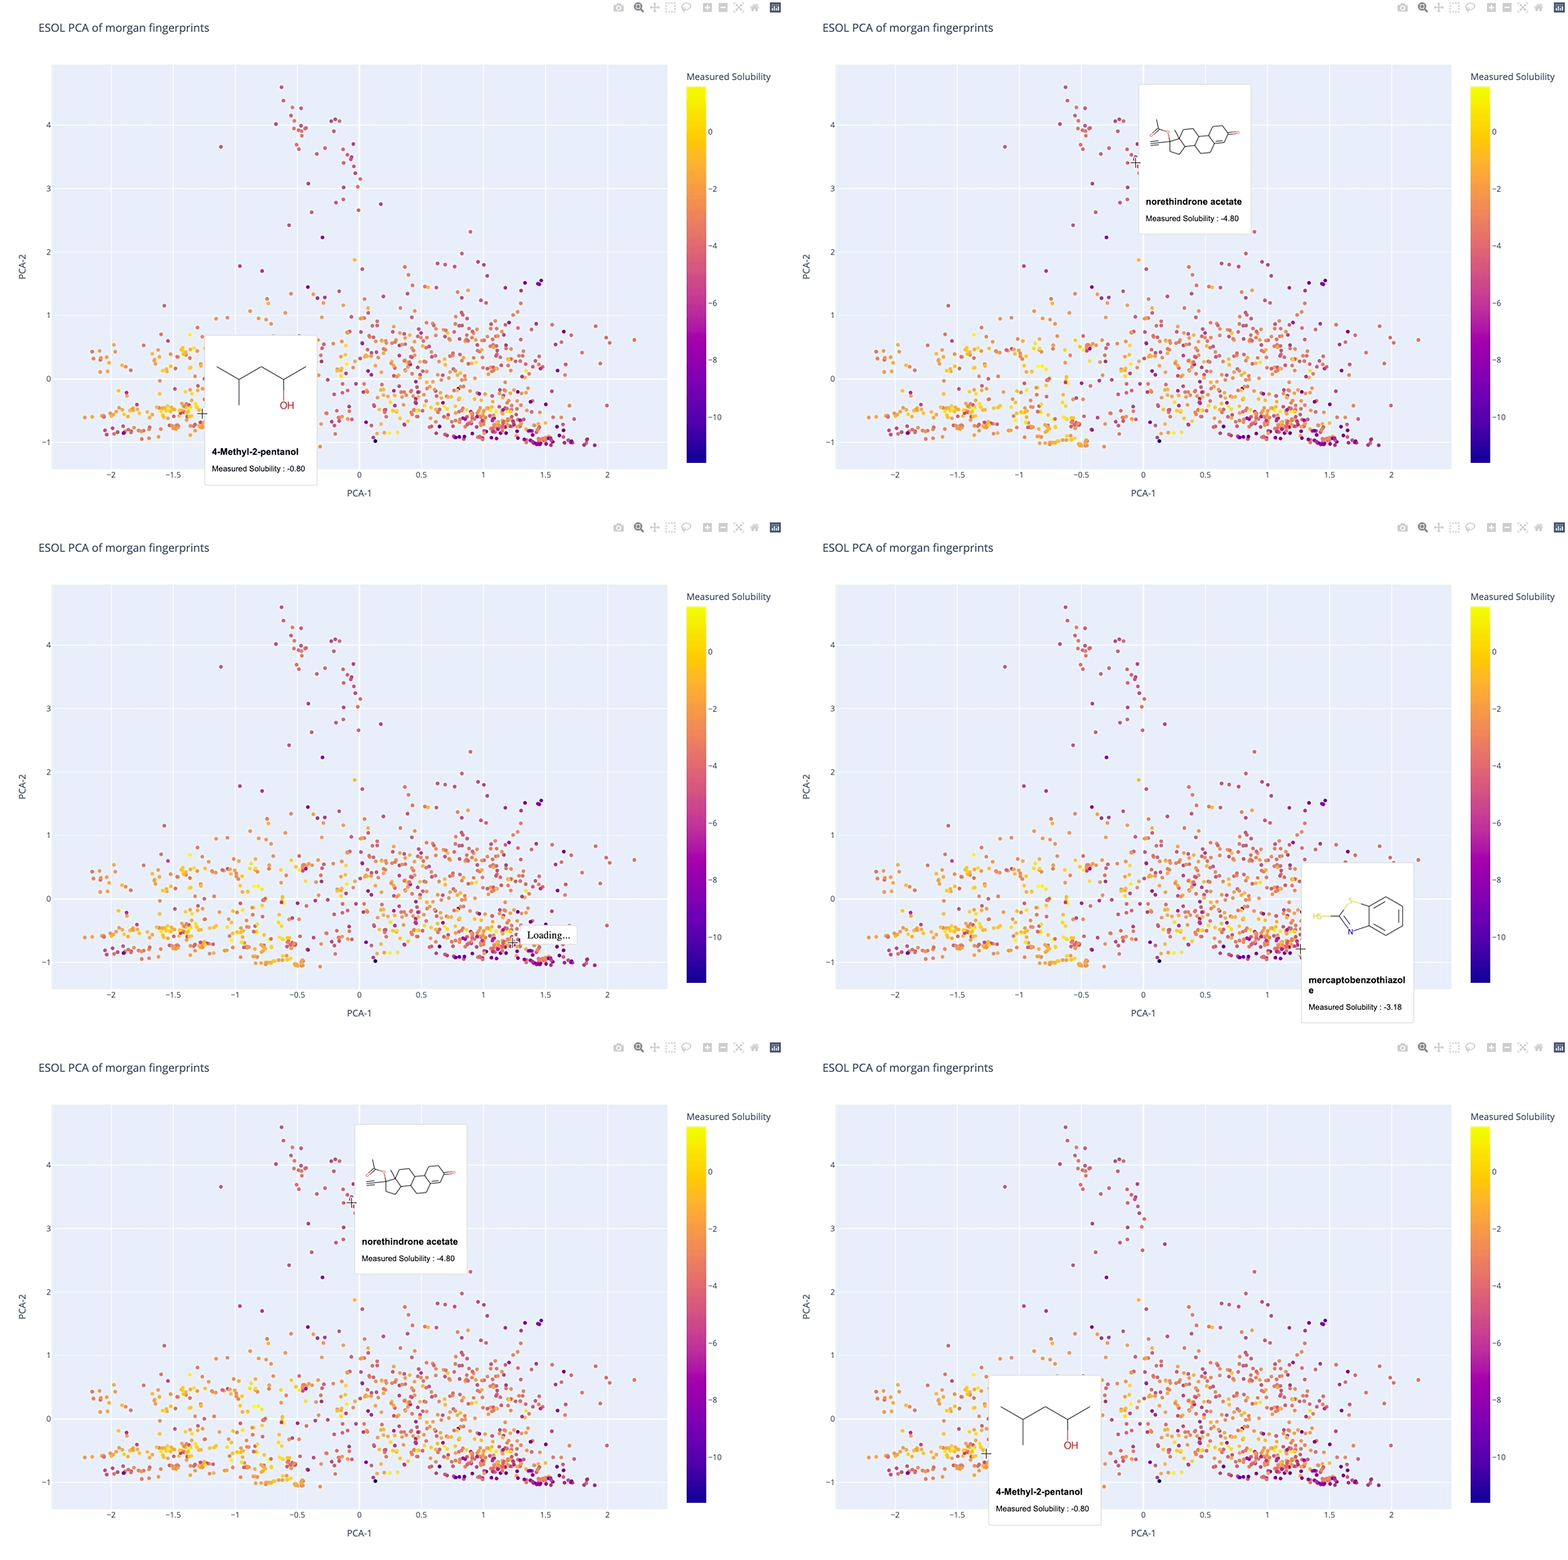
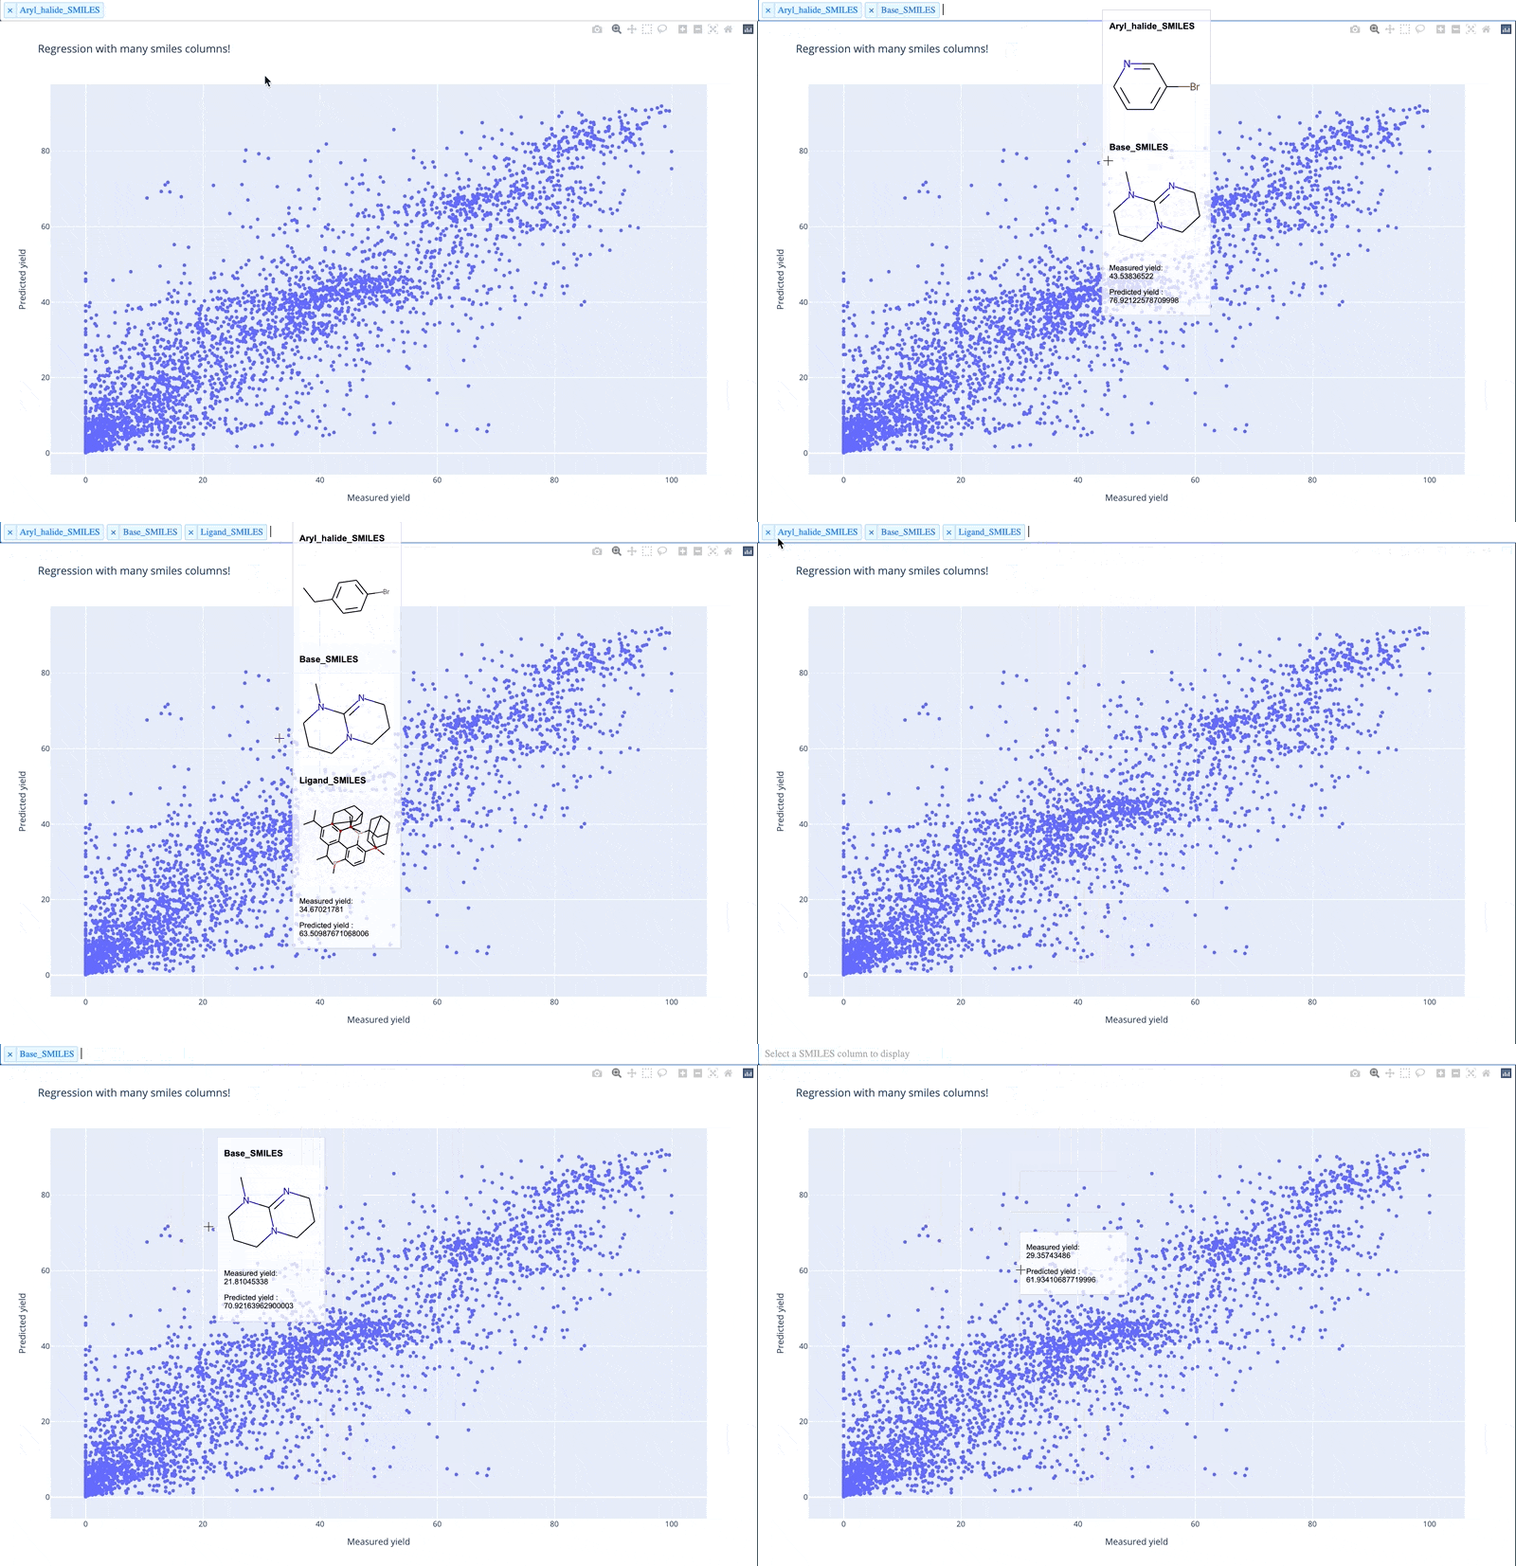
`molplotly` is an add-on to `plotly` built on RDKit which allows 2D images of molecules to be shown in `plotly` figures when hovering over the data points.


A readable walkthrough of how to use the package together with some useful examples can be found in [this blog post](https://www.wmccorkindale.com/post/introducing-molplotly) while a runnable notebook can be found in `examples/simple_usage_and_formatting.ipynb` :)
## Installation
```sh
pip install molplotly
```
## Usage
```python
import pandas as pd
import plotly.express as px
import molplotly
# load a DataFrame with smiles
df_esol = pd.read_csv(
'https://raw.githubusercontent.com/deepchem/deepchem/master/datasets/delaney-processed.csv')
df_esol['y_pred'] = df_esol['ESOL predicted log solubility in mols per litre']
df_esol['y_true'] = df_esol['measured log solubility in mols per litre']
# generate a scatter plot
fig = px.scatter(df_esol, x="y_true", y="y_pred")
# add molecules to the plotly graph - returns a Dash app
app = molplotly.add_molecules(fig=fig,
df=df_esol,
smiles_col='smiles',
title_col='Compound ID',
)
# run Dash app inline in notebook (or in an external server)
app.run_server(mode='inline', port=8700, height=1000)
```
### Input parameters
| name | type | default | description |
| :------------------ | :---------- | :--------- | :-------------------------------------------------------------------------------------------------------------------------------------------------------------------- |
| `fig` | `figure` | required | a plotly figure object containing datapoints plotted from `df`. |
| `df` | `DataFrame` | required | a pandas dataframe that contains the data plotted in `fig`. |
| `smiles_col` | `str` | `'SMILES'` | name of the column in df containing the smiles plotted in `fig` |
| `show_img` | `bool` | `True` | whether or not to generate the molecule image in the dash app |
| `svg_size` | `float` | `200` | the size in pixels of the molecule drawing |
| `alpha` | `float` | `0.7` | the transparency of the hoverbox, 0 for full transparency 1 for full opaqueness |
| `mol_alpha` | `float` | `0.7` | the transparency of the SVG molecule image, 0 for full transparency 1 for full opaqueness |
| `title_col` | `str` | `None` | name of the column in df to be used as the title entry in the hover box |
| `show_coords` | `bool` | `True` | whether or not to show the coordinates of the data point in the hover box |
| `caption_cols` | `list` | `None` | list of column names in df to be included in the hover box |
| `caption_transform` | `dict` | `{}` | Functions applied to captions for formatting. The dict must follow a key: function structure where the key must correspond to one of the columns in subset or tooltip |
| `color_col` | `str` | `None` | name of the column in df that is used to color the datapoints in `df` - necessary when there is discrete conditional coloring |
| `symbol_col` | `str` | `None` | name of the column in df that is used to determine the marker shape of the datapoints in `df` |
| `wrap` | `bool` | `True` | whether or not to wrap the title text to multiple lines if the length of the text is too long |
| `wraplen` | `int` | `20` | the threshold length of the title text before wrapping begins - adjust when changing the width of the hover box |
| `width` | `int` | `150` | the width in pixels of the hover box |
| `fontfamily` | `str` | `'Arial'` | the font family used in the hover box |
| `fontsize` | `int` | `12` | the font size used in the hover box - the font of the title line is `fontsize`+2 |
#### Output parameters
by default a JupyterDash `app` is returned which can be run inline in a jupyter notebook or deployed on a server via `app.run_server()`
- The recommended `height` of the app is `50+(height of the plotly figure)`.
- For the `port` of the app, make sure you don't pick the same `port` as another `molplotly` plot otherwise the tooltips will clash with each other. Also, apparently on windows port numbers below `8700` are used by other processes so for safety processes keep to numbers above that.
## Can I run this in colab?
JupyterDash is supposed to have support for Google Colab but at some point that seems to have broken.. Keep an eye on the raised issue [here](https://github.com/plotly/jupyter-dash/issues/10)!
Update (1st March 2022): The plots seem to be running again but the hoverboxes are not showing so I don't think it has been fully fixed - I will keep an eye on it in the meantime.
## Can I save these plots?
An issue/feature request for this has already been raised [here](https://github.com/wjm41/molplotly/issues/4).
`moltplotly` works using a Dash app which is non-trivial to export because server side javascript is needed in addition to HTML/CSS styling ([as detailed here](https://stackoverflow.com/questions/60097577/how-to-export-a-plotly-dashboard-app-into-a-html-standalone-file-to-share-with-t))
Until I find a way to get around that, the best alternative is to either host the plot on an app/server, exporting the plotly figure without molecules showing :( as detailed in this [page](https://plotly.com/python/interactive-html-export/). If you want to use it in a presentation I'd suggest keeping the figure open in a browser and changing windows to it during your talk!
## Warning about memory size
Just adding a warning here that memory usage in a notebook can increase significanly when using plotly (not `molplotly`'s fault!). If you notice your jupyter notebook slowing down, plotly itself is a likely culprit... In that case I'd consider either using plotly with [static image rendering](https://plotly.com/python/renderers/#static-image-renderers), or ... use [seaborn](https://seaborn.pydata.org/index.html) :P
## Acknowledgements
- [@wjm41](https://github.com/wjm41) (contributor)
- [@RokasEl](https://github.com/RokasEl) (contributor)
Raw data
{
"_id": null,
"home_page": "https://github.com/wjm41/molplotly",
"name": "molplotly",
"maintainer": "",
"docs_url": null,
"requires_python": "",
"maintainer_email": "",
"keywords": "science,chemistry,cheminformatics",
"author": "William McCorkindale",
"author_email": "wjm41@cam.ac.uk",
"download_url": "https://files.pythonhosted.org/packages/39/40/c0d86942ba668d975570a0fbd7fe4224445198a90a64ec6f0c1cd3bf2527/molplotly-1.1.8.tar.gz",
"platform": null,
"description": "# molplotly\n\n[](https://www.rdkit.org/)\n[](https://pypi.python.org/pypi/molplotly)\n[](https://pepy.tech/project/molplotly)\n[](https://python.org/downloads)\n\n`molplotly` is an add-on to `plotly` built on RDKit which allows 2D images of molecules to be shown in `plotly` figures when hovering over the data points.\n\n\n\n\n\nA readable walkthrough of how to use the package together with some useful examples can be found in [this blog post](https://www.wmccorkindale.com/post/introducing-molplotly) while a runnable notebook can be found in `examples/simple_usage_and_formatting.ipynb` :)\n\n## Installation\n\n```sh\npip install molplotly\n```\n\n## Usage\n\n```python\nimport pandas as pd\nimport plotly.express as px\n\nimport molplotly\n\n# load a DataFrame with smiles\ndf_esol = pd.read_csv(\n 'https://raw.githubusercontent.com/deepchem/deepchem/master/datasets/delaney-processed.csv')\ndf_esol['y_pred'] = df_esol['ESOL predicted log solubility in mols per litre']\ndf_esol['y_true'] = df_esol['measured log solubility in mols per litre']\n\n# generate a scatter plot\nfig = px.scatter(df_esol, x=\"y_true\", y=\"y_pred\")\n\n# add molecules to the plotly graph - returns a Dash app\napp = molplotly.add_molecules(fig=fig,\n df=df_esol,\n smiles_col='smiles',\n title_col='Compound ID',\n )\n\n# run Dash app inline in notebook (or in an external server)\napp.run_server(mode='inline', port=8700, height=1000)\n```\n\n### Input parameters\n\n| name | type | default | description |\n| :------------------ | :---------- | :--------- | :-------------------------------------------------------------------------------------------------------------------------------------------------------------------- |\n| `fig` | `figure` | required | a plotly figure object containing datapoints plotted from `df`. |\n| `df` | `DataFrame` | required | a pandas dataframe that contains the data plotted in `fig`. |\n| `smiles_col` | `str` | `'SMILES'` | name of the column in df containing the smiles plotted in `fig` |\n| `show_img` | `bool` | `True` | whether or not to generate the molecule image in the dash app |\n| `svg_size` | `float` | `200` | the size in pixels of the molecule drawing |\n| `alpha` | `float` | `0.7` | the transparency of the hoverbox, 0 for full transparency 1 for full opaqueness |\n| `mol_alpha` | `float` | `0.7` | the transparency of the SVG molecule image, 0 for full transparency 1 for full opaqueness |\n| `title_col` | `str` | `None` | name of the column in df to be used as the title entry in the hover box |\n| `show_coords` | `bool` | `True` | whether or not to show the coordinates of the data point in the hover box |\n| `caption_cols` | `list` | `None` | list of column names in df to be included in the hover box |\n| `caption_transform` | `dict` | `{}` | Functions applied to captions for formatting. The dict must follow a key: function structure where the key must correspond to one of the columns in subset or tooltip |\n| `color_col` | `str` | `None` | name of the column in df that is used to color the datapoints in `df` - necessary when there is discrete conditional coloring |\n| `symbol_col` | `str` | `None` | name of the column in df that is used to determine the marker shape of the datapoints in `df` |\n| `wrap` | `bool` | `True` | whether or not to wrap the title text to multiple lines if the length of the text is too long |\n| `wraplen` | `int` | `20` | the threshold length of the title text before wrapping begins - adjust when changing the width of the hover box |\n| `width` | `int` | `150` | the width in pixels of the hover box |\n| `fontfamily` | `str` | `'Arial'` | the font family used in the hover box |\n| `fontsize` | `int` | `12` | the font size used in the hover box - the font of the title line is `fontsize`+2 |\n\n#### Output parameters\n\nby default a JupyterDash `app` is returned which can be run inline in a jupyter notebook or deployed on a server via `app.run_server()`\n\n- The recommended `height` of the app is `50+(height of the plotly figure)`.\n- For the `port` of the app, make sure you don't pick the same `port` as another `molplotly` plot otherwise the tooltips will clash with each other. Also, apparently on windows port numbers below `8700` are used by other processes so for safety processes keep to numbers above that.\n\n## Can I run this in colab?\n\nJupyterDash is supposed to have support for Google Colab but at some point that seems to have broken.. Keep an eye on the raised issue [here](https://github.com/plotly/jupyter-dash/issues/10)!\nUpdate (1st March 2022): The plots seem to be running again but the hoverboxes are not showing so I don't think it has been fully fixed - I will keep an eye on it in the meantime.\n\n## Can I save these plots?\n\nAn issue/feature request for this has already been raised [here](https://github.com/wjm41/molplotly/issues/4).\n\n`moltplotly` works using a Dash app which is non-trivial to export because server side javascript is needed in addition to HTML/CSS styling ([as detailed here](https://stackoverflow.com/questions/60097577/how-to-export-a-plotly-dashboard-app-into-a-html-standalone-file-to-share-with-t))\n\nUntil I find a way to get around that, the best alternative is to either host the plot on an app/server, exporting the plotly figure without molecules showing :( as detailed in this [page](https://plotly.com/python/interactive-html-export/). If you want to use it in a presentation I'd suggest keeping the figure open in a browser and changing windows to it during your talk!\n\n## Warning about memory size\n\nJust adding a warning here that memory usage in a notebook can increase significanly when using plotly (not `molplotly`'s fault!). If you notice your jupyter notebook slowing down, plotly itself is a likely culprit... In that case I'd consider either using plotly with [static image rendering](https://plotly.com/python/renderers/#static-image-renderers), or ... use [seaborn](https://seaborn.pydata.org/index.html) :P\n\n## Acknowledgements\n\n- [@wjm41](https://github.com/wjm41) (contributor)\n- [@RokasEl](https://github.com/RokasEl) (contributor)\n\n\n",
"bugtrack_url": null,
"license": "Apache License, Version 2.0",
"summary": "molplotly is an add-on to plotly built on RDKit which allows 2D images of molecules to be shown in scatterplots when hovering over the datapoints.",
"version": "1.1.8",
"project_urls": {
"Download": "https://github.com/wjm41/molplotly/archive/refs/tags/v1.1.8.tar.gz",
"Homepage": "https://github.com/wjm41/molplotly"
},
"split_keywords": [
"science",
"chemistry",
"cheminformatics"
],
"urls": [
{
"comment_text": "",
"digests": {
"blake2b_256": "3940c0d86942ba668d975570a0fbd7fe4224445198a90a64ec6f0c1cd3bf2527",
"md5": "c269fb5d3295e409185ce652fc8b38bf",
"sha256": "bffc2ebede667946807f3d000490b84a0505236b0e766f20ca8eceb46cffc04f"
},
"downloads": -1,
"filename": "molplotly-1.1.8.tar.gz",
"has_sig": false,
"md5_digest": "c269fb5d3295e409185ce652fc8b38bf",
"packagetype": "sdist",
"python_version": "source",
"requires_python": null,
"size": 16222,
"upload_time": "2023-05-06T16:12:35",
"upload_time_iso_8601": "2023-05-06T16:12:35.995210Z",
"url": "https://files.pythonhosted.org/packages/39/40/c0d86942ba668d975570a0fbd7fe4224445198a90a64ec6f0c1cd3bf2527/molplotly-1.1.8.tar.gz",
"yanked": false,
"yanked_reason": null
}
],
"upload_time": "2023-05-06 16:12:35",
"github": true,
"gitlab": false,
"bitbucket": false,
"codeberg": false,
"github_user": "wjm41",
"github_project": "molplotly",
"travis_ci": false,
"coveralls": false,
"github_actions": true,
"lcname": "molplotly"
}
