# MonochroMap
Monochromap is a small library to plot geographical information on top of a black and white map.
Inspired and continued from [StaticMap](https://github.com/komoot/staticmap).
Major changes compare to the original package:
- changed default tile to stamen toner
- streamlined graphical component addition using single function
- supported graphical component alpha/transparency blending
- fixed IO error if you plot many iconmarker object to the map
**Update as of August 2024**
The original stamen toner tile styles provider is shutting down (https://maps.stamen.com/) and move the data to Stadia Maps.
To use this library then you need to create an account at https://stadiamaps.com/stamen, and generate API key as parameter.
## Example
### Draw Lines
This example code will show the location of Laugh Tale from intersection of coordinates given by 4 road poneglyphs.
```python
import os
from monochromap import MonochroMap, Line
m = MonochroMap(api_key=os.environ['STADIA_API_KEY'])
line = Line(((13.4, 52.5), (2.3, 48.9)), '#ff000088', 15)
m.add_feature(line)
line = Line(((4.9041, 52.3676), (7.27, 46.57)), '#0000ff88', 15)
m.add_feature(line)
m.render()
```

### Draw Points
This example code will show the hotspot of California forest fire. Don't ask why there is fire in the ocean, it's global warming.
```python
import os
from monochromap import MonochroMap, Point
m = MonochroMap(api_key=os.environ['STADIA_API_KEY'])
for i in range(1000):
lat = 36.7783 + rng.normal()
lon = -119.4179 + rng.normal()
p = Point((lon, lat), '#fb294344', 5)
m.add_feature(p)
m.render()
```

### Draw (any) Polygon
This example will show how to plot one instance of polygon, namely rectangle. Other shape of polygon is left as an exercise for the reader.
```python
import os
from monochromap import MonochroMap, Polygon
m = MonochroMap(api_key=os.environ['STADIA_API_KEY'])
lon0, lat0 = (-6.114878, 106.731217)
lon1, lat1 = (-6.311491, 106.951200)
points = [[lat0, lon0], [lat0, lon1], [lat1, lon1], [lat1, lon0]]
m.add_feature(Polygon(points, '#ff000022', 'black'))
lon0, lat0 = (-6.156652, 106.912689)
lon1, lat1 = (-6.319975, 107.027262)
points = [[lat0, lon0], [lat0, lon1], [lat1, lon1], [lat1, lon0]]
m.add_feature(Polygon(points, '#00ff0033', 'black'))
lon0, lat0 = (-6.225684, 106.637555)
lon1, lat1 = (-6.319054, 106.807583)
points = [[lat0, lon0], [lat0, lon1], [lat1, lon1], [lat1, lon0]]
m.add_feature(Polygon(points, '#0000ff44', 'black'))
m.render()
```

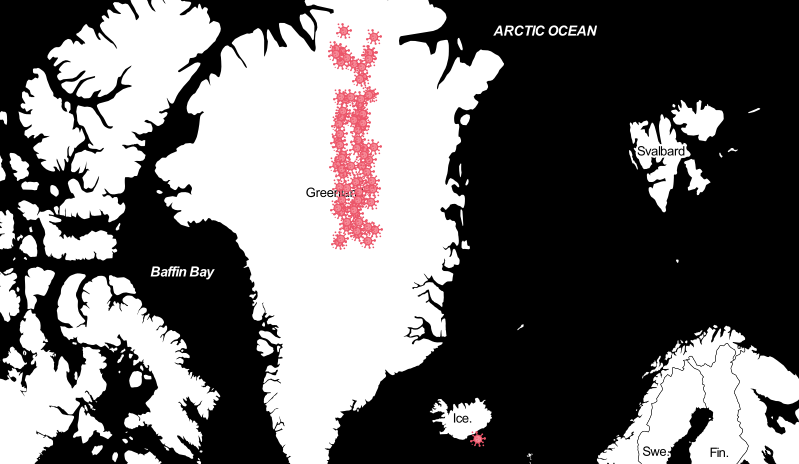
### Draw Icon (random image)
You can also plot any random image into the map. Here we will show the total number of covid patient on the world most adept country at defeating pandemic, according to reputable source, Plague inc.
```python
import os
from monochromap import MonochroMap, IconMarker
m = MonochroMap(api_key=os.environ['STADIA_API_KEY'])
lat, lon = (75.939847, -42.161182)
for i in range(78):
icon = IconMarker(np.array([lon, lat]) + np.random.uniform(-0.3, 6.7, 2), '../samples/covid.png', 0, 0)
m.add_feature(icon)
icon = IconMarker(np.array([-17.456606, 63.992837]) + np.random.uniform(-0.1, 0.1, 2), '../samples/covid.png', 0, 0)
m.add_feature(icon)
m.render()
```
Raw data
{
"_id": null,
"home_page": null,
"name": "monochromap",
"maintainer": null,
"docs_url": null,
"requires_python": ">=3.9",
"maintainer_email": null,
"keywords": "map, visualization, data science",
"author": null,
"author_email": "M Iqbal Tawakal <mit.iqi@gmail.com>",
"download_url": "https://files.pythonhosted.org/packages/f2/ea/b1954e9a2dfb4d3909ef8dc0328365be724ebf54fa56d63d0f6e33e199ca/monochromap-0.3.1.tar.gz",
"platform": null,
"description": "# MonochroMap\n\nMonochromap is a small library to plot geographical information on top of a black and white map. \nInspired and continued from [StaticMap](https://github.com/komoot/staticmap).\n\nMajor changes compare to the original package:\n- changed default tile to stamen toner\n- streamlined graphical component addition using single function\n- supported graphical component alpha/transparency blending\n- fixed IO error if you plot many iconmarker object to the map\n\n**Update as of August 2024**\nThe original stamen toner tile styles provider is shutting down (https://maps.stamen.com/) and move the data to Stadia Maps.\nTo use this library then you need to create an account at https://stadiamaps.com/stamen, and generate API key as parameter.\n\n## Example\n### Draw Lines\nThis example code will show the location of Laugh Tale from intersection of coordinates given by 4 road poneglyphs.\n\n```python\nimport os\nfrom monochromap import MonochroMap, Line\n\nm = MonochroMap(api_key=os.environ['STADIA_API_KEY'])\nline = Line(((13.4, 52.5), (2.3, 48.9)), '#ff000088', 15)\nm.add_feature(line)\n\nline = Line(((4.9041, 52.3676), (7.27, 46.57)), '#0000ff88', 15)\nm.add_feature(line)\n\nm.render()\n```\n\n\n### Draw Points\nThis example code will show the hotspot of California forest fire. Don't ask why there is fire in the ocean, it's global warming.\n```python\nimport os\nfrom monochromap import MonochroMap, Point\n\nm = MonochroMap(api_key=os.environ['STADIA_API_KEY'])\nfor i in range(1000):\n\n lat = 36.7783 + rng.normal()\n lon = -119.4179 + rng.normal()\n\n p = Point((lon, lat), '#fb294344', 5)\n m.add_feature(p)\n\nm.render()\n```\n\n\n### Draw (any) Polygon\nThis example will show how to plot one instance of polygon, namely rectangle. Other shape of polygon is left as an exercise for the reader.\n```python\nimport os\nfrom monochromap import MonochroMap, Polygon\n\nm = MonochroMap(api_key=os.environ['STADIA_API_KEY'])\n\nlon0, lat0 = (-6.114878, 106.731217)\nlon1, lat1 = (-6.311491, 106.951200)\npoints = [[lat0, lon0], [lat0, lon1], [lat1, lon1], [lat1, lon0]]\nm.add_feature(Polygon(points, '#ff000022', 'black'))\n\nlon0, lat0 = (-6.156652, 106.912689)\nlon1, lat1 = (-6.319975, 107.027262)\npoints = [[lat0, lon0], [lat0, lon1], [lat1, lon1], [lat1, lon0]]\nm.add_feature(Polygon(points, '#00ff0033', 'black'))\n\nlon0, lat0 = (-6.225684, 106.637555)\nlon1, lat1 = (-6.319054, 106.807583)\npoints = [[lat0, lon0], [lat0, lon1], [lat1, lon1], [lat1, lon0]]\nm.add_feature(Polygon(points, '#0000ff44', 'black'))\n\nm.render()\n```\n\n\n### Draw Icon (random image)\nYou can also plot any random image into the map. Here we will show the total number of covid patient on the world most adept country at defeating pandemic, according to reputable source, Plague inc.\n\n```python\nimport os\nfrom monochromap import MonochroMap, IconMarker\n\nm = MonochroMap(api_key=os.environ['STADIA_API_KEY'])\nlat, lon = (75.939847, -42.161182)\n\nfor i in range(78):\n\n icon = IconMarker(np.array([lon, lat]) + np.random.uniform(-0.3, 6.7, 2), '../samples/covid.png', 0, 0)\n m.add_feature(icon)\n\nicon = IconMarker(np.array([-17.456606, 63.992837]) + np.random.uniform(-0.1, 0.1, 2), '../samples/covid.png', 0, 0)\nm.add_feature(icon)\n\nm.render()\n```\n\n",
"bugtrack_url": null,
"license": null,
"summary": "A highly opinionated library to plot map on top of stamen toner tile style",
"version": "0.3.1",
"project_urls": {
"Repository": "https://github.com/mitbal/monochromap.git"
},
"split_keywords": [
"map",
" visualization",
" data science"
],
"urls": [
{
"comment_text": "",
"digests": {
"blake2b_256": "bc4b5bebb3c28f7f7d6871439a9aca4a9d63cadcd7e8e0005ffac8a1493e5a15",
"md5": "349c7a6f6f0e4768a8cdde2ccf9476e2",
"sha256": "6ae4ca3654bdee384066fb1b56cf3d3dd23d0ac1c254fc3d143fe0bea4b6838a"
},
"downloads": -1,
"filename": "monochromap-0.3.1-py3-none-any.whl",
"has_sig": false,
"md5_digest": "349c7a6f6f0e4768a8cdde2ccf9476e2",
"packagetype": "bdist_wheel",
"python_version": "py3",
"requires_python": ">=3.9",
"size": 8024,
"upload_time": "2024-08-22T06:37:47",
"upload_time_iso_8601": "2024-08-22T06:37:47.948749Z",
"url": "https://files.pythonhosted.org/packages/bc/4b/5bebb3c28f7f7d6871439a9aca4a9d63cadcd7e8e0005ffac8a1493e5a15/monochromap-0.3.1-py3-none-any.whl",
"yanked": false,
"yanked_reason": null
},
{
"comment_text": "",
"digests": {
"blake2b_256": "f2eab1954e9a2dfb4d3909ef8dc0328365be724ebf54fa56d63d0f6e33e199ca",
"md5": "7767446547e1ca4da84ebe8747183aac",
"sha256": "d483b6c2852920cfc995cf0b6b178c72933f80de27a58d2c61339b5e978c97eb"
},
"downloads": -1,
"filename": "monochromap-0.3.1.tar.gz",
"has_sig": false,
"md5_digest": "7767446547e1ca4da84ebe8747183aac",
"packagetype": "sdist",
"python_version": "source",
"requires_python": ">=3.9",
"size": 7960,
"upload_time": "2024-08-22T06:37:49",
"upload_time_iso_8601": "2024-08-22T06:37:49.458893Z",
"url": "https://files.pythonhosted.org/packages/f2/ea/b1954e9a2dfb4d3909ef8dc0328365be724ebf54fa56d63d0f6e33e199ca/monochromap-0.3.1.tar.gz",
"yanked": false,
"yanked_reason": null
}
],
"upload_time": "2024-08-22 06:37:49",
"github": true,
"gitlab": false,
"bitbucket": false,
"codeberg": false,
"github_user": "mitbal",
"github_project": "monochromap",
"travis_ci": false,
"coveralls": false,
"github_actions": true,
"requirements": [
{
"name": "requests",
"specs": []
},
{
"name": "Pillow",
"specs": []
},
{
"name": "futures",
"specs": []
}
],
"lcname": "monochromap"
}

