| Name | mpl-histcolorbar JSON |
| Version |
0.1.1
 JSON
JSON |
| download |
| home_page | |
| Summary | A histogram+colorbar for matplotlib |
| upload_time | 2023-08-11 14:00:54 |
| maintainer | |
| docs_url | None |
| author | |
| requires_python | >=3.9 |
| license | The MIT License (MIT) Copyright (c) 2013-present Jannis Ahlers Permission is hereby granted, free of charge, to any person obtaining a copy of this software and associated documentation files (the "Software"), to deal in the Software without restriction, including without limitation the rights to use, copy, modify, merge, publish, distribute, sublicense, and/or sell copies of the Software, and to permit persons to whom the Software is furnished to do so, subject to the following conditions: The above copyright notice and this permission notice shall be included in all copies or substantial portions of the Software. THE SOFTWARE IS PROVIDED "AS IS", WITHOUT WARRANTY OF ANY KIND, EXPRESS OR IMPLIED, INCLUDING BUT NOT LIMITED TO THE WARRANTIES OF MERCHANTABILITY, FITNESS FOR A PARTICULAR PURPOSE AND NONINFRINGEMENT. IN NO EVENT SHALL THE AUTHORS OR COPYRIGHT HOLDERS BE LIABLE FOR ANY CLAIM, DAMAGES OR OTHER LIABILITY, WHETHER IN AN ACTION OF CONTRACT, TORT OR OTHERWISE, ARISING FROM, OUT OF OR IN CONNECTION WITH THE SOFTWARE OR THE USE OR OTHER DEALINGS IN THE SOFTWARE. |
| keywords |
matplotlib
colorbar
histogram
|
| VCS |
 |
| bugtrack_url |
|
| requirements |
No requirements were recorded.
|
| Travis-CI |
No Travis.
|
| coveralls test coverage |
No coveralls.
|
<p align="center">
<img alt="mpl-histcolorbar logo" width=60% src="https://raw.githubusercontent.com/jnahlers/mpl-histcolorbar/main/docs/_static/logo.png">
</p>
# mpl-histcolorbar
[](https://badge.fury.io/py/mpl-histcolorbar)
[](https://coveralls.io/github/keflavich/mpl-histcolorbar?branch=master)
[](https://mpl-histcolorbar.readthedocs.io/en/latest/?badge=latest)
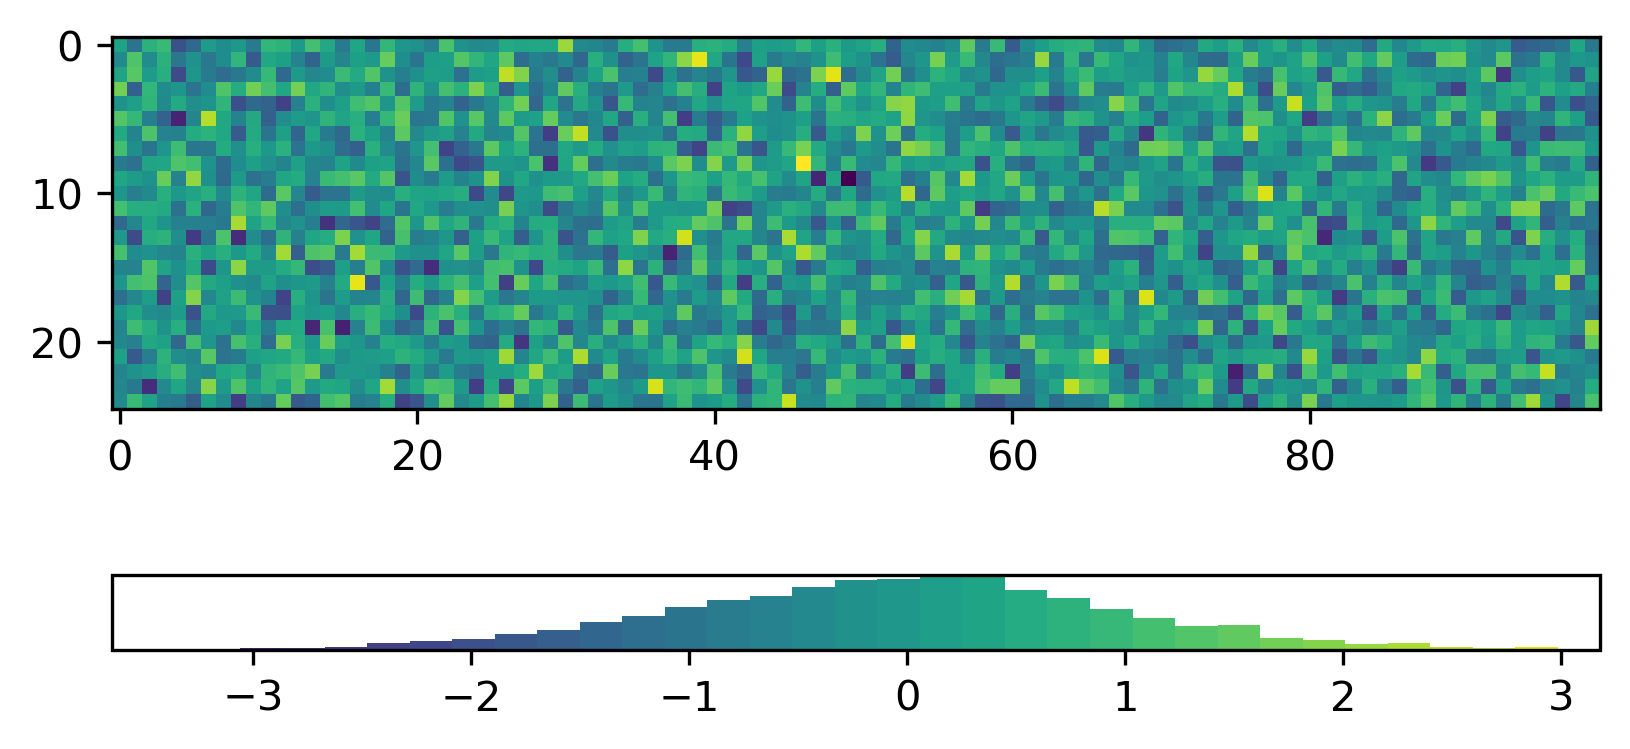
A drop-in replacement for matplotlib's colorbar that shows the frequency of each color in the mappable.
## Getting started
mpl-histcolorbar is available as [`mpl_histcolorbar`](https://pypi.org/project/mpl_histcolorbar/) on PyPI:
```bash
pip install mpl_histcolorbar
```
## Usage
```python
import numpy as np
import matplotlib.pyplot as plt
from mpl_histcolorbar import histcolorbar
rng = np.random.default_rng(seed=42)
data = rng.standard_normal(size=(25, 100))
fig, ax = plt.subplots()
im = ax.imshow(data)
hcb = histcolorbar(fig, im, location="bottom")
```
Documentation is available at [mpl-histcolorbar.readthedocs.io](https://mpl-histcolorbar.readthedocs.io/en/latest/).
## License
Original code is licensed under the [MIT license](https://opensource.org/licenses/MIT). This project directly derives
from [matplotlib](https://matplotlib.org/), and any use of this project is subject to
the [matplotlib license agreement](https://matplotlib.org/stable/users/project/license.html).
Raw data
{
"_id": null,
"home_page": "",
"name": "mpl-histcolorbar",
"maintainer": "",
"docs_url": null,
"requires_python": ">=3.9",
"maintainer_email": "",
"keywords": "matplotlib,colorbar,histogram",
"author": "",
"author_email": "Jannis Ahlers <jannis.ahlers@monash.edu>",
"download_url": "https://files.pythonhosted.org/packages/99/a3/f756de1a9067df0a64f5ce3a64524d1cd3df26123679cdcb4b6bdd818f11/mpl-histcolorbar-0.1.1.tar.gz",
"platform": null,
"description": "<p align=\"center\">\r\n <img alt=\"mpl-histcolorbar logo\" width=60% src=\"https://raw.githubusercontent.com/jnahlers/mpl-histcolorbar/main/docs/_static/logo.png\">\r\n</p>\r\n\r\n# mpl-histcolorbar\r\n[](https://badge.fury.io/py/mpl-histcolorbar)\r\n[](https://coveralls.io/github/keflavich/mpl-histcolorbar?branch=master)\r\n[](https://mpl-histcolorbar.readthedocs.io/en/latest/?badge=latest)\r\n\r\nA drop-in replacement for matplotlib's colorbar that shows the frequency of each color in the mappable.\r\n\r\n## Getting started\r\n\r\nmpl-histcolorbar is available as [`mpl_histcolorbar`](https://pypi.org/project/mpl_histcolorbar/) on PyPI:\r\n\r\n```bash\r\npip install mpl_histcolorbar\r\n```\r\n\r\n## Usage\r\n\r\n```python\r\nimport numpy as np\r\nimport matplotlib.pyplot as plt\r\nfrom mpl_histcolorbar import histcolorbar\r\n\r\nrng = np.random.default_rng(seed=42)\r\ndata = rng.standard_normal(size=(25, 100))\r\nfig, ax = plt.subplots()\r\nim = ax.imshow(data)\r\nhcb = histcolorbar(fig, im, location=\"bottom\")\r\n```\r\n\r\n\r\n\r\nDocumentation is available at [mpl-histcolorbar.readthedocs.io](https://mpl-histcolorbar.readthedocs.io/en/latest/).\r\n\r\n\r\n## License\r\nOriginal code is licensed under the [MIT license](https://opensource.org/licenses/MIT). This project directly derives \r\nfrom [matplotlib](https://matplotlib.org/), and any use of this project is subject to\r\nthe [matplotlib license agreement](https://matplotlib.org/stable/users/project/license.html). \r\n",
"bugtrack_url": null,
"license": "The MIT License (MIT) Copyright (c) 2013-present Jannis Ahlers Permission is hereby granted, free of charge, to any person obtaining a copy of this software and associated documentation files (the \"Software\"), to deal in the Software without restriction, including without limitation the rights to use, copy, modify, merge, publish, distribute, sublicense, and/or sell copies of the Software, and to permit persons to whom the Software is furnished to do so, subject to the following conditions: The above copyright notice and this permission notice shall be included in all copies or substantial portions of the Software. THE SOFTWARE IS PROVIDED \"AS IS\", WITHOUT WARRANTY OF ANY KIND, EXPRESS OR IMPLIED, INCLUDING BUT NOT LIMITED TO THE WARRANTIES OF MERCHANTABILITY, FITNESS FOR A PARTICULAR PURPOSE AND NONINFRINGEMENT. IN NO EVENT SHALL THE AUTHORS OR COPYRIGHT HOLDERS BE LIABLE FOR ANY CLAIM, DAMAGES OR OTHER LIABILITY, WHETHER IN AN ACTION OF CONTRACT, TORT OR OTHERWISE, ARISING FROM, OUT OF OR IN CONNECTION WITH THE SOFTWARE OR THE USE OR OTHER DEALINGS IN THE SOFTWARE. ",
"summary": "A histogram+colorbar for matplotlib",
"version": "0.1.1",
"project_urls": {
"Homepage": "https://github.com/jnahlers/mpl-histcolorbar"
},
"split_keywords": [
"matplotlib",
"colorbar",
"histogram"
],
"urls": [
{
"comment_text": "",
"digests": {
"blake2b_256": "65ea17461f691348b2a3ee221bbccb78730fcad0c9808b6a1c690e6859015f1a",
"md5": "559a0c7b4c847aebb4c0186ab16c4445",
"sha256": "1e685ec5ae89fd28110bfb703ff7f055137ac5b2242a8730e560ccc954ab7517"
},
"downloads": -1,
"filename": "mpl_histcolorbar-0.1.1-py3-none-any.whl",
"has_sig": false,
"md5_digest": "559a0c7b4c847aebb4c0186ab16c4445",
"packagetype": "bdist_wheel",
"python_version": "py3",
"requires_python": ">=3.9",
"size": 9322,
"upload_time": "2023-08-11T14:00:53",
"upload_time_iso_8601": "2023-08-11T14:00:53.061380Z",
"url": "https://files.pythonhosted.org/packages/65/ea/17461f691348b2a3ee221bbccb78730fcad0c9808b6a1c690e6859015f1a/mpl_histcolorbar-0.1.1-py3-none-any.whl",
"yanked": false,
"yanked_reason": null
},
{
"comment_text": "",
"digests": {
"blake2b_256": "99a3f756de1a9067df0a64f5ce3a64524d1cd3df26123679cdcb4b6bdd818f11",
"md5": "4738d094692100210fd79d55819f092a",
"sha256": "b71e1d31d819d10d72a7384eb3379b2d94d893cabc84b14094ac2124dcd4e8ce"
},
"downloads": -1,
"filename": "mpl-histcolorbar-0.1.1.tar.gz",
"has_sig": false,
"md5_digest": "4738d094692100210fd79d55819f092a",
"packagetype": "sdist",
"python_version": "source",
"requires_python": ">=3.9",
"size": 10176,
"upload_time": "2023-08-11T14:00:54",
"upload_time_iso_8601": "2023-08-11T14:00:54.160275Z",
"url": "https://files.pythonhosted.org/packages/99/a3/f756de1a9067df0a64f5ce3a64524d1cd3df26123679cdcb4b6bdd818f11/mpl-histcolorbar-0.1.1.tar.gz",
"yanked": false,
"yanked_reason": null
}
],
"upload_time": "2023-08-11 14:00:54",
"github": true,
"gitlab": false,
"bitbucket": false,
"codeberg": false,
"github_user": "jnahlers",
"github_project": "mpl-histcolorbar",
"travis_ci": false,
"coveralls": false,
"github_actions": false,
"lcname": "mpl-histcolorbar"
}
