| Name | mpl-markers JSON |
| Version |
0.0.17
 JSON
JSON |
| download |
| home_page | None |
| Summary | interactive data markers for matplotlib |
| upload_time | 2024-11-26 02:30:16 |
| maintainer | None |
| docs_url | None |
| author | None |
| requires_python | >=3.7 |
| license | None |
| keywords |
matplotlib
markers
interactive
|
| VCS |
 |
| bugtrack_url |
|
| requirements |
No requirements were recorded.
|
| Travis-CI |
No Travis.
|
| coveralls test coverage |
No coveralls.
|
# mpl-markers
Interactive data markers for matplotlib.
## Installation
```bash
pip install mpl-markers
```
## Usage
```python
import mpl_markers as mplm
```
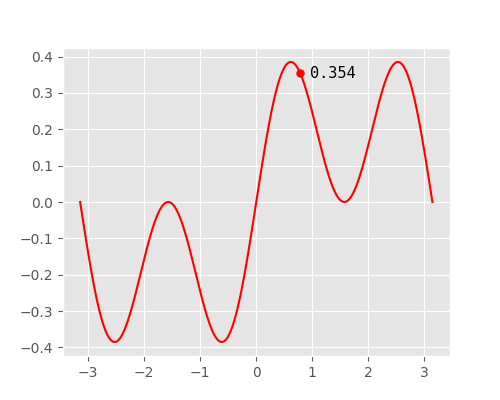
### Line Markers
Add a marker attached to matplotlib data lines:
```python
import numpy as np
import matplotlib.pyplot as plt
fig, ax = plt.subplots(1,1)
x1 = np.linspace(-np.pi, np.pi, 1000)
ax.plot(x1, np.sin(x1)*np.cos(x1)**2)
# create line marker at x=0.
mplm.line_marker(x=0)
```
In interactive matplotlib backends (i.e. Qt5Agg), the marker can be dragged to any location along the data line, or moved incrementally with the left/right arrow keys. Interactive markers are not supported for inline figures
generated in Jupyter Notebooks.
Additional markers can be added by using the Shift+Left Mouse button. The active marker can be removed from the plot by pressing the Delete key.
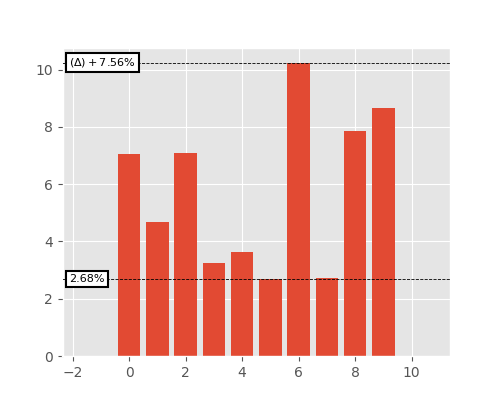
### Axis Markers
Axis markers move freely on the canvas and are not attached to data lines. Axis markers can
reference other markers to create a delta marker.
```python
fig, ax = plt.subplots(1, 1)
y1 = np.random.normal(6, 3, size=10)
ax.bar(np.arange(10), y1)
ax.margins(x=0.2)
# create horizontal axis marker
m1 = mplm.axis_marker(y=np.min(y1), yformatter="{:.2f}%")
# create second marker that is referenced from the first marker m1
mplm.axis_marker(y=np.max(y1), ref_marker=m1, yformatter="{:.2f}%")
```
### Meshgrid Markers
Data markers can also be added to `pcolormesh` plots. The marker label shows the value of the color-mapped z data.
```python
xy = np.linspace(-1, 1, 100)
x, y = np.meshgrid(xy, xy)
z = np.sin(2*x)**2 + np.cos(3*y)**2
fig, ax = plt.subplots(1, 1)
m = ax.pcolormesh(x, y, z, vmin=0, vmax=2)
plt.colorbar(m)
# add a data marker at a single x/y point on the plot. x/y is in data coordinates.
mplm.mesh_marker(x=0.75, y=0)
```
### Scatter Plot Marker
Markers attached to scatter plots can be added with `scatter_marker`.
```python
data_x = np.random.normal(-1, 1, 100)
data_y = np.random.normal(-1, 1, 100)
fig, ax = plt.subplots(1, 1)
s = ax.scatter(data_x, data_y, color="b")
# place the marker on the point closest to x=0.5, y=0.5.
mplm.scatter_marker(
x=0.5,
y=0.5,
yformatter=lambda x, y, pos: f"x={x:.2f}\ny={y:.2f}",
scatterdot=dict(color="cyan", markeredgecolor="cyan"), # change the color of the active point
anchor="upper left",
)
```
## Styling
The marker style is controlled by the `mpl_markers/style/default.json` file:
```json
{
"xline": {
"linewidth": 0.6,
"color": "k",
"linestyle": "dashed"
},
"yline": {
"linewidth": 0.6,
"color": "k",
"linestyle": "dashed"
},
"xlabel": {
"fontsize": 8,
"color": "black",
"bbox": {
"boxstyle": "square",
"facecolor": "white",
"edgecolor": "black",
"alpha": 1,
"linewidth": 1.5
}
},
"ylabel": {
"fontsize": 8,
"bbox": {
"boxstyle": "square",
"facecolor": "white",
"edgecolor": "black",
"alpha": 1,
"linewidth": 1.5
}
},
"zlabel": {
"fontsize": 8,
"bbox": {
"boxstyle": "square",
"facecolor": "white",
"edgecolor": "black",
"alpha": 1,
"linewidth": 1.5
}
},
"datadot": {
"markersize": 10,
"marker": "."
},
"axisdot": {
"markersize": 10,
"marker": ".",
"markerfacecolor":"white",
"markeredgecolor":"k"
},
"scatterdot": {
"markersize": 10,
"marker": ".",
"markeredgewidth": 1,
"markeredgecolor": "white"
}
}
```
To use custom styles, pass in a dictionary of artist settings to the `set_style` method. Keys that do not match those found in `default.json` are ignored. Settings are applied globally to all future markers.
```python
mplm.set_style(
ylabel=dict(fontfamily="monospace", bbox=dict(linewidth=0, facecolor="none"))
)
```
To limit the style scope to a specific axes, artist settings can also be passed into `init_axes` as kwargs. Settings can also be passed to individual markers when they are created, and allows for mixed styles on the same axes.
```python
# Inherits global settings from the last set_style call.
mplm.line_marker(
x=np.pi/4,
ylabel=dict(fontsize=11),
xline=False # turn off the xline artist
)
```
Custom .json files are supported with the `mplm.set_style_json` method. This will set the style on all future markers and must have the same keys as the default.json file:
```python
mplm.set_style_json("user_style.json")
```
## License
mpl-markers is licensed under the MIT License.
Raw data
{
"_id": null,
"home_page": null,
"name": "mpl-markers",
"maintainer": null,
"docs_url": null,
"requires_python": ">=3.7",
"maintainer_email": null,
"keywords": "matplotlib, markers, interactive",
"author": null,
"author_email": "Rick Lyon <rlyon14@gmail.com>",
"download_url": "https://files.pythonhosted.org/packages/5f/df/1940120128ebfef9096b0b4d2a0fee8fca1230b381ab81379c9f8e4f164a/mpl_markers-0.0.17.tar.gz",
"platform": null,
"description": "# mpl-markers\n\nInteractive data markers for matplotlib.\n\n## Installation\n\n```bash\npip install mpl-markers\n```\n\n## Usage\n\n```python\nimport mpl_markers as mplm\n```\n\n### Line Markers\nAdd a marker attached to matplotlib data lines:\n```python\nimport numpy as np\nimport matplotlib.pyplot as plt\n\nfig, ax = plt.subplots(1,1)\nx1 = np.linspace(-np.pi, np.pi, 1000)\n\nax.plot(x1, np.sin(x1)*np.cos(x1)**2)\n# create line marker at x=0.\nmplm.line_marker(x=0)\n```\nIn interactive matplotlib backends (i.e. Qt5Agg), the marker can be dragged to any location along the data line, or moved incrementally with the left/right arrow keys. Interactive markers are not supported for inline figures \ngenerated in Jupyter Notebooks.\n\n\n\nAdditional markers can be added by using the Shift+Left Mouse button. The active marker can be removed from the plot by pressing the Delete key.\n\n### Axis Markers\nAxis markers move freely on the canvas and are not attached to data lines. Axis markers can\nreference other markers to create a delta marker.\n```python\nfig, ax = plt.subplots(1, 1)\ny1 = np.random.normal(6, 3, size=10)\n\nax.bar(np.arange(10), y1)\nax.margins(x=0.2)\n\n# create horizontal axis marker\nm1 = mplm.axis_marker(y=np.min(y1), yformatter=\"{:.2f}%\")\n\n# create second marker that is referenced from the first marker m1\nmplm.axis_marker(y=np.max(y1), ref_marker=m1, yformatter=\"{:.2f}%\")\n```\n\n\n### Meshgrid Markers\nData markers can also be added to `pcolormesh` plots. The marker label shows the value of the color-mapped z data.\n\n```python\nxy = np.linspace(-1, 1, 100)\nx, y = np.meshgrid(xy, xy)\nz = np.sin(2*x)**2 + np.cos(3*y)**2\n\nfig, ax = plt.subplots(1, 1)\nm = ax.pcolormesh(x, y, z, vmin=0, vmax=2)\nplt.colorbar(m)\n\n# add a data marker at a single x/y point on the plot. x/y is in data coordinates.\nmplm.mesh_marker(x=0.75, y=0)\n```\n\n\n### Scatter Plot Marker\n\nMarkers attached to scatter plots can be added with `scatter_marker`.\n\n```python\ndata_x = np.random.normal(-1, 1, 100)\ndata_y = np.random.normal(-1, 1, 100)\n\nfig, ax = plt.subplots(1, 1)\ns = ax.scatter(data_x, data_y, color=\"b\")\n\n# place the marker on the point closest to x=0.5, y=0.5.\nmplm.scatter_marker(\n x=0.5,\n y=0.5,\n yformatter=lambda x, y, pos: f\"x={x:.2f}\\ny={y:.2f}\",\n scatterdot=dict(color=\"cyan\", markeredgecolor=\"cyan\"), # change the color of the active point\n anchor=\"upper left\",\n)\n\n\n```\n\n\n\n## Styling\nThe marker style is controlled by the `mpl_markers/style/default.json` file:\n\n```json\n{\n \"xline\": {\n \"linewidth\": 0.6,\n \"color\": \"k\",\n \"linestyle\": \"dashed\"\n },\n \"yline\": {\n \"linewidth\": 0.6,\n \"color\": \"k\",\n \"linestyle\": \"dashed\"\n },\n \"xlabel\": {\n \"fontsize\": 8,\n \"color\": \"black\",\n \"bbox\": {\n \"boxstyle\": \"square\",\n \"facecolor\": \"white\",\n \"edgecolor\": \"black\",\n \"alpha\": 1,\n \"linewidth\": 1.5\n }\n },\n \"ylabel\": {\n \"fontsize\": 8,\n \"bbox\": {\n \"boxstyle\": \"square\",\n \"facecolor\": \"white\",\n \"edgecolor\": \"black\",\n \"alpha\": 1,\n \"linewidth\": 1.5\n }\n },\n \"zlabel\": {\n \"fontsize\": 8,\n \"bbox\": {\n \"boxstyle\": \"square\",\n \"facecolor\": \"white\",\n \"edgecolor\": \"black\",\n \"alpha\": 1,\n \"linewidth\": 1.5\n }\n },\n \"datadot\": {\n \"markersize\": 10,\n \"marker\": \".\"\n },\n \"axisdot\": {\n \"markersize\": 10,\n \"marker\": \".\",\n \"markerfacecolor\":\"white\", \n \"markeredgecolor\":\"k\"\n },\n \"scatterdot\": {\n \"markersize\": 10,\n \"marker\": \".\",\n \"markeredgewidth\": 1,\n \"markeredgecolor\": \"white\"\n }\n}\n\n```\nTo use custom styles, pass in a dictionary of artist settings to the `set_style` method. Keys that do not match those found in `default.json` are ignored. Settings are applied globally to all future markers.\n\n```python\nmplm.set_style(\n ylabel=dict(fontfamily=\"monospace\", bbox=dict(linewidth=0, facecolor=\"none\"))\n)\n```\n\nTo limit the style scope to a specific axes, artist settings can also be passed into `init_axes` as kwargs. Settings can also be passed to individual markers when they are created, and allows for mixed styles on the same axes. \n\n```python\n# Inherits global settings from the last set_style call.\nmplm.line_marker(\n x=np.pi/4,\n ylabel=dict(fontsize=11), \n xline=False # turn off the xline artist\n)\n```\n\n\nCustom .json files are supported with the `mplm.set_style_json` method. This will set the style on all future markers and must have the same keys as the default.json file:\n\n```python\nmplm.set_style_json(\"user_style.json\")\n```\n\n## License\n\nmpl-markers is licensed under the MIT License.\n",
"bugtrack_url": null,
"license": null,
"summary": "interactive data markers for matplotlib",
"version": "0.0.17",
"project_urls": {
"repository": "https://github.com/ricklyon/mpl_markers"
},
"split_keywords": [
"matplotlib",
" markers",
" interactive"
],
"urls": [
{
"comment_text": "",
"digests": {
"blake2b_256": "3b980190f1234bd3507764609734e70d9cffdf9b98183931b0ffb43721e66af8",
"md5": "b7b04881c84168e4dc270e2803661bab",
"sha256": "484900ecce5d160944388d058a0357ccc67bdbd152a44567fa990e1ad4edb8cb"
},
"downloads": -1,
"filename": "mpl_markers-0.0.17-py3-none-any.whl",
"has_sig": false,
"md5_digest": "b7b04881c84168e4dc270e2803661bab",
"packagetype": "bdist_wheel",
"python_version": "py3",
"requires_python": ">=3.7",
"size": 22562,
"upload_time": "2024-11-26T02:30:13",
"upload_time_iso_8601": "2024-11-26T02:30:13.809122Z",
"url": "https://files.pythonhosted.org/packages/3b/98/0190f1234bd3507764609734e70d9cffdf9b98183931b0ffb43721e66af8/mpl_markers-0.0.17-py3-none-any.whl",
"yanked": false,
"yanked_reason": null
},
{
"comment_text": "",
"digests": {
"blake2b_256": "5fdf1940120128ebfef9096b0b4d2a0fee8fca1230b381ab81379c9f8e4f164a",
"md5": "85e8983311fda95ee5d16d90fae8a2ae",
"sha256": "1b9ca72b68a37ec77751a942f294b107db31a817f7a0e3177ae47dd2cc215891"
},
"downloads": -1,
"filename": "mpl_markers-0.0.17.tar.gz",
"has_sig": false,
"md5_digest": "85e8983311fda95ee5d16d90fae8a2ae",
"packagetype": "sdist",
"python_version": "source",
"requires_python": ">=3.7",
"size": 26929,
"upload_time": "2024-11-26T02:30:16",
"upload_time_iso_8601": "2024-11-26T02:30:16.146448Z",
"url": "https://files.pythonhosted.org/packages/5f/df/1940120128ebfef9096b0b4d2a0fee8fca1230b381ab81379c9f8e4f164a/mpl_markers-0.0.17.tar.gz",
"yanked": false,
"yanked_reason": null
}
],
"upload_time": "2024-11-26 02:30:16",
"github": true,
"gitlab": false,
"bitbucket": false,
"codeberg": false,
"github_user": "ricklyon",
"github_project": "mpl_markers",
"travis_ci": false,
"coveralls": false,
"github_actions": true,
"requirements": [],
"lcname": "mpl-markers"
}
