
**mplsoccer is a Python library for plotting soccer/football charts in Matplotlib
and loading StatsBomb open-data.**
---
## Installation
Use the package manager [pip](https://pip.pypa.io/en/stable/) to install mplsoccer.
```bash
pip install mplsoccer
```
Or install via [Anaconda](https://docs.anaconda.com/free/anaconda/install/index.html).
```bash
conda install -c conda-forge mplsoccer
```
---
## Docs
Read more in the [docs](https://mplsoccer.readthedocs.io/) and see some
examples in our [gallery](https://mplsoccer.readthedocs.io/en/latest/gallery/index.html).
---
## Quick start
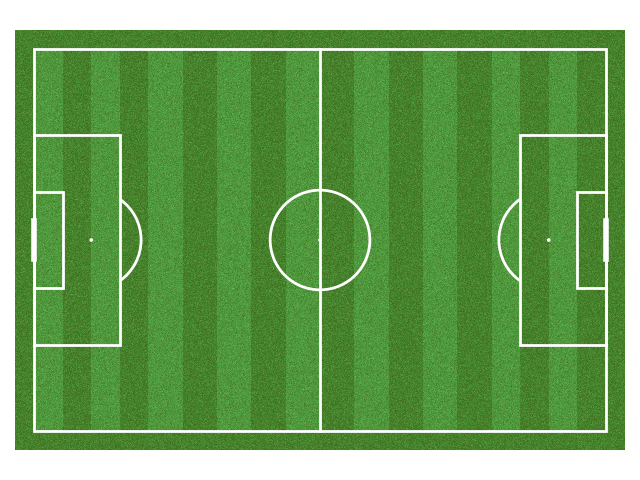
Plot a StatsBomb pitch
```python
from mplsoccer import Pitch
import matplotlib.pyplot as plt
pitch = Pitch(pitch_color='grass', line_color='white', stripe=True)
fig, ax = pitch.draw()
plt.show()
```
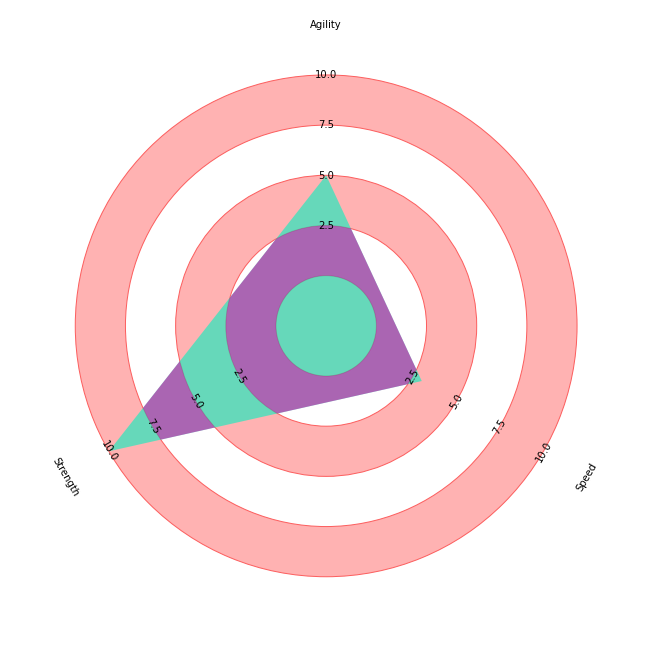
Plot a Radar
```python
from mplsoccer import Radar
import matplotlib.pyplot as plt
radar = Radar(params=['Agility', 'Speed', 'Strength'], min_range=[0, 0, 0], max_range=[10, 10, 10])
fig, ax = radar.setup_axis()
rings_inner = radar.draw_circles(ax=ax, facecolor='#ffb2b2', edgecolor='#fc5f5f')
values = [5, 3, 10]
radar_poly, rings, vertices = radar.draw_radar(values, ax=ax,
kwargs_radar={'facecolor': '#00f2c1', 'alpha': 0.6},
kwargs_rings={'facecolor': '#d80499', 'alpha': 0.6})
range_labels = radar.draw_range_labels(ax=ax)
param_labels = radar.draw_param_labels(ax=ax)
plt.show()
```
---
## What is mplsoccer?
In mplsoccer, you can:
- plot football/soccer pitches on nine different pitch types
- plot radar charts
- plot Nightingale/pizza charts
- plot bumpy charts for showing changes over time
- plot arrows, heatmaps, hexbins, scatter, and (comet) lines
- load StatsBomb data as a tidy dataframe
- standardize pitch coordinates into a single format
I hope mplsoccer helps you make insightful graphics faster,
so you don't have to build charts from scratch.
---
## Want to help?
I would love the community to get involved in mplsoccer.
Take a look at our [open-issues](https://github.com/andrewRowlinson/mplsoccer/issues)
for inspiration.
Please get in touch at rowlinsonandy@gmail.com or
[@numberstorm](https://twitter.com/numberstorm) on Twitter to find out more.
---
## Recent changes
View the [changelog](https://github.com/andrewRowlinson/mplsoccer/blob/master/CHANGELOG.md)
for a full list of the recent changes to mplsoccer.
---
## Inspiration
mplsoccer was inspired by:
- [Peter McKeever](https://petermckeever.com/) heavily inspired the API design
- [ggsoccer](https://github.com/Torvaney/ggsoccer) influenced the design and Standardizer
- [lastrow's](https://twitter.com/lastrowview) legendary animations
- [fcrstats'](https://twitter.com/FC_rstats) tutorials for using football data
- [fcpython's](https://fcpython.com/) Python tutorials for using football data
- [Karun Singh's](https://twitter.com/karun1710) expected threat (xT) visualizations
- [StatsBomb's](https://statsbomb.com/) great visual design and free open-data
- John Burn-Murdoch's [tweet](https://twitter.com/jburnmurdoch/status/1057907312030085120) got me
interested in football analytics
---
## License
[MIT](https://choosealicense.com/licenses/mit)
Raw data
{
"_id": null,
"home_page": null,
"name": "mplsoccer",
"maintainer": null,
"docs_url": null,
"requires_python": ">=3.10",
"maintainer_email": null,
"keywords": "football, matplotlib, mplsoccer, soccer, visualization",
"author": null,
"author_email": "Andrew Rowlinson <rowlinsonandy@gmail.com>, Anmol Durgapal <slothfulwave10@gmail.com>",
"download_url": "https://files.pythonhosted.org/packages/2e/df/e810b16644a51d3055a0c0942d7f267fc08ae3d313545dcd4ad423ed61b9/mplsoccer-1.6.1.tar.gz",
"platform": null,
"description": "\n\n**mplsoccer is a Python library for plotting soccer/football charts in Matplotlib \nand loading StatsBomb open-data.**\n\n---\n\n## Installation\n\nUse the package manager [pip](https://pip.pypa.io/en/stable/) to install mplsoccer.\n\n```bash\npip install mplsoccer\n```\n\nOr install via [Anaconda](https://docs.anaconda.com/free/anaconda/install/index.html).\n\n```bash\nconda install -c conda-forge mplsoccer\n```\n\n---\n\n## Docs\n\nRead more in the [docs](https://mplsoccer.readthedocs.io/) and see some \nexamples in our [gallery](https://mplsoccer.readthedocs.io/en/latest/gallery/index.html).\n\n---\n\n## Quick start\n\nPlot a StatsBomb pitch\n\n```python\nfrom mplsoccer import Pitch\nimport matplotlib.pyplot as plt\npitch = Pitch(pitch_color='grass', line_color='white', stripe=True)\nfig, ax = pitch.draw()\nplt.show()\n```\n\n\nPlot a Radar\n```python\nfrom mplsoccer import Radar\nimport matplotlib.pyplot as plt\nradar = Radar(params=['Agility', 'Speed', 'Strength'], min_range=[0, 0, 0], max_range=[10, 10, 10])\nfig, ax = radar.setup_axis()\nrings_inner = radar.draw_circles(ax=ax, facecolor='#ffb2b2', edgecolor='#fc5f5f')\nvalues = [5, 3, 10]\nradar_poly, rings, vertices = radar.draw_radar(values, ax=ax,\n kwargs_radar={'facecolor': '#00f2c1', 'alpha': 0.6}, \n kwargs_rings={'facecolor': '#d80499', 'alpha': 0.6})\nrange_labels = radar.draw_range_labels(ax=ax)\nparam_labels = radar.draw_param_labels(ax=ax)\nplt.show()\n```\n\n\n---\n\n## What is mplsoccer?\nIn mplsoccer, you can:\n\n- plot football/soccer pitches on nine different pitch types\n- plot radar charts\n- plot Nightingale/pizza charts\n- plot bumpy charts for showing changes over time\n- plot arrows, heatmaps, hexbins, scatter, and (comet) lines\n- load StatsBomb data as a tidy dataframe\n- standardize pitch coordinates into a single format\n\nI hope mplsoccer helps you make insightful graphics faster,\nso you don't have to build charts from scratch.\n\n---\n\n## Want to help?\nI would love the community to get involved in mplsoccer.\nTake a look at our [open-issues](https://github.com/andrewRowlinson/mplsoccer/issues) \nfor inspiration.\nPlease get in touch at rowlinsonandy@gmail.com or \n[@numberstorm](https://twitter.com/numberstorm) on Twitter to find out more.\n\n---\n\n## Recent changes\n\nView the [changelog](https://github.com/andrewRowlinson/mplsoccer/blob/master/CHANGELOG.md) \nfor a full list of the recent changes to mplsoccer.\n\n---\n\n## Inspiration\n\nmplsoccer was inspired by:\n- [Peter McKeever](https://petermckeever.com/) heavily inspired the API design\n- [ggsoccer](https://github.com/Torvaney/ggsoccer) influenced the design and Standardizer\n- [lastrow's](https://twitter.com/lastrowview) legendary animations\n- [fcrstats'](https://twitter.com/FC_rstats) tutorials for using football data\n- [fcpython's](https://fcpython.com/) Python tutorials for using football data\n- [Karun Singh's](https://twitter.com/karun1710) expected threat (xT) visualizations\n- [StatsBomb's](https://statsbomb.com/) great visual design and free open-data\n- John Burn-Murdoch's [tweet](https://twitter.com/jburnmurdoch/status/1057907312030085120) got me \ninterested in football analytics\n\n---\n\n## License\n\n[MIT](https://choosealicense.com/licenses/mit)\n",
"bugtrack_url": null,
"license": null,
"summary": "Football pitch plotting library for matplotlib",
"version": "1.6.1",
"project_urls": {
"Documentation": "https://mplsoccer.readthedocs.io",
"Issues": "https://github.com/andrewRowlinson/mplsoccer/issues",
"Source": "https://github.com/andrewRowlinson/mplsoccer"
},
"split_keywords": [
"football",
" matplotlib",
" mplsoccer",
" soccer",
" visualization"
],
"urls": [
{
"comment_text": null,
"digests": {
"blake2b_256": "6e638dd3cdf8acac342d5011900c10d2a8238d648b796e0ab45c6603668d1741",
"md5": "bf123c86515be22d58aa91b20f908e0e",
"sha256": "a8311a32290804b5d8d8aa4c117b2ec8d2444cbf72cb06ec40120072ee2da6dd"
},
"downloads": -1,
"filename": "mplsoccer-1.6.1-py3-none-any.whl",
"has_sig": false,
"md5_digest": "bf123c86515be22d58aa91b20f908e0e",
"packagetype": "bdist_wheel",
"python_version": "py3",
"requires_python": ">=3.10",
"size": 88512,
"upload_time": "2025-11-01T07:27:08",
"upload_time_iso_8601": "2025-11-01T07:27:08.247959Z",
"url": "https://files.pythonhosted.org/packages/6e/63/8dd3cdf8acac342d5011900c10d2a8238d648b796e0ab45c6603668d1741/mplsoccer-1.6.1-py3-none-any.whl",
"yanked": false,
"yanked_reason": null
},
{
"comment_text": null,
"digests": {
"blake2b_256": "2edfe810b16644a51d3055a0c0942d7f267fc08ae3d313545dcd4ad423ed61b9",
"md5": "f90c10f1a37869e716eb808c19b3f0ca",
"sha256": "021d5369049d3f3f2aecade7b3a94240e0c2b5458835bdca09421a01ad9d0f15"
},
"downloads": -1,
"filename": "mplsoccer-1.6.1.tar.gz",
"has_sig": false,
"md5_digest": "f90c10f1a37869e716eb808c19b3f0ca",
"packagetype": "sdist",
"python_version": "source",
"requires_python": ">=3.10",
"size": 832792,
"upload_time": "2025-11-01T07:27:06",
"upload_time_iso_8601": "2025-11-01T07:27:06.941785Z",
"url": "https://files.pythonhosted.org/packages/2e/df/e810b16644a51d3055a0c0942d7f267fc08ae3d313545dcd4ad423ed61b9/mplsoccer-1.6.1.tar.gz",
"yanked": false,
"yanked_reason": null
}
],
"upload_time": "2025-11-01 07:27:06",
"github": true,
"gitlab": false,
"bitbucket": false,
"codeberg": false,
"github_user": "andrewRowlinson",
"github_project": "mplsoccer",
"travis_ci": false,
"coveralls": false,
"github_actions": false,
"lcname": "mplsoccer"
}

