| Name | openchord JSON |
| Version |
0.1.7
 JSON
JSON |
| download |
| home_page | |
| Summary | A library for ploting chord diagrams |
| upload_time | 2023-04-24 21:05:32 |
| maintainer | |
| docs_url | None |
| author | |
| requires_python | >=3.6 |
| license | |
| keywords |
plot
data science
jupyter
network
graph
|
| VCS |
|
| bugtrack_url |
|
| requirements |
No requirements were recorded.
|
| Travis-CI |
No Travis.
|
| coveralls test coverage |
No coveralls.
|
# OpenChord
<img src="https://raw.githubusercontent.com/pke1029/open-chord/main/media/logo.svg" width="360" height="100">
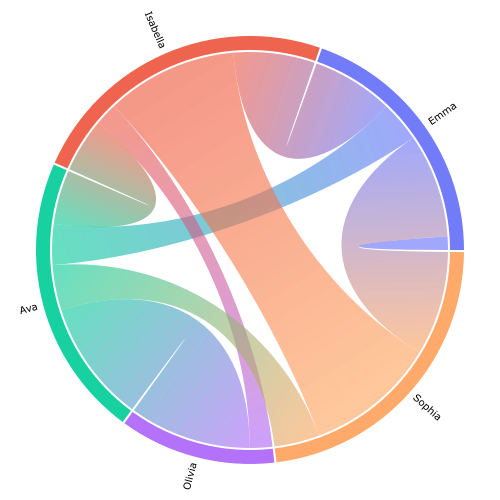
OpenChord is a Python library I am developing to plot beautiful chord diagrams for visualising networks and graphs. OpenChord uses the `drawsvg` library and can display figures in a Jupyter notebook or Jupyter lab. Other libraries for drawing chord diagram includes [PlotAPI](https://plotapi.com/) (paid), [Bokeh](https://holoviews.org/reference/elements/bokeh/Chord.html) (visible moire artifact), and [Plotly](https://plotly.com/python/v3/filled-chord-diagram/) (tedious).
## Installation
OpenChord is now on PyPI.org! Install using the command
```
pip install openchord
```
## Usage
Currently, the function only support symmetric adjacency matricies (i.e. weighted graph, non-directed)
```python
import openchord as ocd
adjacency_matrix = [[ 3, 18, 9, 0, 23],
[18, 0, 12, 5, 29],
[ 9, 12, 0, 27, 10],
[ 0, 5, 27, 0, 0],
[23, 29, 10, 0, 0]]
labels = ['Emma', 'Isabella', 'Ava', 'Olivia', 'Sophia']
fig = ocd.Chord(adjacency_matrix, labels)
fig.show()
```
Color can be changed like so
```python
fig.colormap = ['#636EFA', '#EF553B', '#00CC96', '#AB63FA', '#FFA15A', '#19D3F3', '#FF6692', '#B6E880', '#FF97FF', '#FECB52']
fig.show()
```
You can export the figure as an .svg file and open it in a vector graphics software such as [Inkscape](https://inkscape.org/)
```python
fig.save_svg("figure.svg")
```
## More tutorials and examples
I wrote a few more tutorials available via the link below and in the `/examples` directory. Feel free to download them and run it yourself.
1. [Quick Start](https://github.com/pke1029/open-chord/blob/main/examples/01_quick_start.ipynb)
* First chord diagram
* Radius
* Padding
* Font size and font family
* Colormap
* Gap size
* Background color and transparancy
2. [The Logo](https://github.com/pke1029/open-chord/blob/main/examples/02_the_logo.ipynb) (The text is not centered vertically when viewed on GitHub)
* Rotation
* Custom plot area
* Gradient style
* Arc thickness
* Text position
* Ribbon gap
* Ribbon stiffness
* Save as SVG
Raw data
{
"_id": null,
"home_page": "",
"name": "openchord",
"maintainer": "",
"docs_url": null,
"requires_python": ">=3.6",
"maintainer_email": "",
"keywords": "plot,data science,Jupyter,network,graph",
"author": "",
"author_email": "Kenny Pang <pangkhangee@gmail.com>",
"download_url": "https://files.pythonhosted.org/packages/8e/2c/e4f2720b66398270baebc2f4f3287992c51d34f9677db6d24e65fd9a44c8/openchord-0.1.7.tar.gz",
"platform": null,
"description": "# OpenChord\r\n\r\n<img src=\"https://raw.githubusercontent.com/pke1029/open-chord/main/media/logo.svg\" width=\"360\" height=\"100\">\r\n\r\nOpenChord is a Python library I am developing to plot beautiful chord diagrams for visualising networks and graphs. OpenChord uses the `drawsvg` library and can display figures in a Jupyter notebook or Jupyter lab. Other libraries for drawing chord diagram includes [PlotAPI](https://plotapi.com/) (paid), [Bokeh](https://holoviews.org/reference/elements/bokeh/Chord.html) (visible moire artifact), and [Plotly](https://plotly.com/python/v3/filled-chord-diagram/) (tedious). \r\n\r\n## Installation\r\n\r\nOpenChord is now on PyPI.org! Install using the command\r\n```\r\npip install openchord\r\n```\r\n\r\n## Usage\r\n\r\nCurrently, the function only support symmetric adjacency matricies (i.e. weighted graph, non-directed)\r\n```python\r\nimport openchord as ocd\r\n\r\nadjacency_matrix = [[ 3, 18, 9, 0, 23],\r\n [18, 0, 12, 5, 29],\r\n [ 9, 12, 0, 27, 10],\r\n [ 0, 5, 27, 0, 0],\r\n [23, 29, 10, 0, 0]]\r\nlabels = ['Emma', 'Isabella', 'Ava', 'Olivia', 'Sophia']\r\n\r\nfig = ocd.Chord(adjacency_matrix, labels)\r\nfig.show()\r\n```\r\nColor can be changed like so\r\n```python\r\nfig.colormap = ['#636EFA', '#EF553B', '#00CC96', '#AB63FA', '#FFA15A', '#19D3F3', '#FF6692', '#B6E880', '#FF97FF', '#FECB52']\r\nfig.show()\r\n```\r\nYou can export the figure as an .svg file and open it in a vector graphics software such as [Inkscape](https://inkscape.org/)\r\n```python\r\nfig.save_svg(\"figure.svg\")\r\n```\r\n\r\n\r\n## More tutorials and examples\r\nI wrote a few more tutorials available via the link below and in the `/examples` directory. Feel free to download them and run it yourself. \r\n\r\n1. [Quick Start](https://github.com/pke1029/open-chord/blob/main/examples/01_quick_start.ipynb)\r\n * First chord diagram\r\n * Radius\r\n * Padding\r\n * Font size and font family\r\n * Colormap\r\n * Gap size\r\n * Background color and transparancy\r\n\r\n2. [The Logo](https://github.com/pke1029/open-chord/blob/main/examples/02_the_logo.ipynb) (The text is not centered vertically when viewed on GitHub)\r\n * Rotation\r\n * Custom plot area\r\n * Gradient style\r\n * Arc thickness\r\n * Text position\r\n * Ribbon gap\r\n * Ribbon stiffness\r\n * Save as SVG\r\n",
"bugtrack_url": null,
"license": "",
"summary": "A library for ploting chord diagrams",
"version": "0.1.7",
"split_keywords": [
"plot",
"data science",
"jupyter",
"network",
"graph"
],
"urls": [
{
"comment_text": "",
"digests": {
"blake2b_256": "2aa4183af26f158e6edc041fdebb7a396c6b0155e5565455098ea96b6cde2b21",
"md5": "9beb2941ee4f8aa9a0855cb6a3cec5a3",
"sha256": "88a3db6e81c86f8b2723c29bd8d456b52a59692af86b11ce4c9190f2f9bb0efd"
},
"downloads": -1,
"filename": "openchord-0.1.7-py3-none-any.whl",
"has_sig": false,
"md5_digest": "9beb2941ee4f8aa9a0855cb6a3cec5a3",
"packagetype": "bdist_wheel",
"python_version": "py3",
"requires_python": ">=3.6",
"size": 17766,
"upload_time": "2023-04-24T21:05:30",
"upload_time_iso_8601": "2023-04-24T21:05:30.170352Z",
"url": "https://files.pythonhosted.org/packages/2a/a4/183af26f158e6edc041fdebb7a396c6b0155e5565455098ea96b6cde2b21/openchord-0.1.7-py3-none-any.whl",
"yanked": false,
"yanked_reason": null
},
{
"comment_text": "",
"digests": {
"blake2b_256": "8e2ce4f2720b66398270baebc2f4f3287992c51d34f9677db6d24e65fd9a44c8",
"md5": "89cfe38de3876325db853594656baecd",
"sha256": "e96760902083607bff6dfdb7e85eb2308528f059f37f8722cbf876c5ba072520"
},
"downloads": -1,
"filename": "openchord-0.1.7.tar.gz",
"has_sig": false,
"md5_digest": "89cfe38de3876325db853594656baecd",
"packagetype": "sdist",
"python_version": "source",
"requires_python": ">=3.6",
"size": 17686,
"upload_time": "2023-04-24T21:05:32",
"upload_time_iso_8601": "2023-04-24T21:05:32.635113Z",
"url": "https://files.pythonhosted.org/packages/8e/2c/e4f2720b66398270baebc2f4f3287992c51d34f9677db6d24e65fd9a44c8/openchord-0.1.7.tar.gz",
"yanked": false,
"yanked_reason": null
}
],
"upload_time": "2023-04-24 21:05:32",
"github": false,
"gitlab": false,
"bitbucket": false,
"lcname": "openchord"
}
