# pandas-plots
   
## usage
install / update package
```bash
uv add -U pandas-plots
# if no uv is available:
# pip install pandas-plots -U
```
include in python
```python
from pandas_plots import tbl, pls, ven, hlp
```
## example
```python
# load sample dataset from seaborn
import seaborn as sb
df = sb.load_dataset('taxis')
```
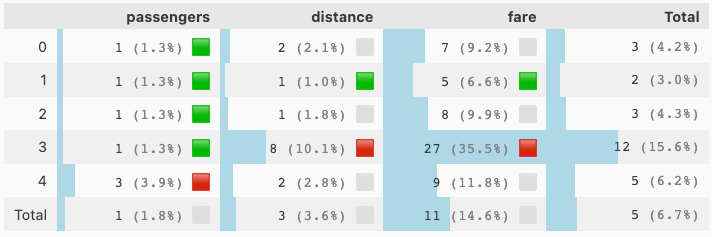
```python
_df = df[["passengers", "distance", "fare"]][:5]
tbl.show_num_df(
_df,
total_axis="xy",
total_mode="mean",
data_bar_axis="xy",
pct_axis="xy",
precision=0,
kpi_mode="max_min_x",
kpi_rag_list=(1,7),
)
```
## why use pandas-plots
`pandas-plots` is a package to help you examine and visualize data that are organized in a pandas DataFrame. It provides a high level api to pandas / plotly with some selected functions and predefined options:
- `tbl` utilities for table descriptions
- `show_num_df()` displays a table as styled version with additional information
- `describe_df()` an alternative version of pandas `describe()` function
- `descr_db()` a very short descr for a `duckdb` relation
- `pivot_df()` gets a pivot table of a 3 column dataframe (or 2 columns if no weights are given)
- `print_summary()` shows statistics for a pandas DataFrame or Series
<br>
- `pls` for plotly visualizations
- `plot_box()` auto annotated boxplot w/ violin option
- `plot_boxes()` multiple boxplots _(annotation is experimental)_
- `plot_stacked_bars()` shortcut to stacked bars
- `plots_bars()` a standardized bar plot for a **categorical** column
- features confidence intervals via `use_ci` option
- `plot_histogram()` histogram for one or more **numerical** columns
- `plot_joints()` a joint plot for **exactly two numerical** columns
- `plot_quadrants()` quickly shows a 2x2 heatmap
- `plot_facet_stacked_bars()` shows stacked bars for a facet value as subplots
- `plot_sankey()` generates a Sankey diagram
- `plot_pie()` generates a pie chart
- variants for **large** datasets - these use seaborn instead of plotly to dramatically lower file size
- `plot_box_large()`
- `plot_boxes_large()`
- `plot_histogram_large()`
<br>
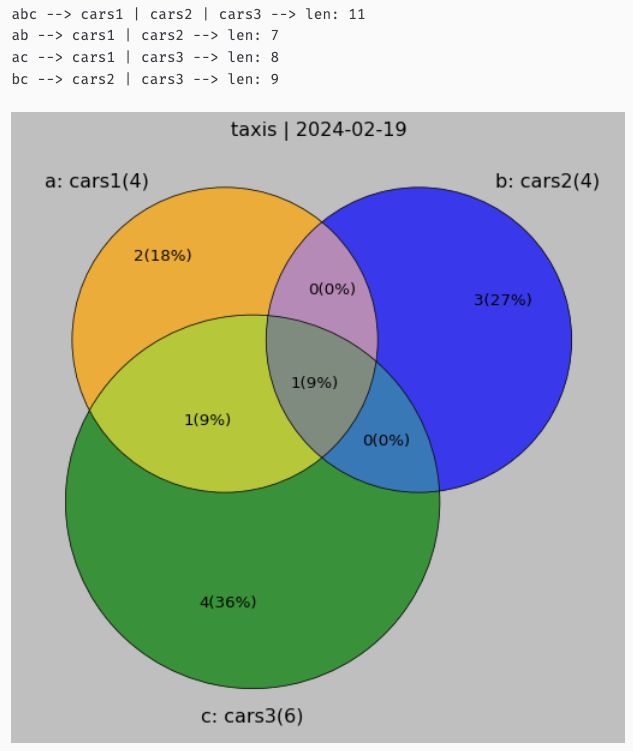
- `ven` offers functions for _venn diagrams_
- `show_venn2()` displays a venn diagram for 2 sets
- `show_venn3()` displays a venn diagram for 3 sets
<br>
- `hlp` contains some (variety) helper functions
- `to_series()` converts a dataframe to a series
- `mean_confidence_interval()` calculates mean and confidence interval for a series
- `wrap_text()` formats strings or lists to a given width to fit nicely on the screen
- `replace_delimiter_outside_quotes()` when manual import of csv files is needed: replaces delimiters only outside of quotes
- `create_barcode_from_url()` creates a barcode from a given URL
- `add_datetime_col()` adds a datetime columns to a dataframe (chainable)
- `show_package_version` prints version of a list of packages
- `get_os` helps to identify and ensure operating system at runtime
- `add_bitmask_label()` adds a column to the data that resolves a bitmask column into human-readable labels
- `find_cols()` finds all columns in a list of columns that contain any of the given stubs
- `add_measures_to_pyg_config()` adds measures to a pygwalker config file to avoid frequent manual update
- `get_tum_details()` prints the details of a specific tumor (needs con to clinical cancer data)
- `set_theme()` sets the theme for pandas-plots notebooks. ensures light theme upon printing.
<br>
> theme setting ☀️ 🌔 can be controlled through all functions by calling `set_theme()` to either `'light'` or `'dark'`
> renderer can be controlled through all functions by setting the environment variable `'RENDERER'` to `'png'` or `'svg'` for printing to markdown or pdf
## prerequisites
- ⚠️ for static image generation, this package uses Plotly's kaleido engine, which requires a system-wide installation of the Chrome or Chromium browser
- if image generation fails, it may be because a compatible browser is missing
- in such cases, please run `kaleido_get_chrome` from your terminal to install the necessary dependency.
## more examples
```python
pls.plot_box(df['fare'], height=400, violin=True)
```

```python
# quick and exhaustive description of any table
tbl.describe_df(df, 'taxis', top_n_uniques=5)
```

```python
# show bars with confidence intervals
_df = df[["payment", "fare"]]
pls.plot_bars(
_df,
dropna=False,
use_ci=True,
height=600,
width=800,
precision=1,
)
```

```python
# show venn diagram for 3 sets
from pandas_plots import ven
set_a = {'ford','ferrari','mercedes', 'bmw'}
set_b = {'opel','bmw','bentley','audi'}
set_c = {'ferrari','bmw','chrysler','renault','peugeot','fiat'}
_df, _details = ven.show_venn3(
title="taxis",
a_set=set_a,
a_label="cars1",
b_set=set_b,
b_label="cars2",
c_set=set_c,
c_label="cars3",
verbose=0,
size=8,
)
```
## tags
#pandas, #plotly, #visualizations, #statistics
Raw data
{
"_id": null,
"home_page": null,
"name": "pandas-plots",
"maintainer": null,
"docs_url": null,
"requires_python": ">=3.11",
"maintainer_email": null,
"keywords": "tables, pivot, plotly, venn, plot, vizualization",
"author": "smeisegeier",
"author_email": "smeisegeier <dexterDSD@googlemail.com>",
"download_url": "https://files.pythonhosted.org/packages/c5/b3/895f59226569055a7bd780b0a33b9d19e712411eae9e3b29a3a17f0ba8fb/pandas_plots-0.20.3.tar.gz",
"platform": null,
"description": "# pandas-plots\n\n   \n\n## usage\n\ninstall / update package\n\n```bash\nuv add -U pandas-plots\n# if no uv is available:\n# pip install pandas-plots -U\n```\n\ninclude in python\n\n```python\nfrom pandas_plots import tbl, pls, ven, hlp\n```\n\n## example\n\n```python\n# load sample dataset from seaborn\nimport seaborn as sb\ndf = sb.load_dataset('taxis')\n```\n\n```python\n_df = df[[\"passengers\", \"distance\", \"fare\"]][:5]\ntbl.show_num_df(\n _df,\n total_axis=\"xy\",\n total_mode=\"mean\",\n data_bar_axis=\"xy\",\n pct_axis=\"xy\",\n precision=0,\n kpi_mode=\"max_min_x\",\n kpi_rag_list=(1,7),\n)\n```\n\n\n\n## why use pandas-plots\n\n`pandas-plots` is a package to help you examine and visualize data that are organized in a pandas DataFrame. It provides a high level api to pandas / plotly with some selected functions and predefined options:\n\n- `tbl` utilities for table descriptions\n - `show_num_df()` displays a table as styled version with additional information\n - `describe_df()` an alternative version of pandas `describe()` function\n - `descr_db()` a very short descr for a `duckdb` relation\n - `pivot_df()` gets a pivot table of a 3 column dataframe (or 2 columns if no weights are given)\n - `print_summary()` shows statistics for a pandas DataFrame or Series\n<br>\n\n- `pls` for plotly visualizations\n - `plot_box()` auto annotated boxplot w/ violin option\n - `plot_boxes()` multiple boxplots _(annotation is experimental)_\n - `plot_stacked_bars()` shortcut to stacked bars\n - `plots_bars()` a standardized bar plot for a **categorical** column\n - features confidence intervals via `use_ci` option\n - `plot_histogram()` histogram for one or more **numerical** columns\n - `plot_joints()` a joint plot for **exactly two numerical** columns\n - `plot_quadrants()` quickly shows a 2x2 heatmap\n - `plot_facet_stacked_bars()` shows stacked bars for a facet value as subplots \n - `plot_sankey()` generates a Sankey diagram\n - `plot_pie()` generates a pie chart\n - variants for **large** datasets - these use seaborn instead of plotly to dramatically lower file size\n - `plot_box_large()`\n - `plot_boxes_large()`\n - `plot_histogram_large()`\n\n<br>\n\n- `ven` offers functions for _venn diagrams_\n - `show_venn2()` displays a venn diagram for 2 sets\n - `show_venn3()` displays a venn diagram for 3 sets\n<br>\n\n- `hlp` contains some (variety) helper functions\n - `to_series()` converts a dataframe to a series\n - `mean_confidence_interval()` calculates mean and confidence interval for a series\n - `wrap_text()` formats strings or lists to a given width to fit nicely on the screen\n - `replace_delimiter_outside_quotes()` when manual import of csv files is needed: replaces delimiters only outside of quotes\n - `create_barcode_from_url()` creates a barcode from a given URL\n - `add_datetime_col()` adds a datetime columns to a dataframe (chainable)\n - `show_package_version` prints version of a list of packages\n - `get_os` helps to identify and ensure operating system at runtime\n - `add_bitmask_label()` adds a column to the data that resolves a bitmask column into human-readable labels\n - `find_cols()` finds all columns in a list of columns that contain any of the given stubs\n - `add_measures_to_pyg_config()` adds measures to a pygwalker config file to avoid frequent manual update\n - `get_tum_details()` prints the details of a specific tumor (needs con to clinical cancer data)\n - `set_theme()` sets the theme for pandas-plots notebooks. ensures light theme upon printing.\n<br>\n\n> theme setting \u2600\ufe0f \ud83c\udf14 can be controlled through all functions by calling `set_theme()` to either `'light'` or `'dark'`\n\n> renderer can be controlled through all functions by setting the environment variable `'RENDERER'` to `'png'` or `'svg'` for printing to markdown or pdf\n\n## prerequisites\n\n- \u26a0\ufe0f for static image generation, this package uses Plotly's kaleido engine, which requires a system-wide installation of the Chrome or Chromium browser\n- if image generation fails, it may be because a compatible browser is missing\n- in such cases, please run `kaleido_get_chrome` from your terminal to install the necessary dependency.\n\n## more examples\n\n```python\npls.plot_box(df['fare'], height=400, violin=True)\n```\n\n\n\n```python\n# quick and exhaustive description of any table\ntbl.describe_df(df, 'taxis', top_n_uniques=5)\n```\n\n\n\n```python\n# show bars with confidence intervals\n_df = df[[\"payment\", \"fare\"]]\npls.plot_bars(\n _df,\n dropna=False,\n use_ci=True,\n height=600,\n width=800,\n precision=1,\n)\n```\n\n\n\n```python\n# show venn diagram for 3 sets\nfrom pandas_plots import ven\n\nset_a = {'ford','ferrari','mercedes', 'bmw'}\nset_b = {'opel','bmw','bentley','audi'}\nset_c = {'ferrari','bmw','chrysler','renault','peugeot','fiat'}\n_df, _details = ven.show_venn3(\n title=\"taxis\",\n a_set=set_a,\n a_label=\"cars1\",\n b_set=set_b,\n b_label=\"cars2\",\n c_set=set_c,\n c_label=\"cars3\",\n verbose=0,\n size=8,\n)\n```\n\n\n\n## tags\n\n#pandas, #plotly, #visualizations, #statistics",
"bugtrack_url": null,
"license": null,
"summary": "A collection of helper for table handling and visualization",
"version": "0.20.3",
"project_urls": {
"Bug Tracker": "https://github.com/smeisegeier/pandas-plots/issues",
"Homepage": "https://github.com/smeisegeier/pandas-plots",
"Repository": "https://github.com/smeisegeier/pandas-plots"
},
"split_keywords": [
"tables",
" pivot",
" plotly",
" venn",
" plot",
" vizualization"
],
"urls": [
{
"comment_text": null,
"digests": {
"blake2b_256": "bef08b643185470d18a1b36d98c5a308188292cf697c26759b05328b320603ca",
"md5": "9b218aa9a790262085a8af4749d301a2",
"sha256": "ea15e84c5fcc3505f843bf006964187463a1a809f2adb163cac4844ad38c8df2"
},
"downloads": -1,
"filename": "pandas_plots-0.20.3-py3-none-any.whl",
"has_sig": false,
"md5_digest": "9b218aa9a790262085a8af4749d301a2",
"packagetype": "bdist_wheel",
"python_version": "py3",
"requires_python": ">=3.11",
"size": 117273,
"upload_time": "2025-10-24T14:53:03",
"upload_time_iso_8601": "2025-10-24T14:53:03.805399Z",
"url": "https://files.pythonhosted.org/packages/be/f0/8b643185470d18a1b36d98c5a308188292cf697c26759b05328b320603ca/pandas_plots-0.20.3-py3-none-any.whl",
"yanked": false,
"yanked_reason": null
},
{
"comment_text": null,
"digests": {
"blake2b_256": "c5b3895f59226569055a7bd780b0a33b9d19e712411eae9e3b29a3a17f0ba8fb",
"md5": "44349fa47a75595d40c9b30261cddea8",
"sha256": "30ffdd0f867e3a18ddf1c16f9648db38d3ea5028019551d11d1e6383bed8fcbc"
},
"downloads": -1,
"filename": "pandas_plots-0.20.3.tar.gz",
"has_sig": false,
"md5_digest": "44349fa47a75595d40c9b30261cddea8",
"packagetype": "sdist",
"python_version": "source",
"requires_python": ">=3.11",
"size": 91532,
"upload_time": "2025-10-24T14:53:05",
"upload_time_iso_8601": "2025-10-24T14:53:05.256504Z",
"url": "https://files.pythonhosted.org/packages/c5/b3/895f59226569055a7bd780b0a33b9d19e712411eae9e3b29a3a17f0ba8fb/pandas_plots-0.20.3.tar.gz",
"yanked": false,
"yanked_reason": null
}
],
"upload_time": "2025-10-24 14:53:05",
"github": true,
"gitlab": false,
"bitbucket": false,
"codeberg": false,
"github_user": "smeisegeier",
"github_project": "pandas-plots",
"travis_ci": false,
"coveralls": false,
"github_actions": true,
"lcname": "pandas-plots"
}

