| Name | parallelplot JSON |
| Version |
0.6.5
 JSON
JSON |
| download |
| home_page | None |
| Summary | Plotting smooth parallel plots |
| upload_time | 2025-03-21 17:25:35 |
| maintainer | None |
| docs_url | None |
| author | None |
| requires_python | >=3.9 |
| license | MIT License Copyright (c) 2024 Tommy Markstein Permission is hereby granted, free of charge, to any person obtaining a copy of this software and associated documentation files (the "Software"), to deal in the Software without restriction, including without limitation the rights to use, copy, modify, merge, publish, distribute, sublicense, and/or sell copies of the Software, and to permit persons to whom the Software is furnished to do so, subject to the following conditions: The above copyright notice and this permission notice shall be included in all copies or substantial portions of the Software. THE SOFTWARE IS PROVIDED "AS IS", WITHOUT WARRANTY OF ANY KIND, EXPRESS OR IMPLIED, INCLUDING BUT NOT LIMITED TO THE WARRANTIES OF MERCHANTABILITY, FITNESS FOR A PARTICULAR PURPOSE AND NONINFRINGEMENT. IN NO EVENT SHALL THE AUTHORS OR COPYRIGHT HOLDERS BE LIABLE FOR ANY CLAIM, DAMAGES OR OTHER LIABILITY, WHETHER IN AN ACTION OF CONTRACT, TORT OR OTHERWISE, ARISING FROM, OUT OF OR IN CONNECTION WITH THE SOFTWARE OR THE USE OR OTHER DEALINGS IN THE SOFTWARE. |
| keywords |
parallel
plot
parallel-plot
smooth
parallelplot
matplotlib
plots
|
| VCS |
 |
| bugtrack_url |
|
| requirements |
No requirements were recorded.
|
| Travis-CI |
No Travis.
|
| coveralls test coverage |
No coveralls.
|
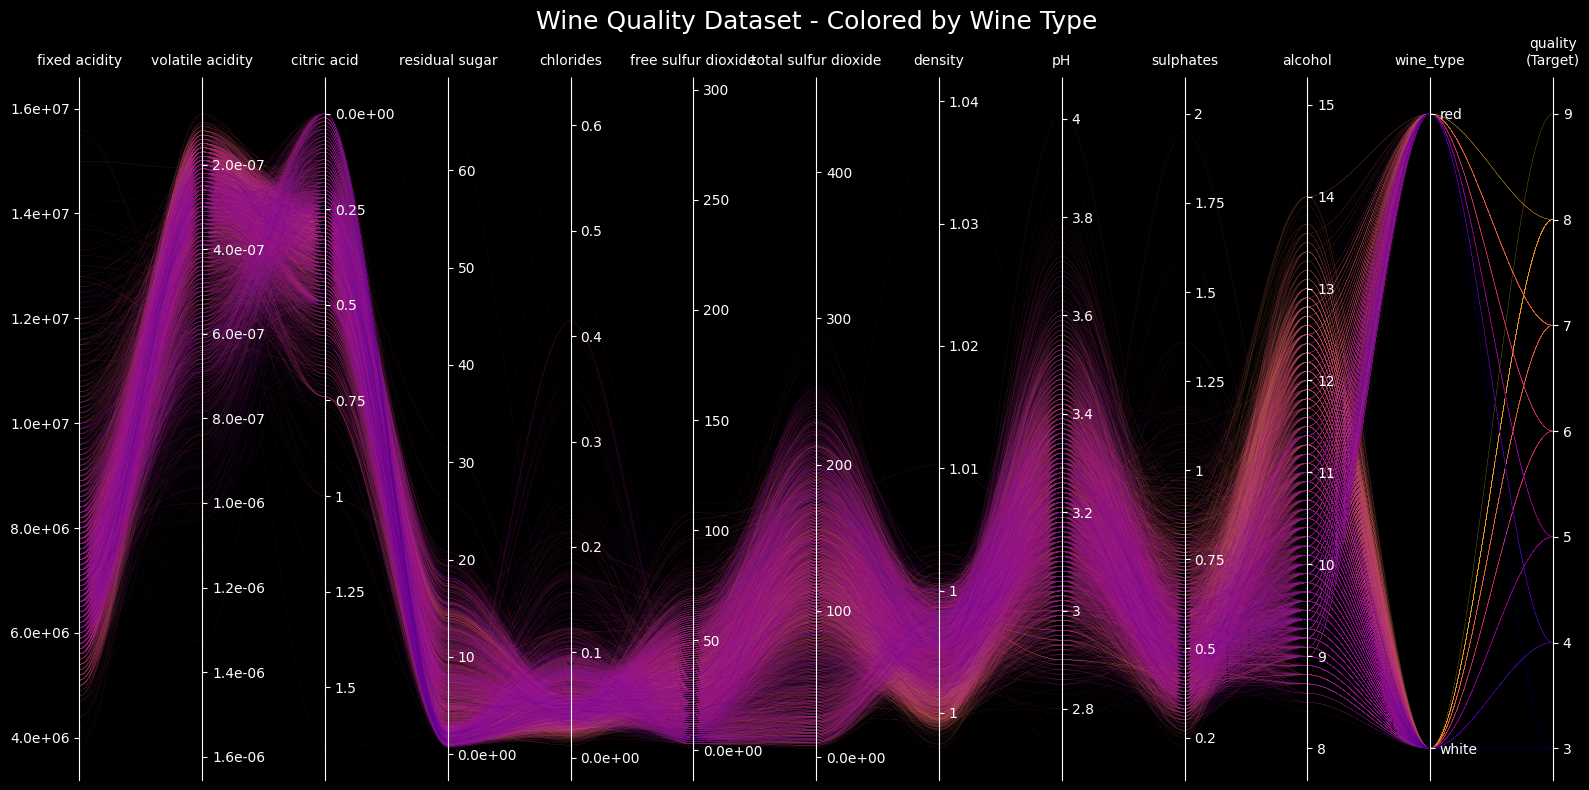
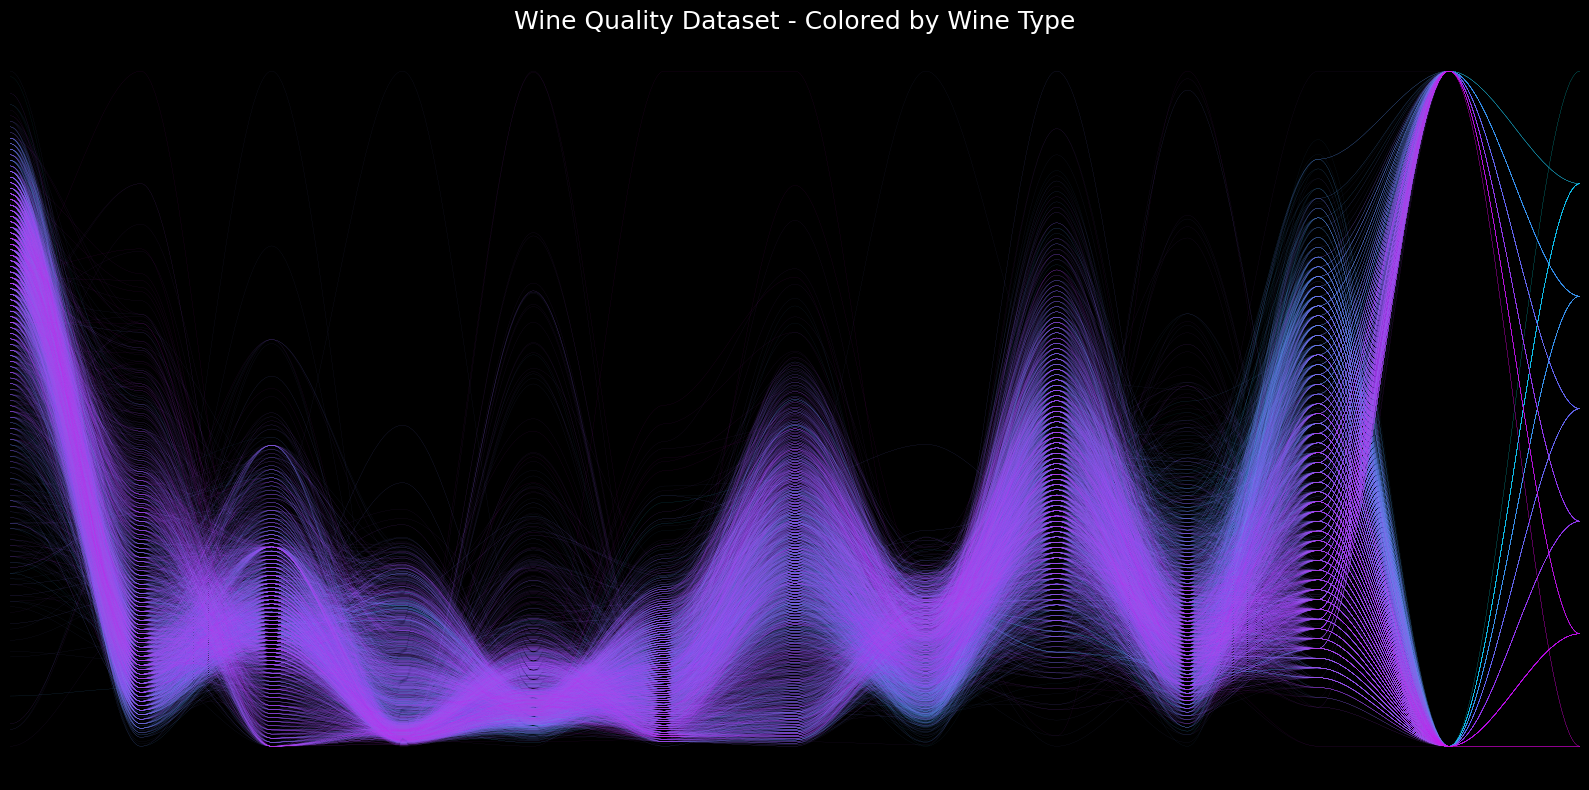
# Generating nice smooth parallel plots!
<p align="center">
<img src="https://raw.githubusercontent.com/markste-in/parallelplot/refs/heads/main/README_files/output_9_0.png" width="300">
<img src="https://raw.githubusercontent.com/markste-in/parallelplot/refs/heads/main/README_files/output_13_0.png" width="300" /></p>
## How to install
Just run
```shell
pip install parallelplot
```
## Little Demo on the Wine Quality Dataset
### First lets import some packages we need to get some sample data
```python
# Import libraries to handle data
import numpy as np
import pandas as pd
# The only thing that is really needs to be imported
# is the plot function from the parallelplot module
# and the pyplot module from matplotlib to display the plot
import parallelplot.plot as pp
import matplotlib.pyplot as plt
# There is also a module that contains a nice colormap. In addition you can use the matplotlib colormap module
from parallelplot.cmaps import purple_blue
import matplotlib.cm as cm
```
```python
# Function to download and load the wine quality dataset
def load_wine_quality_dataset():
# URLs for the Wine Quality datasets
red_wine_url = "https://archive.ics.uci.edu/ml/machine-learning-databases/wine-quality/winequality-red.csv"
white_wine_url = "https://archive.ics.uci.edu/ml/machine-learning-databases/wine-quality/winequality-white.csv"
# Download and read the datasets
red_wine = pd.read_csv(red_wine_url, sep=';')
white_wine = pd.read_csv(white_wine_url, sep=';')
# Add a wine type column
red_wine['wine_type'] = 'red'
white_wine['wine_type'] = 'white'
# Combine the datasets
wine_df = pd.concat([red_wine, white_wine], axis=0, ignore_index=True)
return wine_df
wine_df = load_wine_quality_dataset()
```
```python
print("Wine Quality Dataset:")
wine_df
```
Wine Quality Dataset:
<div>
<style scoped>
.dataframe tbody tr th:only-of-type {
vertical-align: middle;
}
.dataframe tbody tr th {
vertical-align: top;
}
.dataframe thead th {
text-align: right;
}
</style>
<table border="1" class="dataframe">
<thead>
<tr style="text-align: right;">
<th></th>
<th>fixed acidity</th>
<th>volatile acidity</th>
<th>citric acid</th>
<th>residual sugar</th>
<th>chlorides</th>
<th>free sulfur dioxide</th>
<th>total sulfur dioxide</th>
<th>density</th>
<th>pH</th>
<th>sulphates</th>
<th>alcohol</th>
<th>quality</th>
<th>wine_type</th>
</tr>
</thead>
<tbody>
<tr>
<th>0</th>
<td>7.4</td>
<td>0.70</td>
<td>0.00</td>
<td>1.9</td>
<td>0.076</td>
<td>11.0</td>
<td>34.0</td>
<td>0.99780</td>
<td>3.51</td>
<td>0.56</td>
<td>9.4</td>
<td>5</td>
<td>red</td>
</tr>
<tr>
<th>1</th>
<td>7.8</td>
<td>0.88</td>
<td>0.00</td>
<td>2.6</td>
<td>0.098</td>
<td>25.0</td>
<td>67.0</td>
<td>0.99680</td>
<td>3.20</td>
<td>0.68</td>
<td>9.8</td>
<td>5</td>
<td>red</td>
</tr>
<tr>
<th>2</th>
<td>7.8</td>
<td>0.76</td>
<td>0.04</td>
<td>2.3</td>
<td>0.092</td>
<td>15.0</td>
<td>54.0</td>
<td>0.99700</td>
<td>3.26</td>
<td>0.65</td>
<td>9.8</td>
<td>5</td>
<td>red</td>
</tr>
<tr>
<th>3</th>
<td>11.2</td>
<td>0.28</td>
<td>0.56</td>
<td>1.9</td>
<td>0.075</td>
<td>17.0</td>
<td>60.0</td>
<td>0.99800</td>
<td>3.16</td>
<td>0.58</td>
<td>9.8</td>
<td>6</td>
<td>red</td>
</tr>
<tr>
<th>4</th>
<td>7.4</td>
<td>0.70</td>
<td>0.00</td>
<td>1.9</td>
<td>0.076</td>
<td>11.0</td>
<td>34.0</td>
<td>0.99780</td>
<td>3.51</td>
<td>0.56</td>
<td>9.4</td>
<td>5</td>
<td>red</td>
</tr>
<tr>
<th>...</th>
<td>...</td>
<td>...</td>
<td>...</td>
<td>...</td>
<td>...</td>
<td>...</td>
<td>...</td>
<td>...</td>
<td>...</td>
<td>...</td>
<td>...</td>
<td>...</td>
<td>...</td>
</tr>
<tr>
<th>6492</th>
<td>6.2</td>
<td>0.21</td>
<td>0.29</td>
<td>1.6</td>
<td>0.039</td>
<td>24.0</td>
<td>92.0</td>
<td>0.99114</td>
<td>3.27</td>
<td>0.50</td>
<td>11.2</td>
<td>6</td>
<td>white</td>
</tr>
<tr>
<th>6493</th>
<td>6.6</td>
<td>0.32</td>
<td>0.36</td>
<td>8.0</td>
<td>0.047</td>
<td>57.0</td>
<td>168.0</td>
<td>0.99490</td>
<td>3.15</td>
<td>0.46</td>
<td>9.6</td>
<td>5</td>
<td>white</td>
</tr>
<tr>
<th>6494</th>
<td>6.5</td>
<td>0.24</td>
<td>0.19</td>
<td>1.2</td>
<td>0.041</td>
<td>30.0</td>
<td>111.0</td>
<td>0.99254</td>
<td>2.99</td>
<td>0.46</td>
<td>9.4</td>
<td>6</td>
<td>white</td>
</tr>
<tr>
<th>6495</th>
<td>5.5</td>
<td>0.29</td>
<td>0.30</td>
<td>1.1</td>
<td>0.022</td>
<td>20.0</td>
<td>110.0</td>
<td>0.98869</td>
<td>3.34</td>
<td>0.38</td>
<td>12.8</td>
<td>7</td>
<td>white</td>
</tr>
<tr>
<th>6496</th>
<td>6.0</td>
<td>0.21</td>
<td>0.38</td>
<td>0.8</td>
<td>0.020</td>
<td>22.0</td>
<td>98.0</td>
<td>0.98941</td>
<td>3.26</td>
<td>0.32</td>
<td>11.8</td>
<td>6</td>
<td>white</td>
</tr>
</tbody>
</table>
<p>6497 rows × 13 columns</p>
</div>
```python
# Manipulate the dataset to simulate small and large numbers
wine_df["fixed acidity"] = wine_df["fixed acidity"] * 1e6
wine_df["volatile acidity"] = wine_df["volatile acidity"] / 1e6
```
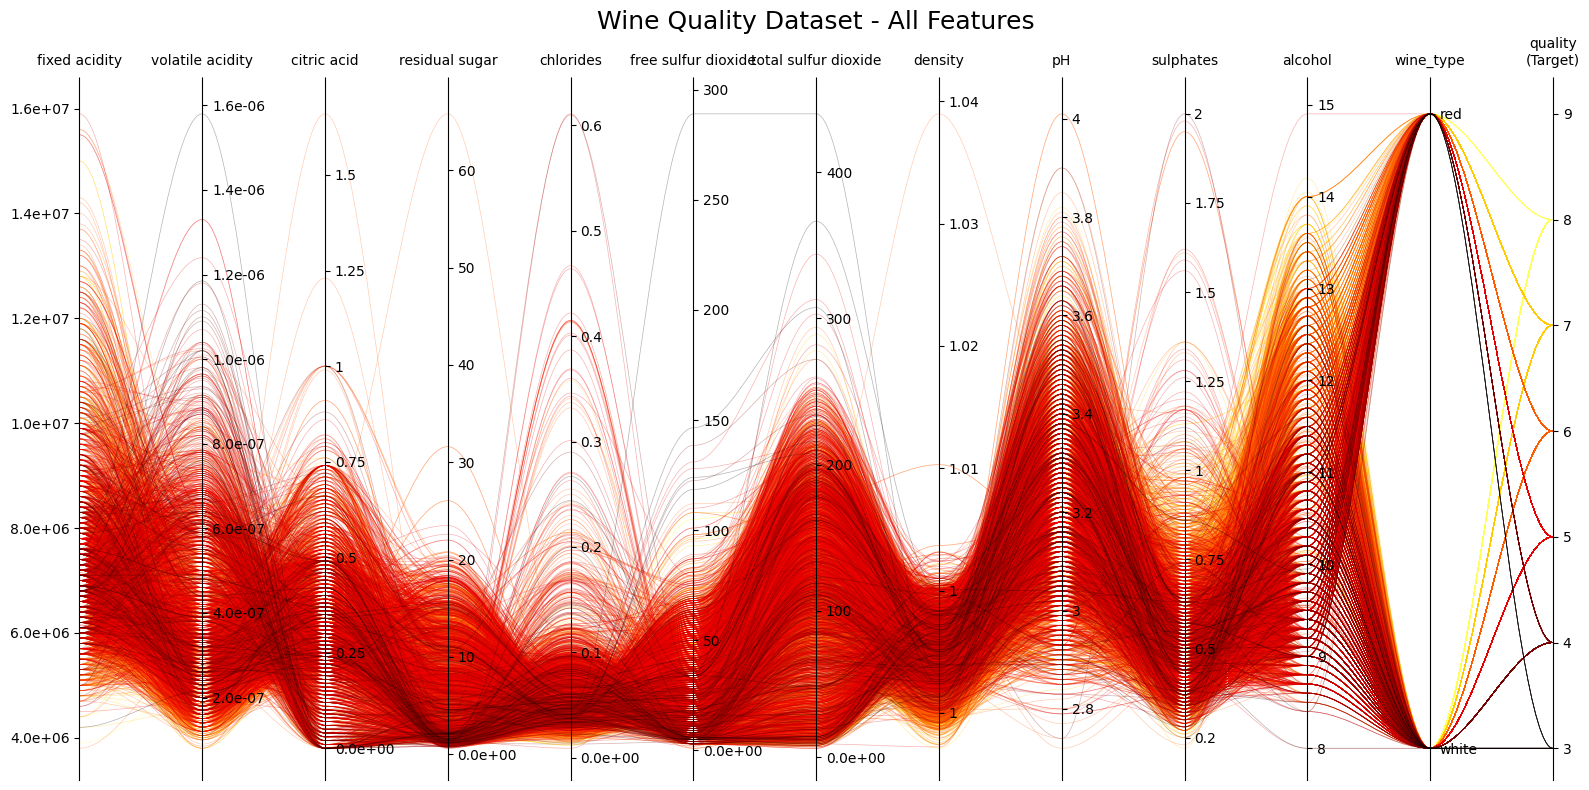
## Create the plots from the imported data!
```python
# Example 1: Basic parallel plot with default style
fig1, axes1 = pp.plot(
df=wine_df,
target_column='quality',
title="Wine Quality Dataset - All Features",
figsize=(16, 8),
tick_label_size=10,
alpha=0.3,
cmap=cm.hot,
order='max',
lw=0.5,
)
plt.show()
```
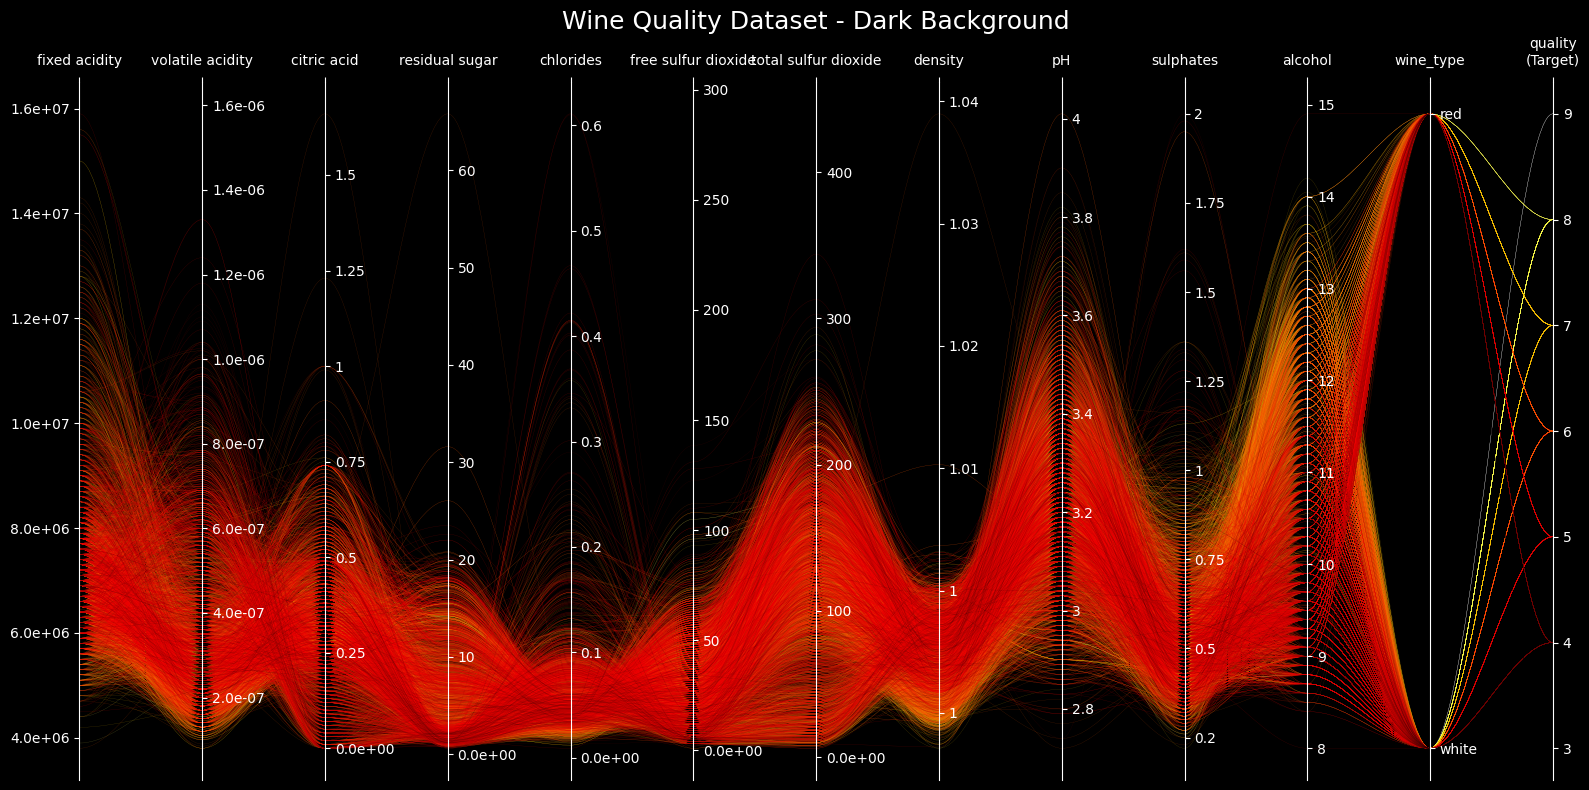
```python
# Example 2: Parallel plot with dark background
fig2, axes2 = pp.plot(
df=wine_df,
target_column='quality',
title="Wine Quality Dataset - Dark Background",
figsize=(16, 8),
style="dark_background",
lw=0.2,
# axes_to_reverse = [0, 1, 2, 5]
)
plt.show()
```
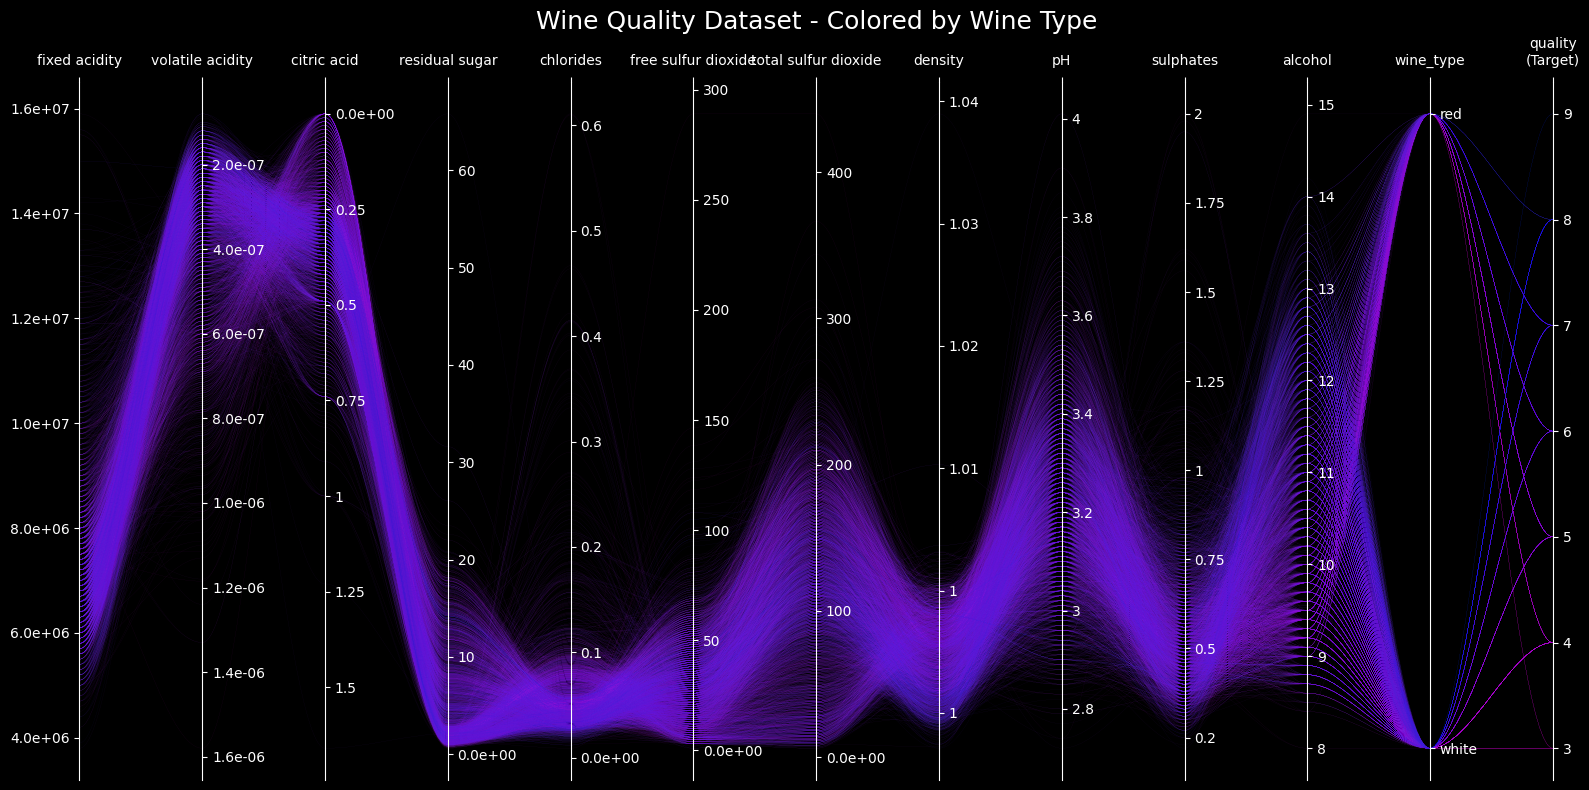
```python
# Example 3: Different cmap
fig3, axes3 = pp.plot(
df=wine_df,
target_column='quality',
title="Wine Quality Dataset - Colored by Wine Type",
figsize=(16, 8),
cmap=purple_blue,
style="dark_background",
lw=0.1,
order='min',
alpha = 0.2,
axes_to_reverse = [1,2]
)
plt.show()
```
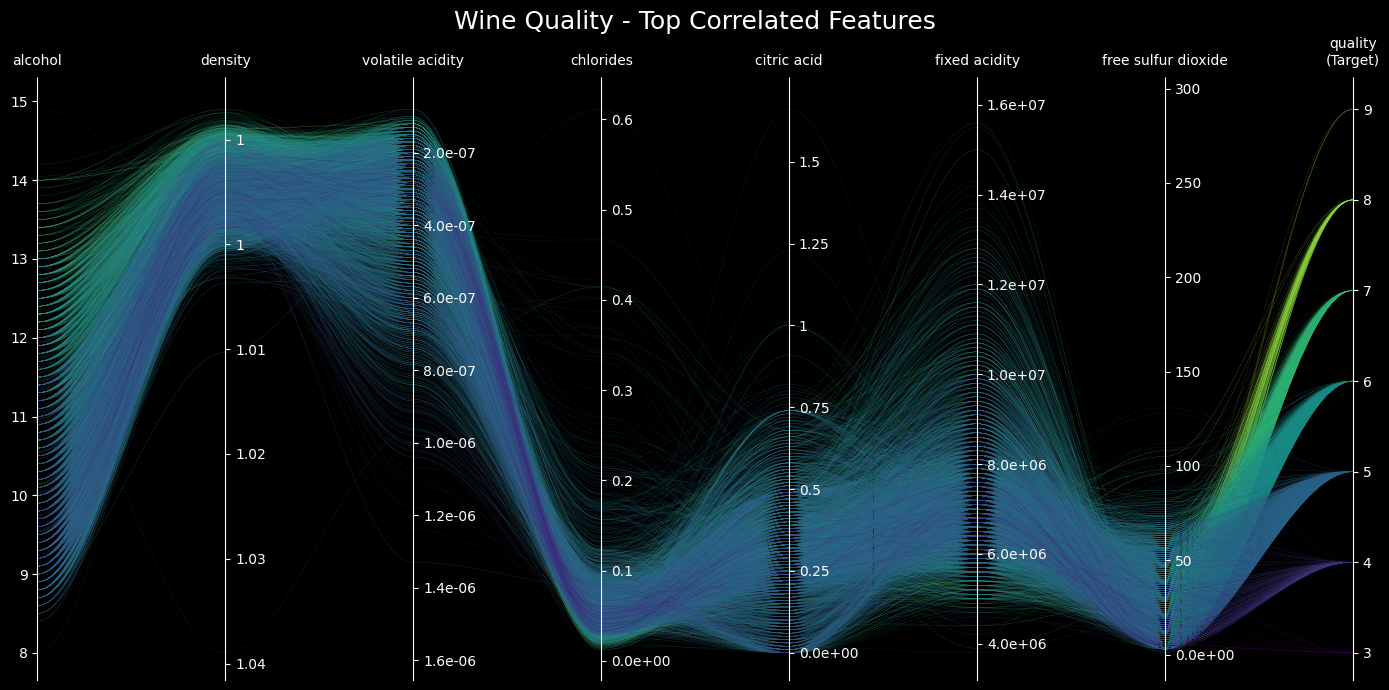
```python
# Example 4: Select top features with highest correlation to quality
# Calculate correlations with quality
corr_with_quality = wine_df.drop(columns=['wine_type']).corr()['quality'].abs().sort_values(ascending=False)
top_features = corr_with_quality.index[:8] # Top 8 features
# Create subset with only the top features
wine_top_features = wine_df[top_features]
fig4, axes4 = pp.plot(
df=wine_top_features,
target_column='quality',
title="Wine Quality - Top Correlated Features",
figsize=(14, 7),
cmap=cm.viridis,
style="dark_background",
lw=0.2,
axes_to_reverse = [1,2]
)
plt.show()
```
```python
# Example 3: Different cmap
fig3, axes3 = pp.plot(
df=wine_df,
target_column='quality',
title="Wine Quality Dataset - Colored by Wine Type",
figsize=(16, 8),
cmap=cm.plasma,
style="dark_background",
lw=0.1,
axes_to_reverse = [1,2]
)
plt.show()
```
```python
# Example 3: Different cmap and hide all axes
fig3, axes3 = pp.plot(
df=wine_df,
target_column='quality',
title="Wine Quality Dataset - Colored by Wine Type",
figsize=(16, 8),
cmap=cm.cool.reversed(),
style="dark_background",
lw=0.1,
# order='random',
hide_axes=True,
axes_to_reverse = [0]
)
plt.show()
```
Raw data
{
"_id": null,
"home_page": null,
"name": "parallelplot",
"maintainer": null,
"docs_url": null,
"requires_python": ">=3.9",
"maintainer_email": null,
"keywords": "parallel, plot, parallel-plot, smooth, parallelplot, matplotlib, plots",
"author": null,
"author_email": "Tommy Markstein <parallelplot@markste.in>",
"download_url": "https://files.pythonhosted.org/packages/b4/4b/392cdf2a263130c40fe4c4a2d792ed2f844e1efe44b77d21f5559c1dd1e9/parallelplot-0.6.5.tar.gz",
"platform": null,
"description": "# Generating nice smooth parallel plots!\n\n<p align=\"center\">\n<img src=\"https://raw.githubusercontent.com/markste-in/parallelplot/refs/heads/main/README_files/output_9_0.png\" width=\"300\">\n <img src=\"https://raw.githubusercontent.com/markste-in/parallelplot/refs/heads/main/README_files/output_13_0.png\" width=\"300\" /></p>\n\n## How to install\n\nJust run\n\n```shell\npip install parallelplot\n```\n\n## Little Demo on the Wine Quality Dataset\n\n### First lets import some packages we need to get some sample data\n\n\n```python\n# Import libraries to handle data \nimport numpy as np\nimport pandas as pd\n\n# The only thing that is really needs to be imported \n# is the plot function from the parallelplot module \n# and the pyplot module from matplotlib to display the plot\nimport parallelplot.plot as pp\nimport matplotlib.pyplot as plt\n\n\n# There is also a module that contains a nice colormap. In addition you can use the matplotlib colormap module\nfrom parallelplot.cmaps import purple_blue\nimport matplotlib.cm as cm\n\n```\n\n\n```python\n# Function to download and load the wine quality dataset\ndef load_wine_quality_dataset():\n # URLs for the Wine Quality datasets \n red_wine_url = \"https://archive.ics.uci.edu/ml/machine-learning-databases/wine-quality/winequality-red.csv\"\n white_wine_url = \"https://archive.ics.uci.edu/ml/machine-learning-databases/wine-quality/winequality-white.csv\"\n \n # Download and read the datasets\n red_wine = pd.read_csv(red_wine_url, sep=';')\n white_wine = pd.read_csv(white_wine_url, sep=';')\n \n # Add a wine type column\n red_wine['wine_type'] = 'red'\n white_wine['wine_type'] = 'white'\n \n # Combine the datasets\n wine_df = pd.concat([red_wine, white_wine], axis=0, ignore_index=True)\n \n return wine_df\n\n\nwine_df = load_wine_quality_dataset()\n\n```\n\n\n```python\nprint(\"Wine Quality Dataset:\")\nwine_df\n```\n\n Wine Quality Dataset:\n\n\n\n\n\n<div>\n<style scoped>\n .dataframe tbody tr th:only-of-type {\n vertical-align: middle;\n }\n\n .dataframe tbody tr th {\n vertical-align: top;\n }\n\n .dataframe thead th {\n text-align: right;\n }\n</style>\n<table border=\"1\" class=\"dataframe\">\n <thead>\n <tr style=\"text-align: right;\">\n <th></th>\n <th>fixed acidity</th>\n <th>volatile acidity</th>\n <th>citric acid</th>\n <th>residual sugar</th>\n <th>chlorides</th>\n <th>free sulfur dioxide</th>\n <th>total sulfur dioxide</th>\n <th>density</th>\n <th>pH</th>\n <th>sulphates</th>\n <th>alcohol</th>\n <th>quality</th>\n <th>wine_type</th>\n </tr>\n </thead>\n <tbody>\n <tr>\n <th>0</th>\n <td>7.4</td>\n <td>0.70</td>\n <td>0.00</td>\n <td>1.9</td>\n <td>0.076</td>\n <td>11.0</td>\n <td>34.0</td>\n <td>0.99780</td>\n <td>3.51</td>\n <td>0.56</td>\n <td>9.4</td>\n <td>5</td>\n <td>red</td>\n </tr>\n <tr>\n <th>1</th>\n <td>7.8</td>\n <td>0.88</td>\n <td>0.00</td>\n <td>2.6</td>\n <td>0.098</td>\n <td>25.0</td>\n <td>67.0</td>\n <td>0.99680</td>\n <td>3.20</td>\n <td>0.68</td>\n <td>9.8</td>\n <td>5</td>\n <td>red</td>\n </tr>\n <tr>\n <th>2</th>\n <td>7.8</td>\n <td>0.76</td>\n <td>0.04</td>\n <td>2.3</td>\n <td>0.092</td>\n <td>15.0</td>\n <td>54.0</td>\n <td>0.99700</td>\n <td>3.26</td>\n <td>0.65</td>\n <td>9.8</td>\n <td>5</td>\n <td>red</td>\n </tr>\n <tr>\n <th>3</th>\n <td>11.2</td>\n <td>0.28</td>\n <td>0.56</td>\n <td>1.9</td>\n <td>0.075</td>\n <td>17.0</td>\n <td>60.0</td>\n <td>0.99800</td>\n <td>3.16</td>\n <td>0.58</td>\n <td>9.8</td>\n <td>6</td>\n <td>red</td>\n </tr>\n <tr>\n <th>4</th>\n <td>7.4</td>\n <td>0.70</td>\n <td>0.00</td>\n <td>1.9</td>\n <td>0.076</td>\n <td>11.0</td>\n <td>34.0</td>\n <td>0.99780</td>\n <td>3.51</td>\n <td>0.56</td>\n <td>9.4</td>\n <td>5</td>\n <td>red</td>\n </tr>\n <tr>\n <th>...</th>\n <td>...</td>\n <td>...</td>\n <td>...</td>\n <td>...</td>\n <td>...</td>\n <td>...</td>\n <td>...</td>\n <td>...</td>\n <td>...</td>\n <td>...</td>\n <td>...</td>\n <td>...</td>\n <td>...</td>\n </tr>\n <tr>\n <th>6492</th>\n <td>6.2</td>\n <td>0.21</td>\n <td>0.29</td>\n <td>1.6</td>\n <td>0.039</td>\n <td>24.0</td>\n <td>92.0</td>\n <td>0.99114</td>\n <td>3.27</td>\n <td>0.50</td>\n <td>11.2</td>\n <td>6</td>\n <td>white</td>\n </tr>\n <tr>\n <th>6493</th>\n <td>6.6</td>\n <td>0.32</td>\n <td>0.36</td>\n <td>8.0</td>\n <td>0.047</td>\n <td>57.0</td>\n <td>168.0</td>\n <td>0.99490</td>\n <td>3.15</td>\n <td>0.46</td>\n <td>9.6</td>\n <td>5</td>\n <td>white</td>\n </tr>\n <tr>\n <th>6494</th>\n <td>6.5</td>\n <td>0.24</td>\n <td>0.19</td>\n <td>1.2</td>\n <td>0.041</td>\n <td>30.0</td>\n <td>111.0</td>\n <td>0.99254</td>\n <td>2.99</td>\n <td>0.46</td>\n <td>9.4</td>\n <td>6</td>\n <td>white</td>\n </tr>\n <tr>\n <th>6495</th>\n <td>5.5</td>\n <td>0.29</td>\n <td>0.30</td>\n <td>1.1</td>\n <td>0.022</td>\n <td>20.0</td>\n <td>110.0</td>\n <td>0.98869</td>\n <td>3.34</td>\n <td>0.38</td>\n <td>12.8</td>\n <td>7</td>\n <td>white</td>\n </tr>\n <tr>\n <th>6496</th>\n <td>6.0</td>\n <td>0.21</td>\n <td>0.38</td>\n <td>0.8</td>\n <td>0.020</td>\n <td>22.0</td>\n <td>98.0</td>\n <td>0.98941</td>\n <td>3.26</td>\n <td>0.32</td>\n <td>11.8</td>\n <td>6</td>\n <td>white</td>\n </tr>\n </tbody>\n</table>\n<p>6497 rows \u00d7 13 columns</p>\n</div>\n\n\n\n\n```python\n# Manipulate the dataset to simulate small and large numbers\nwine_df[\"fixed acidity\"] = wine_df[\"fixed acidity\"] * 1e6\nwine_df[\"volatile acidity\"] = wine_df[\"volatile acidity\"] / 1e6\n```\n\n## Create the plots from the imported data!\n\n\n```python\n# Example 1: Basic parallel plot with default style\nfig1, axes1 = pp.plot(\n df=wine_df,\n target_column='quality',\n title=\"Wine Quality Dataset - All Features\",\n figsize=(16, 8),\n tick_label_size=10,\n alpha=0.3,\n cmap=cm.hot,\n order='max',\n lw=0.5,\n \n)\nplt.show()\n\n```\n\n\n \n\n \n\n\n\n```python\n# Example 2: Parallel plot with dark background\nfig2, axes2 = pp.plot(\n df=wine_df,\n target_column='quality',\n title=\"Wine Quality Dataset - Dark Background\",\n figsize=(16, 8),\n style=\"dark_background\",\n lw=0.2,\n # axes_to_reverse = [0, 1, 2, 5]\n)\nplt.show()\n```\n\n\n \n\n \n\n\n\n```python\n# Example 3: Different cmap \nfig3, axes3 = pp.plot(\n df=wine_df,\n target_column='quality',\n title=\"Wine Quality Dataset - Colored by Wine Type\",\n figsize=(16, 8),\n cmap=purple_blue,\n style=\"dark_background\",\n lw=0.1,\n order='min',\n alpha = 0.2,\n axes_to_reverse = [1,2]\n)\nplt.show()\n\n```\n\n\n \n\n \n\n\n\n```python\n# Example 4: Select top features with highest correlation to quality\n# Calculate correlations with quality\ncorr_with_quality = wine_df.drop(columns=['wine_type']).corr()['quality'].abs().sort_values(ascending=False)\ntop_features = corr_with_quality.index[:8] # Top 8 features\n\n# Create subset with only the top features\nwine_top_features = wine_df[top_features]\n\nfig4, axes4 = pp.plot(\n df=wine_top_features,\n target_column='quality',\n title=\"Wine Quality - Top Correlated Features\",\n figsize=(14, 7),\n cmap=cm.viridis,\n style=\"dark_background\",\n lw=0.2,\n axes_to_reverse = [1,2]\n\n\n)\nplt.show()\n\n```\n\n\n \n\n \n\n\n\n```python\n# Example 3: Different cmap \nfig3, axes3 = pp.plot(\n df=wine_df,\n target_column='quality',\n title=\"Wine Quality Dataset - Colored by Wine Type\",\n figsize=(16, 8),\n cmap=cm.plasma,\n style=\"dark_background\",\n lw=0.1,\n axes_to_reverse = [1,2]\n\n)\nplt.show()\n```\n\n\n \n\n \n\n\n\n```python\n# Example 3: Different cmap and hide all axes\nfig3, axes3 = pp.plot(\n df=wine_df,\n target_column='quality',\n title=\"Wine Quality Dataset - Colored by Wine Type\",\n figsize=(16, 8),\n cmap=cm.cool.reversed(),\n style=\"dark_background\",\n lw=0.1,\n # order='random',\n hide_axes=True,\n axes_to_reverse = [0]\n\n\n)\nplt.show()\n```\n\n\n \n\n \n\n",
"bugtrack_url": null,
"license": "MIT License Copyright (c) 2024 Tommy Markstein Permission is hereby granted, free of charge, to any person obtaining a copy of this software and associated documentation files (the \"Software\"), to deal in the Software without restriction, including without limitation the rights to use, copy, modify, merge, publish, distribute, sublicense, and/or sell copies of the Software, and to permit persons to whom the Software is furnished to do so, subject to the following conditions: The above copyright notice and this permission notice shall be included in all copies or substantial portions of the Software. THE SOFTWARE IS PROVIDED \"AS IS\", WITHOUT WARRANTY OF ANY KIND, EXPRESS OR IMPLIED, INCLUDING BUT NOT LIMITED TO THE WARRANTIES OF MERCHANTABILITY, FITNESS FOR A PARTICULAR PURPOSE AND NONINFRINGEMENT. IN NO EVENT SHALL THE AUTHORS OR COPYRIGHT HOLDERS BE LIABLE FOR ANY CLAIM, DAMAGES OR OTHER LIABILITY, WHETHER IN AN ACTION OF CONTRACT, TORT OR OTHERWISE, ARISING FROM, OUT OF OR IN CONNECTION WITH THE SOFTWARE OR THE USE OR OTHER DEALINGS IN THE SOFTWARE. ",
"summary": "Plotting smooth parallel plots",
"version": "0.6.5",
"project_urls": {
"Homepage": "https://github.com/markste-in/parallelplot"
},
"split_keywords": [
"parallel",
" plot",
" parallel-plot",
" smooth",
" parallelplot",
" matplotlib",
" plots"
],
"urls": [
{
"comment_text": "",
"digests": {
"blake2b_256": "8756adcd6b8a227670b91cc093daaa25264f7b61322770df9694a64cb0f3ecd5",
"md5": "d1e39c1dc2b514372bfeb013d8c8bad4",
"sha256": "589a4ac9c402a55f20658604d5f0b1411b2ac80a427f3aee89acbd32bc6627ee"
},
"downloads": -1,
"filename": "parallelplot-0.6.5-py3-none-any.whl",
"has_sig": false,
"md5_digest": "d1e39c1dc2b514372bfeb013d8c8bad4",
"packagetype": "bdist_wheel",
"python_version": "py3",
"requires_python": ">=3.9",
"size": 10544,
"upload_time": "2025-03-21T17:25:34",
"upload_time_iso_8601": "2025-03-21T17:25:34.603758Z",
"url": "https://files.pythonhosted.org/packages/87/56/adcd6b8a227670b91cc093daaa25264f7b61322770df9694a64cb0f3ecd5/parallelplot-0.6.5-py3-none-any.whl",
"yanked": false,
"yanked_reason": null
},
{
"comment_text": "",
"digests": {
"blake2b_256": "b44b392cdf2a263130c40fe4c4a2d792ed2f844e1efe44b77d21f5559c1dd1e9",
"md5": "1e12e991cc6390ed736c403e53d07171",
"sha256": "c50d01f5711a7a53e8777da4565ed7a9595a3d5122f4dc74da76883d9ec595a2"
},
"downloads": -1,
"filename": "parallelplot-0.6.5.tar.gz",
"has_sig": false,
"md5_digest": "1e12e991cc6390ed736c403e53d07171",
"packagetype": "sdist",
"python_version": "source",
"requires_python": ">=3.9",
"size": 12828,
"upload_time": "2025-03-21T17:25:35",
"upload_time_iso_8601": "2025-03-21T17:25:35.869096Z",
"url": "https://files.pythonhosted.org/packages/b4/4b/392cdf2a263130c40fe4c4a2d792ed2f844e1efe44b77d21f5559c1dd1e9/parallelplot-0.6.5.tar.gz",
"yanked": false,
"yanked_reason": null
}
],
"upload_time": "2025-03-21 17:25:35",
"github": true,
"gitlab": false,
"bitbucket": false,
"codeberg": false,
"github_user": "markste-in",
"github_project": "parallelplot",
"travis_ci": false,
"coveralls": false,
"github_actions": false,
"lcname": "parallelplot"
}
