<p align="center">
<img src="https://github.com/mljar/plotai/blob/main/media/PlotAI_logo.png?raw=true" height="270" alt="PlotAI logo"/>
</p>
<p align="center">
<em>🎨🤖 Create Python plots in matplotlib with LLM 🎨🤖</em>
</p>
<p align="center">
<img alt="" src="https://badge.fury.io/py/plotai.svg"/>
<img alt="" src="https://img.shields.io/pypi/pyversions/plotai.svg"/>
<img alt="" src="https://img.shields.io/badge/License-Apache_2.0-blue.svg"/>
</p>
<p align="center">
<a href="https://github.com/mljar/plotai#get-started">🚀 Get Started</a>
<span> • </span>
<a href="https://github.com/mljar/plotai/issues">🤝 Issues</a>
<span> • </span>
<a href="https://twitter.com/MLJAROfficial">🐦 Twitter</a>
<span> • </span>
<a href="https://www.linkedin.com/in/aleksandra-p%C5%82o%C5%84ska-42047432/">👩💼 LinkedIn</a>
</p>
# PlotAI 🎨🤖
The easiest way to create plots in Python and Matplotlib. The `plotai` is using LLM to generate code and plots.
The idea:
1. User provides input DataFrame and prompt.
2. The `PlotAI` constructs a prompt for LLM, which contains the first 5 rows of DataFrame and the user's prompt and asks for Python code as output.
3. Returned Python code is executed, and the plot is displayed.
https://github.com/mljar/plotai/assets/6959032/cb80bc35-e534-466d-aa1d-ce240d35f624
The simplest possible API for plotting:
```python
# import packages
import pandas as pd
from plotai import PlotAI
# create some data
df = pd.DataFrame({"x":[1,2,3], "y": [4,5,6]})
# do a plot
plot = PlotAI(df)
plot.make("scatter plot")
```
The `PlotAI` class has only one method, `make()`.
It works in Python scripts and in notebooks (Jupyter, Colab, VS Code).
<p align="center">
<img src="https://github.com/mljar/plotai/blob/main/media/plotai.jpg?raw=true" height="350" alt="PlotAI logo"/>
</p>
## 🚀 Get started
Install `plotai` package:
```bash
pip install plotai
```
Create `.env` file with the OpenAI API key:
```
OPENAI_API_KEY=your-key-here
```
You can also pass the OpenAI API key in Python:
```python
import os
os.environ["OPENAI_API_KEY"] = "your-key-here"
```
Import `plotai` and make plots:
```python
# import PlotAI
from plotai import PlotAI
# create PlotAI object, pass pandas DataFrame as an argument
plot = PlotAI(df)
# make a plot, just tell what you want
plot.make("make a scatter plot")
```
By default the library will use '*gpt-3.5-turbo*'. You can use different OpenAI models:
```python
# import PlotAI
from plotai import PlotAI
# create PlotAI object, pass pandas DataFrame as an argument
plot = PlotAI(df, model_version="gpt-4")
# make a plot, just tell what you want
plot.make("make a scatter plot")
```
## More examples
#### Analyze the GPD dataset
https://github.com/mljar/plotai/assets/6959032/e62b1a26-7c91-40e4-9d2d-1a600d8dd7ba
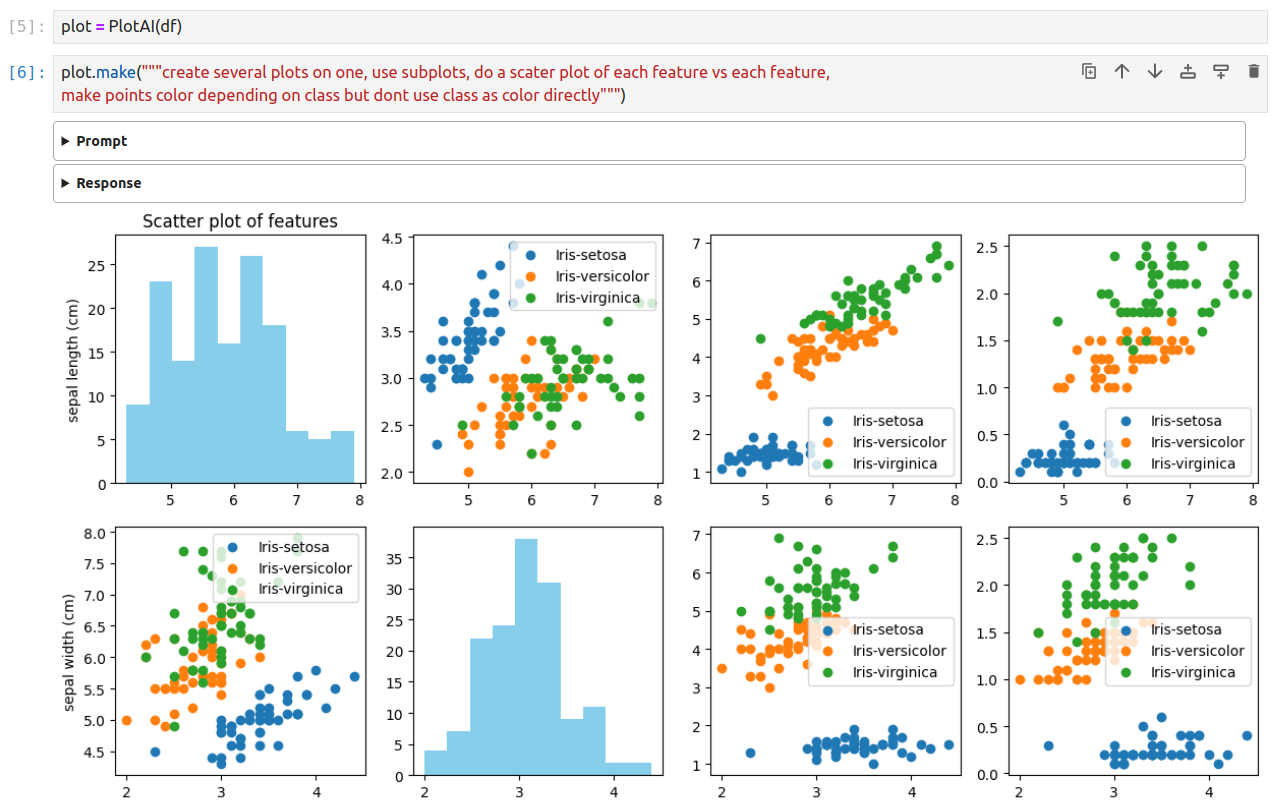
#### Analyze the Iris dataset
## 👩💼🐦 Connect with Us on LinkedIn & Twitter
Stay up-to-date with the latest updates about PlotAI 🎨🤖 by following us on Twitter ([MLJAR Twitter](https://twitter.com/MLJAROfficial)) and LinkedIn ([Aleksandra LinkedIn](https://www.linkedin.com/in/aleksandra-p%C5%82o%C5%84ska-42047432/) & [Piotr LinkedIn](https://www.linkedin.com/in/piotr-plonski-mljar/)). We look forward to connecting with you and hearing your thoughts, ideas, and experiences with PlotAI. Let's explore the future of AI together!
## ⚠️ Limitations
PlotAI is in very experimental form, below are some limitations:
- PlotAI is using OpenAI ChatGPT-3.5-turbo for completions, it will be nice to extend to other LLMs.
- PlotAI is sending 5 first rows from your DataFrame to OpenAI ChatGPT. If you have sensitive data, please remove/encode it before passing to `PlotAI`.
- PlotAI is executing Python code returned by LLM, it can be dangerous and unsafe. It would be nice to have the option to accept the response code before execution.
## 🛡 Disclaimer
This project, PlotAI, is provided "as is" without any warranty, express or implied. By using this software, you agree to assume all risks associated with its use, including but not limited to data loss, system failure, or any other issues that may arise. The developers and contributors of this project do not accept any responsibility or liability for any losses, damages, or other consequences that may occur as a result of using this software.
Please note that the use of the OpenAI language models can be expensive due to its token usage. By utilizing this project, you acknowledge that you are responsible for monitoring and managing your own token usage and the associated costs. It is highly recommended to check your OpenAI API usage regularly and set up any necessary limits or alerts to prevent unexpected charges.
## Convert Python Notebooks to web applications 📓 -> 🌐
We are working on framework [Mercury](https://github.com/mljar/mercury) for sharing Python notebooks as interactive web applications. The framework is open source. We also working on a service for [one-click deployment of Python notebooks](https://runmercury.com/). You can check [Python notebooks integrations on our website](https://runmercury.com/use/).
All the best!
Raw data
{
"_id": null,
"home_page": "https://github.com/mljar/plotai",
"name": "plotai",
"maintainer": null,
"docs_url": null,
"requires_python": ">=3.7.1",
"maintainer_email": null,
"keywords": "plot, visualization, charts, matplotlib, llm, openai, mljar",
"author": "MLJAR Sp. z o.o.",
"author_email": "contact@mljar.com",
"download_url": "https://files.pythonhosted.org/packages/9c/8e/6877ac5a06a1f04484622f093e1f4ea032d6085e17f2cc8888939fc77191/plotai-0.0.6.tar.gz",
"platform": null,
"description": "<p align=\"center\">\n <img src=\"https://github.com/mljar/plotai/blob/main/media/PlotAI_logo.png?raw=true\" height=\"270\" alt=\"PlotAI logo\"/>\n</p>\n\n\n<p align=\"center\">\n <em>\ud83c\udfa8\ud83e\udd16 Create Python plots in matplotlib with LLM \ud83c\udfa8\ud83e\udd16</em>\n</p>\n<p align=\"center\">\n <img alt=\"\" src=\"https://badge.fury.io/py/plotai.svg\"/>\n <img alt=\"\" src=\"https://img.shields.io/pypi/pyversions/plotai.svg\"/>\n <img alt=\"\" src=\"https://img.shields.io/badge/License-Apache_2.0-blue.svg\"/>\n</p>\n\n<p align=\"center\">\n<a href=\"https://github.com/mljar/plotai#get-started\">\ud83d\ude80 Get Started</a>\n<span> \u2022 </span>\n<a href=\"https://github.com/mljar/plotai/issues\">\ud83e\udd1d Issues</a>\n<span> \u2022 </span>\n<a href=\"https://twitter.com/MLJAROfficial\">\ud83d\udc26 Twitter</a>\n<span> \u2022 </span>\n<a href=\"https://www.linkedin.com/in/aleksandra-p%C5%82o%C5%84ska-42047432/\">\ud83d\udc69\u200d\ud83d\udcbc LinkedIn</a>\n</p>\n\n# PlotAI \ud83c\udfa8\ud83e\udd16 \n\nThe easiest way to create plots in Python and Matplotlib. The `plotai` is using LLM to generate code and plots.\n\nThe idea:\n1. User provides input DataFrame and prompt.\n2. The `PlotAI` constructs a prompt for LLM, which contains the first 5 rows of DataFrame and the user's prompt and asks for Python code as output.\n3. Returned Python code is executed, and the plot is displayed.\n\nhttps://github.com/mljar/plotai/assets/6959032/cb80bc35-e534-466d-aa1d-ce240d35f624\n\nThe simplest possible API for plotting:\n```python\n# import packages\nimport pandas as pd\nfrom plotai import PlotAI\n# create some data\ndf = pd.DataFrame({\"x\":[1,2,3], \"y\": [4,5,6]})\n# do a plot\nplot = PlotAI(df)\nplot.make(\"scatter plot\")\n```\n\nThe `PlotAI` class has only one method, `make()`.\n\nIt works in Python scripts and in notebooks (Jupyter, Colab, VS Code).\n\n\n<p align=\"center\">\n <img src=\"https://github.com/mljar/plotai/blob/main/media/plotai.jpg?raw=true\" height=\"350\" alt=\"PlotAI logo\"/>\n</p>\n\n## \ud83d\ude80 Get started\n\nInstall `plotai` package:\n\n```bash\npip install plotai\n```\n\nCreate `.env` file with the OpenAI API key:\n\n```\nOPENAI_API_KEY=your-key-here\n```\n\nYou can also pass the OpenAI API key in Python:\n\n```python\nimport os\nos.environ[\"OPENAI_API_KEY\"] = \"your-key-here\"\n```\n\nImport `plotai` and make plots:\n\n```python\n# import PlotAI\nfrom plotai import PlotAI\n\n# create PlotAI object, pass pandas DataFrame as an argument\nplot = PlotAI(df)\n\n# make a plot, just tell what you want\nplot.make(\"make a scatter plot\")\n```\n\nBy default the library will use '*gpt-3.5-turbo*'. You can use different OpenAI models:\n\n```python\n# import PlotAI\nfrom plotai import PlotAI\n\n# create PlotAI object, pass pandas DataFrame as an argument\nplot = PlotAI(df, model_version=\"gpt-4\")\n\n# make a plot, just tell what you want\nplot.make(\"make a scatter plot\")\n```\n\n## More examples\n\n#### Analyze the GPD dataset\n\nhttps://github.com/mljar/plotai/assets/6959032/e62b1a26-7c91-40e4-9d2d-1a600d8dd7ba\n\n#### Analyze the Iris dataset \n\n\n\n\n## \ud83d\udc69\u200d\ud83d\udcbc\ud83d\udc26 Connect with Us on LinkedIn & Twitter\n\nStay up-to-date with the latest updates about PlotAI \ud83c\udfa8\ud83e\udd16 by following us on Twitter ([MLJAR Twitter](https://twitter.com/MLJAROfficial)) and LinkedIn ([Aleksandra LinkedIn](https://www.linkedin.com/in/aleksandra-p%C5%82o%C5%84ska-42047432/) & [Piotr LinkedIn](https://www.linkedin.com/in/piotr-plonski-mljar/)). We look forward to connecting with you and hearing your thoughts, ideas, and experiences with PlotAI. Let's explore the future of AI together!\n\n## \u26a0\ufe0f Limitations\n\nPlotAI is in very experimental form, below are some limitations:\n- PlotAI is using OpenAI ChatGPT-3.5-turbo for completions, it will be nice to extend to other LLMs.\n- PlotAI is sending 5 first rows from your DataFrame to OpenAI ChatGPT. If you have sensitive data, please remove/encode it before passing to `PlotAI`.\n- PlotAI is executing Python code returned by LLM, it can be dangerous and unsafe. It would be nice to have the option to accept the response code before execution.\n\n\n## \ud83d\udee1 Disclaimer\n\nThis project, PlotAI, is provided \"as is\" without any warranty, express or implied. By using this software, you agree to assume all risks associated with its use, including but not limited to data loss, system failure, or any other issues that may arise. The developers and contributors of this project do not accept any responsibility or liability for any losses, damages, or other consequences that may occur as a result of using this software. \n\nPlease note that the use of the OpenAI language models can be expensive due to its token usage. By utilizing this project, you acknowledge that you are responsible for monitoring and managing your own token usage and the associated costs. It is highly recommended to check your OpenAI API usage regularly and set up any necessary limits or alerts to prevent unexpected charges.\n\n## Convert Python Notebooks to web applications \ud83d\udcd3 -> \ud83c\udf10\n\nWe are working on framework [Mercury](https://github.com/mljar/mercury) for sharing Python notebooks as interactive web applications. The framework is open source. We also working on a service for [one-click deployment of Python notebooks](https://runmercury.com/). You can check [Python notebooks integrations on our website](https://runmercury.com/use/). \n\nAll the best!",
"bugtrack_url": null,
"license": "Apache 2.0",
"summary": "Create plots in Python with AI",
"version": "0.0.6",
"project_urls": {
"Homepage": "https://github.com/mljar/plotai"
},
"split_keywords": [
"plot",
" visualization",
" charts",
" matplotlib",
" llm",
" openai",
" mljar"
],
"urls": [
{
"comment_text": "",
"digests": {
"blake2b_256": "9c8e6877ac5a06a1f04484622f093e1f4ea032d6085e17f2cc8888939fc77191",
"md5": "0c98273f86e92ab148c917783e26ba77",
"sha256": "108bc6e9ef3d373fe0782383f356edf51ef82cf60c8df9cafd8d47795de3e14a"
},
"downloads": -1,
"filename": "plotai-0.0.6.tar.gz",
"has_sig": false,
"md5_digest": "0c98273f86e92ab148c917783e26ba77",
"packagetype": "sdist",
"python_version": "source",
"requires_python": ">=3.7.1",
"size": 12962,
"upload_time": "2024-10-09T08:39:45",
"upload_time_iso_8601": "2024-10-09T08:39:45.977443Z",
"url": "https://files.pythonhosted.org/packages/9c/8e/6877ac5a06a1f04484622f093e1f4ea032d6085e17f2cc8888939fc77191/plotai-0.0.6.tar.gz",
"yanked": false,
"yanked_reason": null
}
],
"upload_time": "2024-10-09 08:39:45",
"github": true,
"gitlab": false,
"bitbucket": false,
"codeberg": false,
"github_user": "mljar",
"github_project": "plotai",
"travis_ci": false,
"coveralls": false,
"github_actions": false,
"requirements": [],
"lcname": "plotai"
}

