# plotnineSeqSuite: a Python package for visualizing sequence data using ggplot2 style
## Cite this work
Cao, T., Li, Q., Huang, Y. et al. plotnineSeqSuite: a Python package for visualizing sequence data using ggplot2 style. BMC Genomics 24, 585 (2023). https://doi.org/10.1186/s12864-023-09677-8
## Installation
`pip install plotnineseqsuite`
## Getting Started
See [plotnineSeqSuite Documentation](https://caotianze.github.io/plotnineseqsuite/)
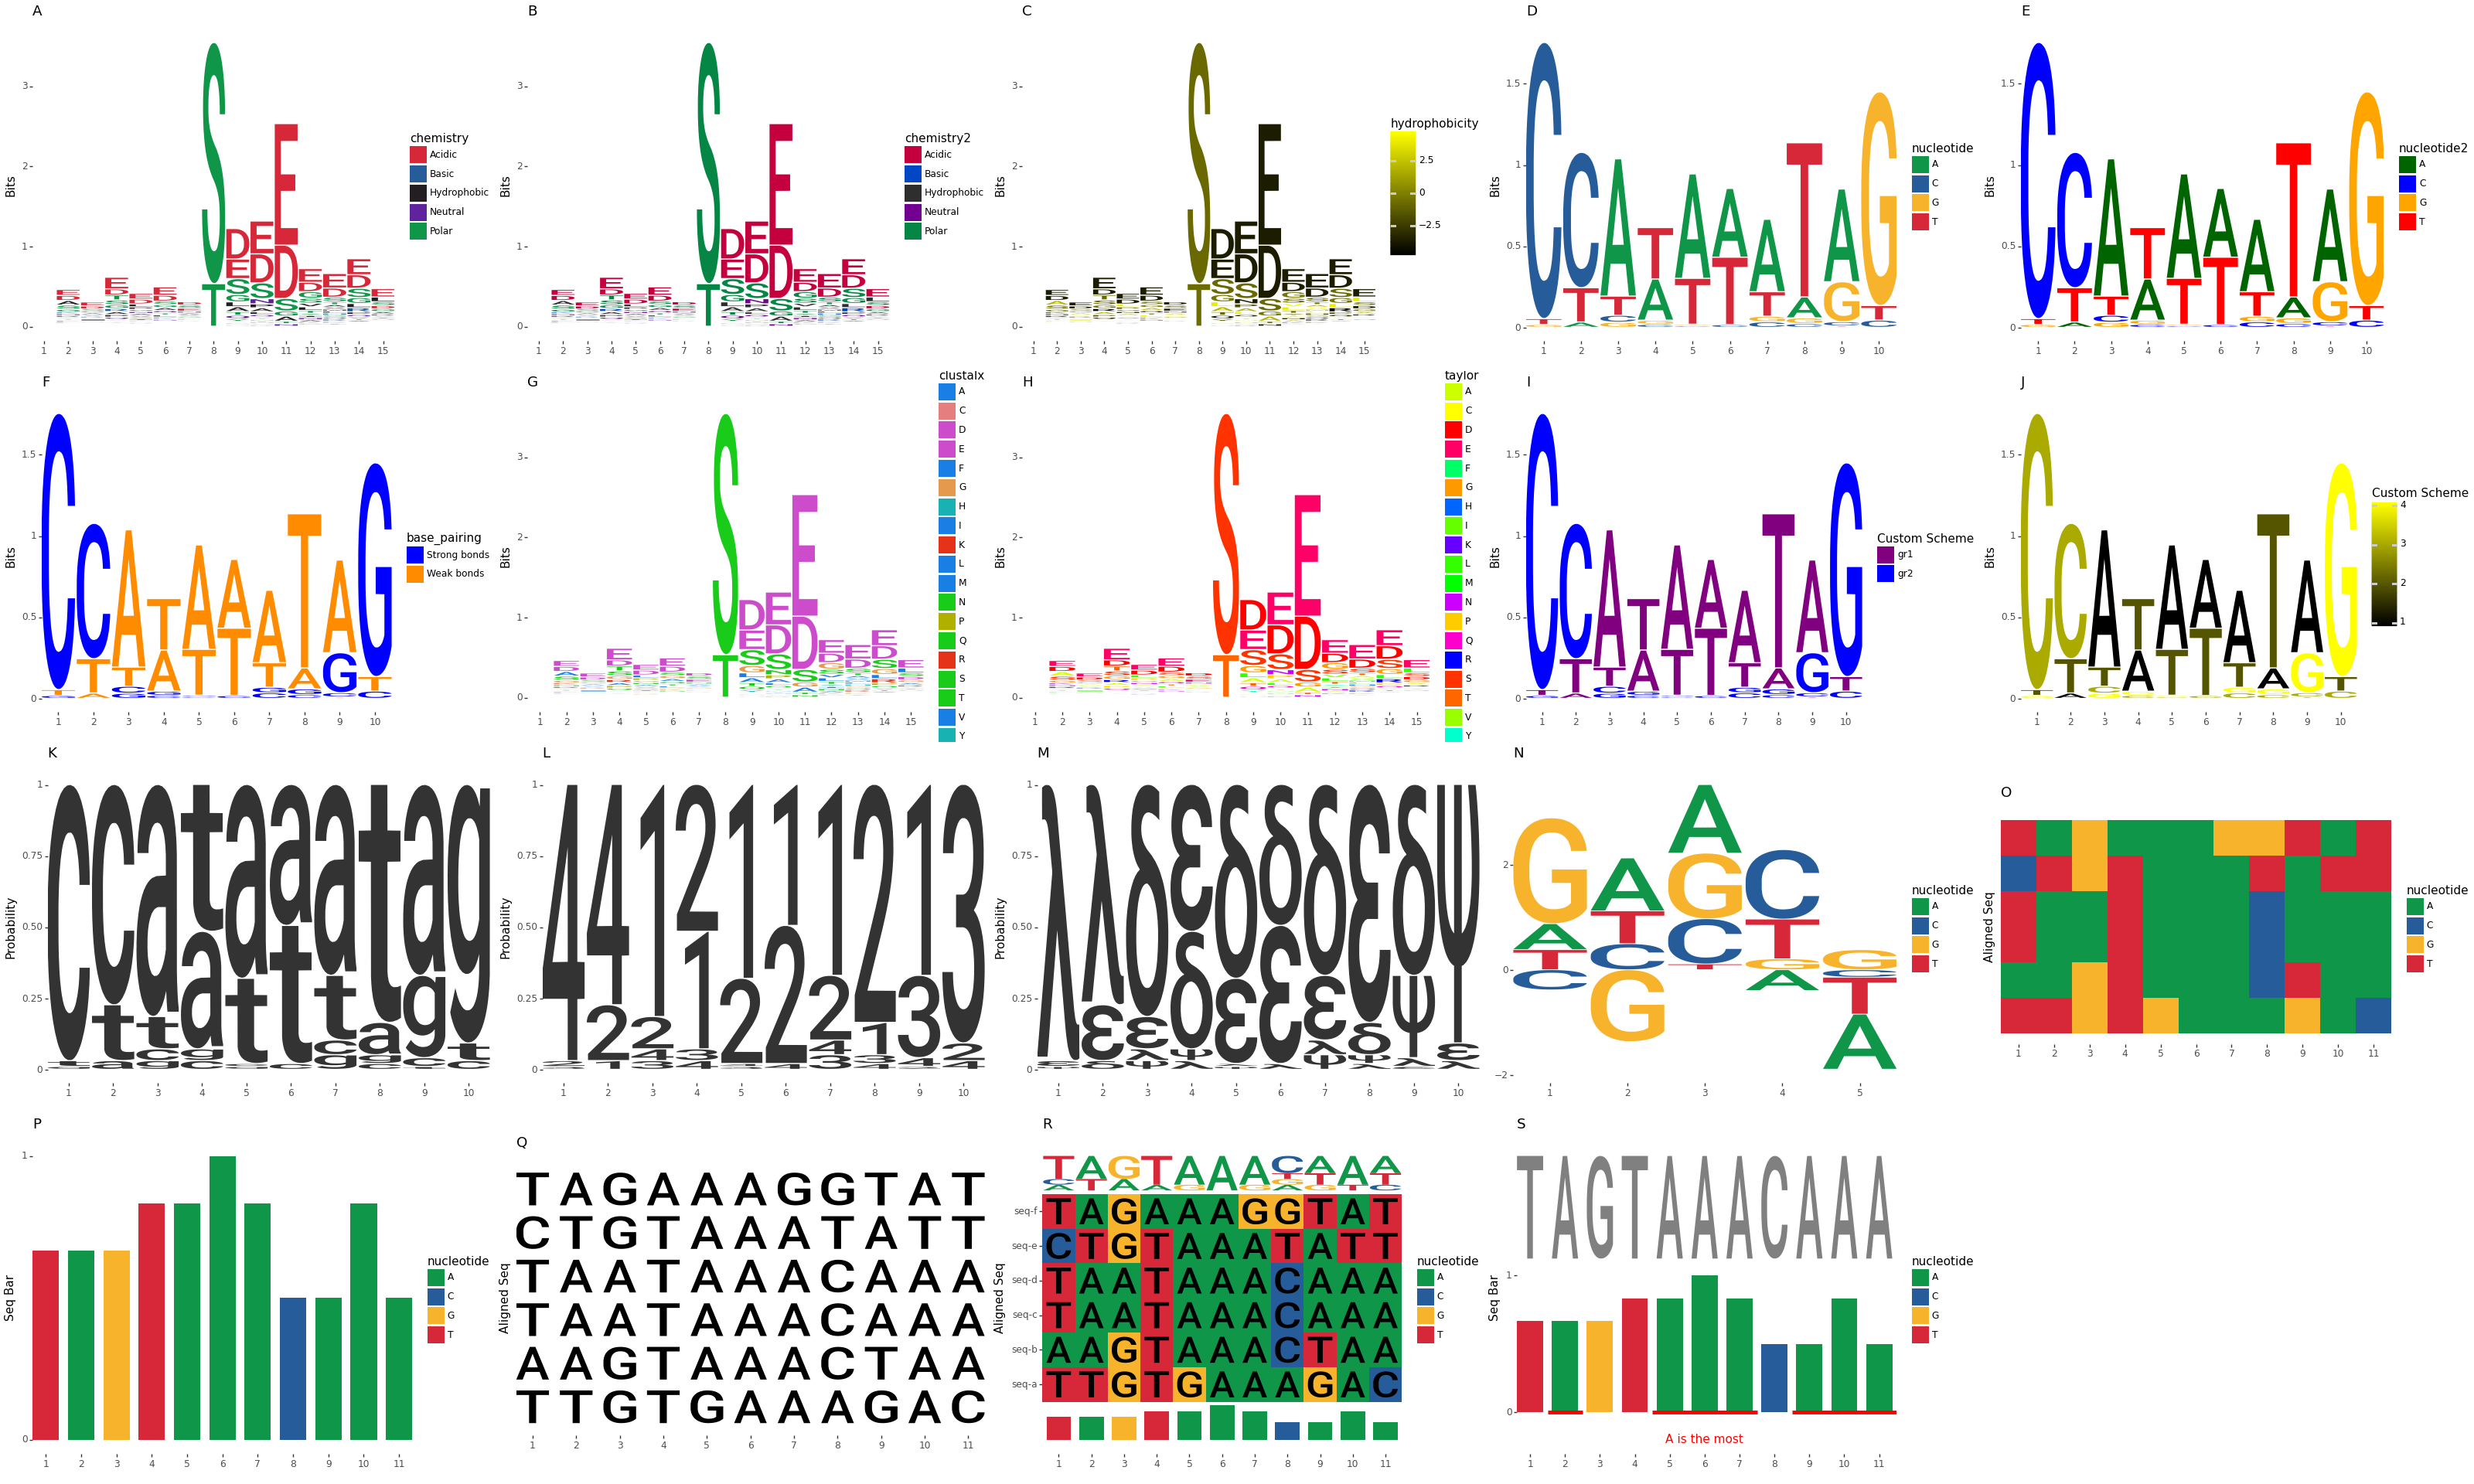
## Gallery
## Development environment
PyCharm 2023.2 (Community Edition) and Spyder version: 5.4.3 (conda)
## Dependencies
Python version: 3.11.4 64-bit
plotnine: 0.13.6
## Similar projects
R package [ggmsa](https://github.com/YuLab-SMU/ggmsa) and [ggseqlogo](https://github.com/omarwagih/ggseqlogo)
## Derivative projects
- [Pyggseqlogo](https://github.com/CaoTianze/pyggseqlogo): Python version of ggseqlogo.
Raw data
{
"_id": null,
"home_page": "https://github.com/caotianze/plotnineseqsuite",
"name": "plotnineseqsuite",
"maintainer": null,
"docs_url": null,
"requires_python": ">=3.11",
"maintainer_email": null,
"keywords": "ggplot2, plotnine, Bioinformatics tool, Sequence logo, Sequence alignment",
"author": "Cao Tianze",
"author_email": "hnrcao@qq.com",
"download_url": "https://files.pythonhosted.org/packages/e7/f0/66934e2119ef7e3017f4447a812008028615776f87c34d540183e6aaa17b/plotnineseqsuite-1.1.3.tar.gz",
"platform": null,
"description": "# plotnineSeqSuite: a Python package for visualizing sequence data using ggplot2 style\r\n## Cite this work\r\nCao, T., Li, Q., Huang, Y. et al. plotnineSeqSuite: a Python package for visualizing sequence data using ggplot2 style. BMC Genomics 24, 585 (2023). https://doi.org/10.1186/s12864-023-09677-8\r\n## Installation\r\n`pip install plotnineseqsuite`\r\n## Getting Started\r\nSee [plotnineSeqSuite Documentation](https://caotianze.github.io/plotnineseqsuite/) \r\n## Gallery\r\n\r\n## Development environment \r\nPyCharm 2023.2 (Community Edition) and Spyder version: 5.4.3 (conda)\r\n## Dependencies\r\nPython version: 3.11.4 64-bit \r\nplotnine: 0.13.6\r\n## Similar projects\r\nR package [ggmsa](https://github.com/YuLab-SMU/ggmsa) and [ggseqlogo](https://github.com/omarwagih/ggseqlogo)\r\n## Derivative projects\r\n- [Pyggseqlogo](https://github.com/CaoTianze/pyggseqlogo): Python version of ggseqlogo. \r\n",
"bugtrack_url": null,
"license": "MIT",
"summary": "A Python package for visualizing sequence data using ggplot2 style",
"version": "1.1.3",
"project_urls": {
"Bug Tracker": "https://github.com/caotianze/plotnineseqsuite/issues",
"Homepage": "https://github.com/caotianze/plotnineseqsuite"
},
"split_keywords": [
"ggplot2",
" plotnine",
" bioinformatics tool",
" sequence logo",
" sequence alignment"
],
"urls": [
{
"comment_text": "",
"digests": {
"blake2b_256": "e7f066934e2119ef7e3017f4447a812008028615776f87c34d540183e6aaa17b",
"md5": "3cdb5519554f1edd9a84560668fe3140",
"sha256": "87c745c6b0e6a3a2f1b8ce519f99a0627c8d27a604740bd811e7dc26a9a1bf08"
},
"downloads": -1,
"filename": "plotnineseqsuite-1.1.3.tar.gz",
"has_sig": false,
"md5_digest": "3cdb5519554f1edd9a84560668fe3140",
"packagetype": "sdist",
"python_version": "source",
"requires_python": ">=3.11",
"size": 1419789,
"upload_time": "2024-12-13T05:55:22",
"upload_time_iso_8601": "2024-12-13T05:55:22.924862Z",
"url": "https://files.pythonhosted.org/packages/e7/f0/66934e2119ef7e3017f4447a812008028615776f87c34d540183e6aaa17b/plotnineseqsuite-1.1.3.tar.gz",
"yanked": false,
"yanked_reason": null
}
],
"upload_time": "2024-12-13 05:55:22",
"github": true,
"gitlab": false,
"bitbucket": false,
"codeberg": false,
"github_user": "caotianze",
"github_project": "plotnineseqsuite",
"travis_ci": false,
"coveralls": false,
"github_actions": false,
"lcname": "plotnineseqsuite"
}

