| Name | polyptich JSON |
| Version |
0.0.17
 JSON
JSON |
| download |
| home_page | None |
| Summary | Extra visualization functions |
| upload_time | 2025-01-09 12:12:01 |
| maintainer | None |
| docs_url | None |
| author | None |
| requires_python | >=3.8 |
| license | MIT |
| keywords |
visualization
|
| VCS |
 |
| bugtrack_url |
|
| requirements |
No requirements were recorded.
|
| Travis-CI |
No Travis.
|
| coveralls test coverage |
No coveralls.
|
## Polyptich: easier layouting in matplotlib
```python
import polyptich as pp
```
```python
fig = pp.Figure()
ax = pp.Panel((2, 2))
ax.plot([1, 2, 3], [1, 2, 3])
fig.main.add_right(ax)
ax = pp.Panel((2, 2))
ax.plot([1, 2, 3], [1, 2, 3])
fig.main.add_right(ax)
ax = pp.Panel((2, 2))
ax.plot([1, 2, 3], [1, 2, 3])
fig.main.add_right(ax)
fig.display()
```

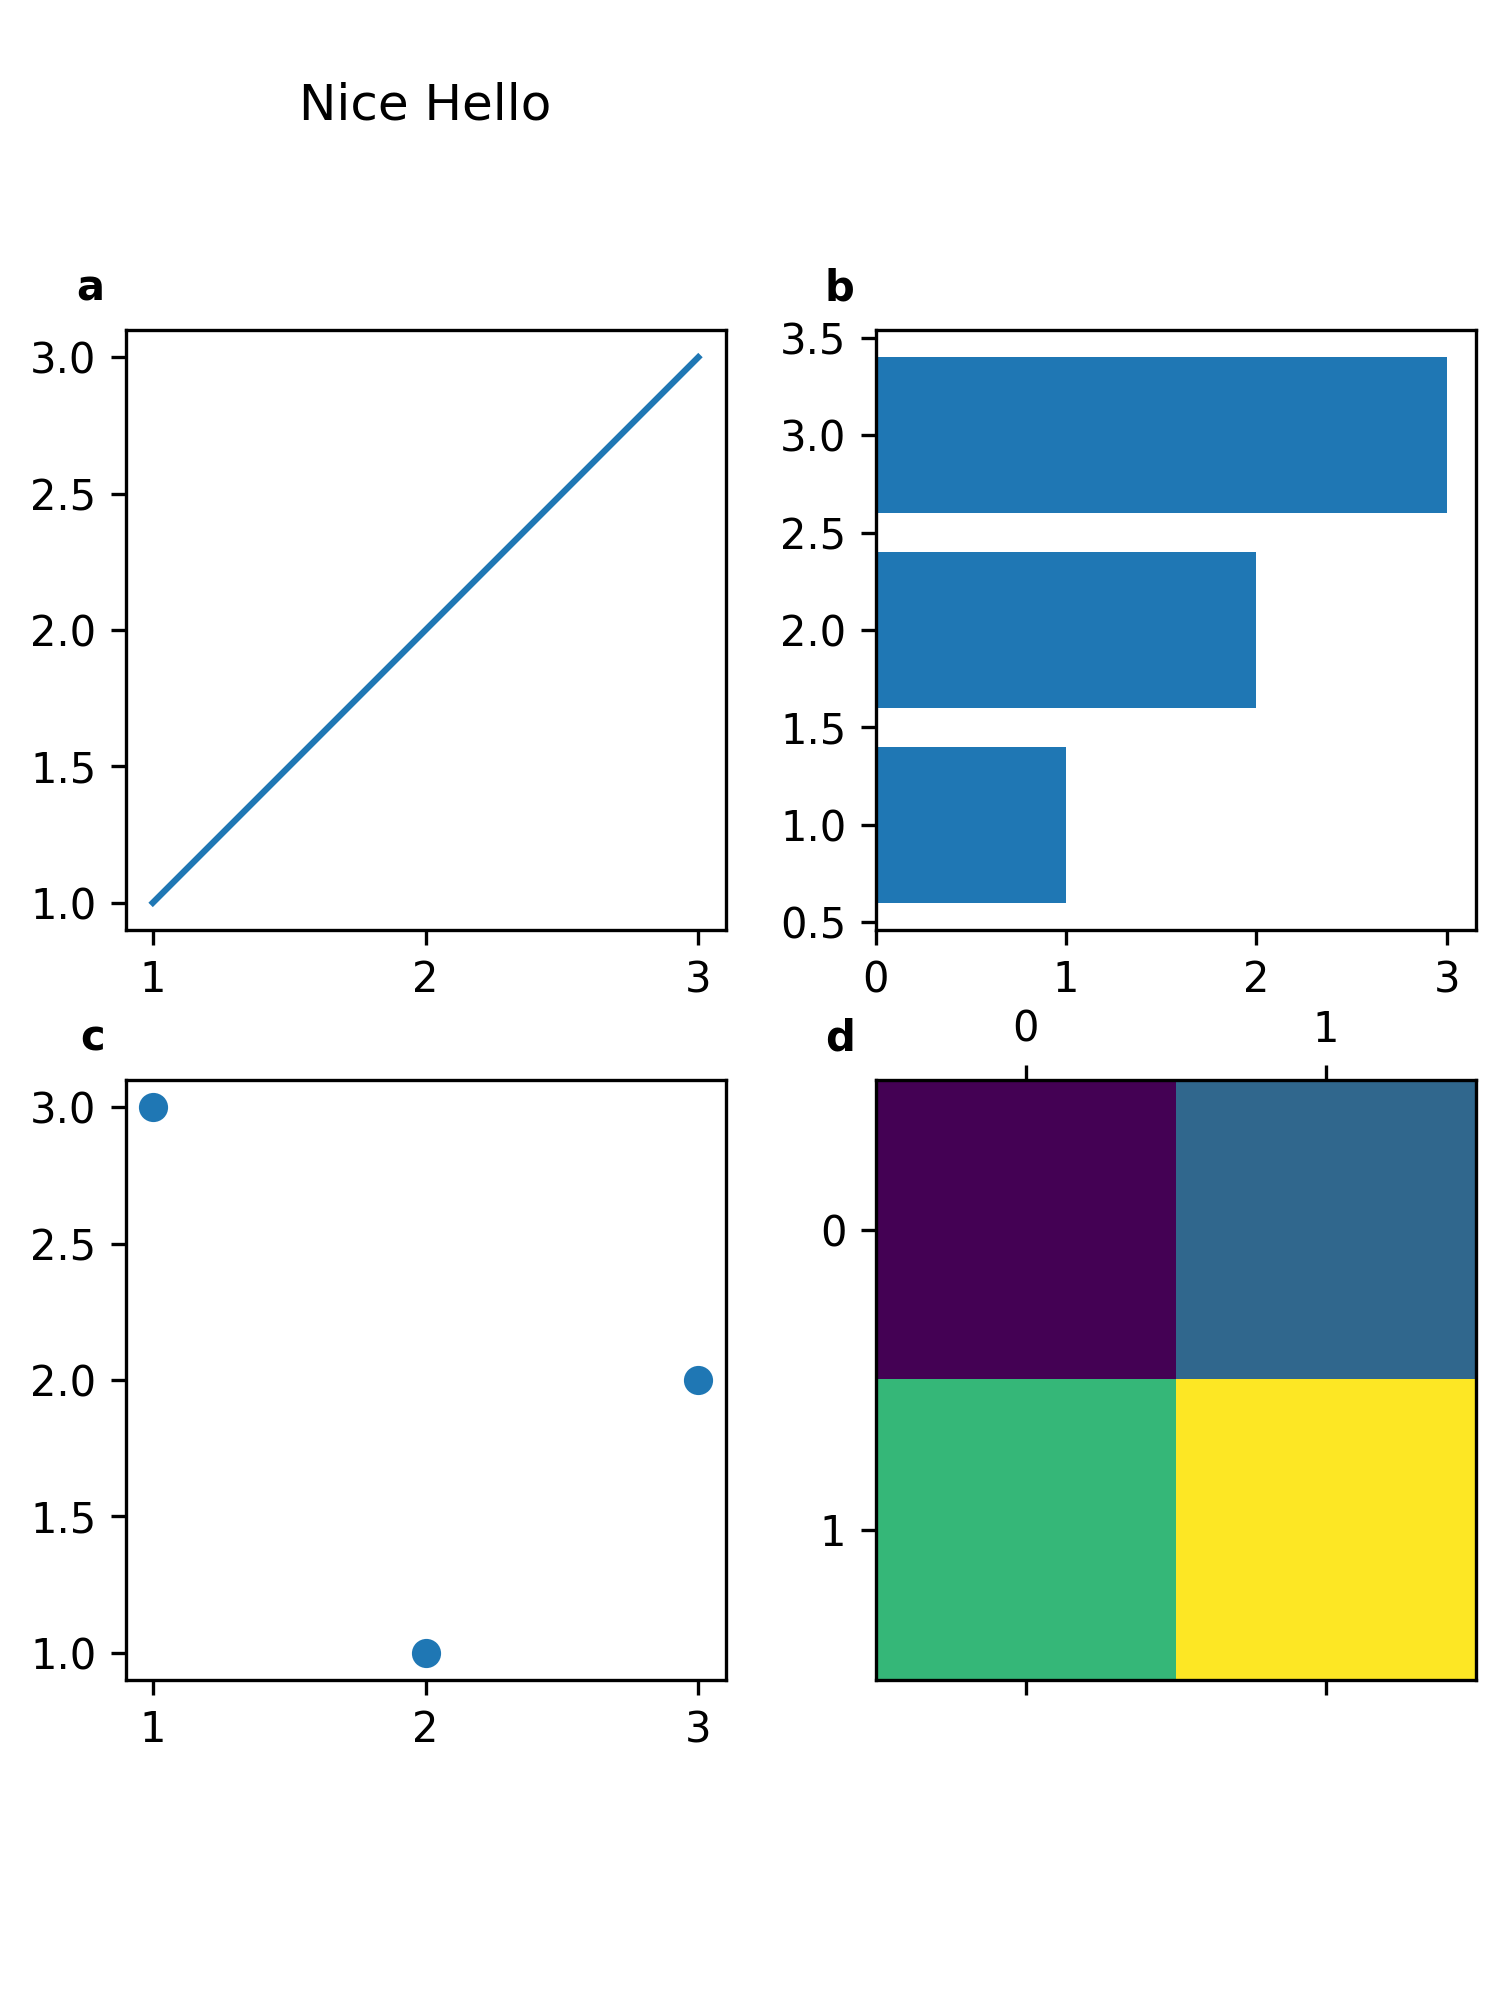
```python
fig = pp.Figure()
ax1 = pp.Panel((2, 2))
ax1.plot([1, 2, 3], [1, 2, 3])
ax1.add_tag("a")
ax2 = pp.Panel((2, 2))
ax2.barh([1, 2, 3], [1, 2, 3])
ax2.add_tag("b")
ax3 = pp.Panel((2, 2))
ax3.scatter([1, 2, 3], [3, 1, 2])
ax3.add_tag("c")
ax4 = pp.Panel((2, 2))
ax4.matshow([[1, 2], [3, 4]])
ax4.add_tag("d")
title = pp.Title("Nice Hello")
legend = pp.Panel((None, 0.5))
legend.axis("off")
fig.main = title / (ax1 | ax2) / (ax3 | ax4) / legend
fig.display()
```

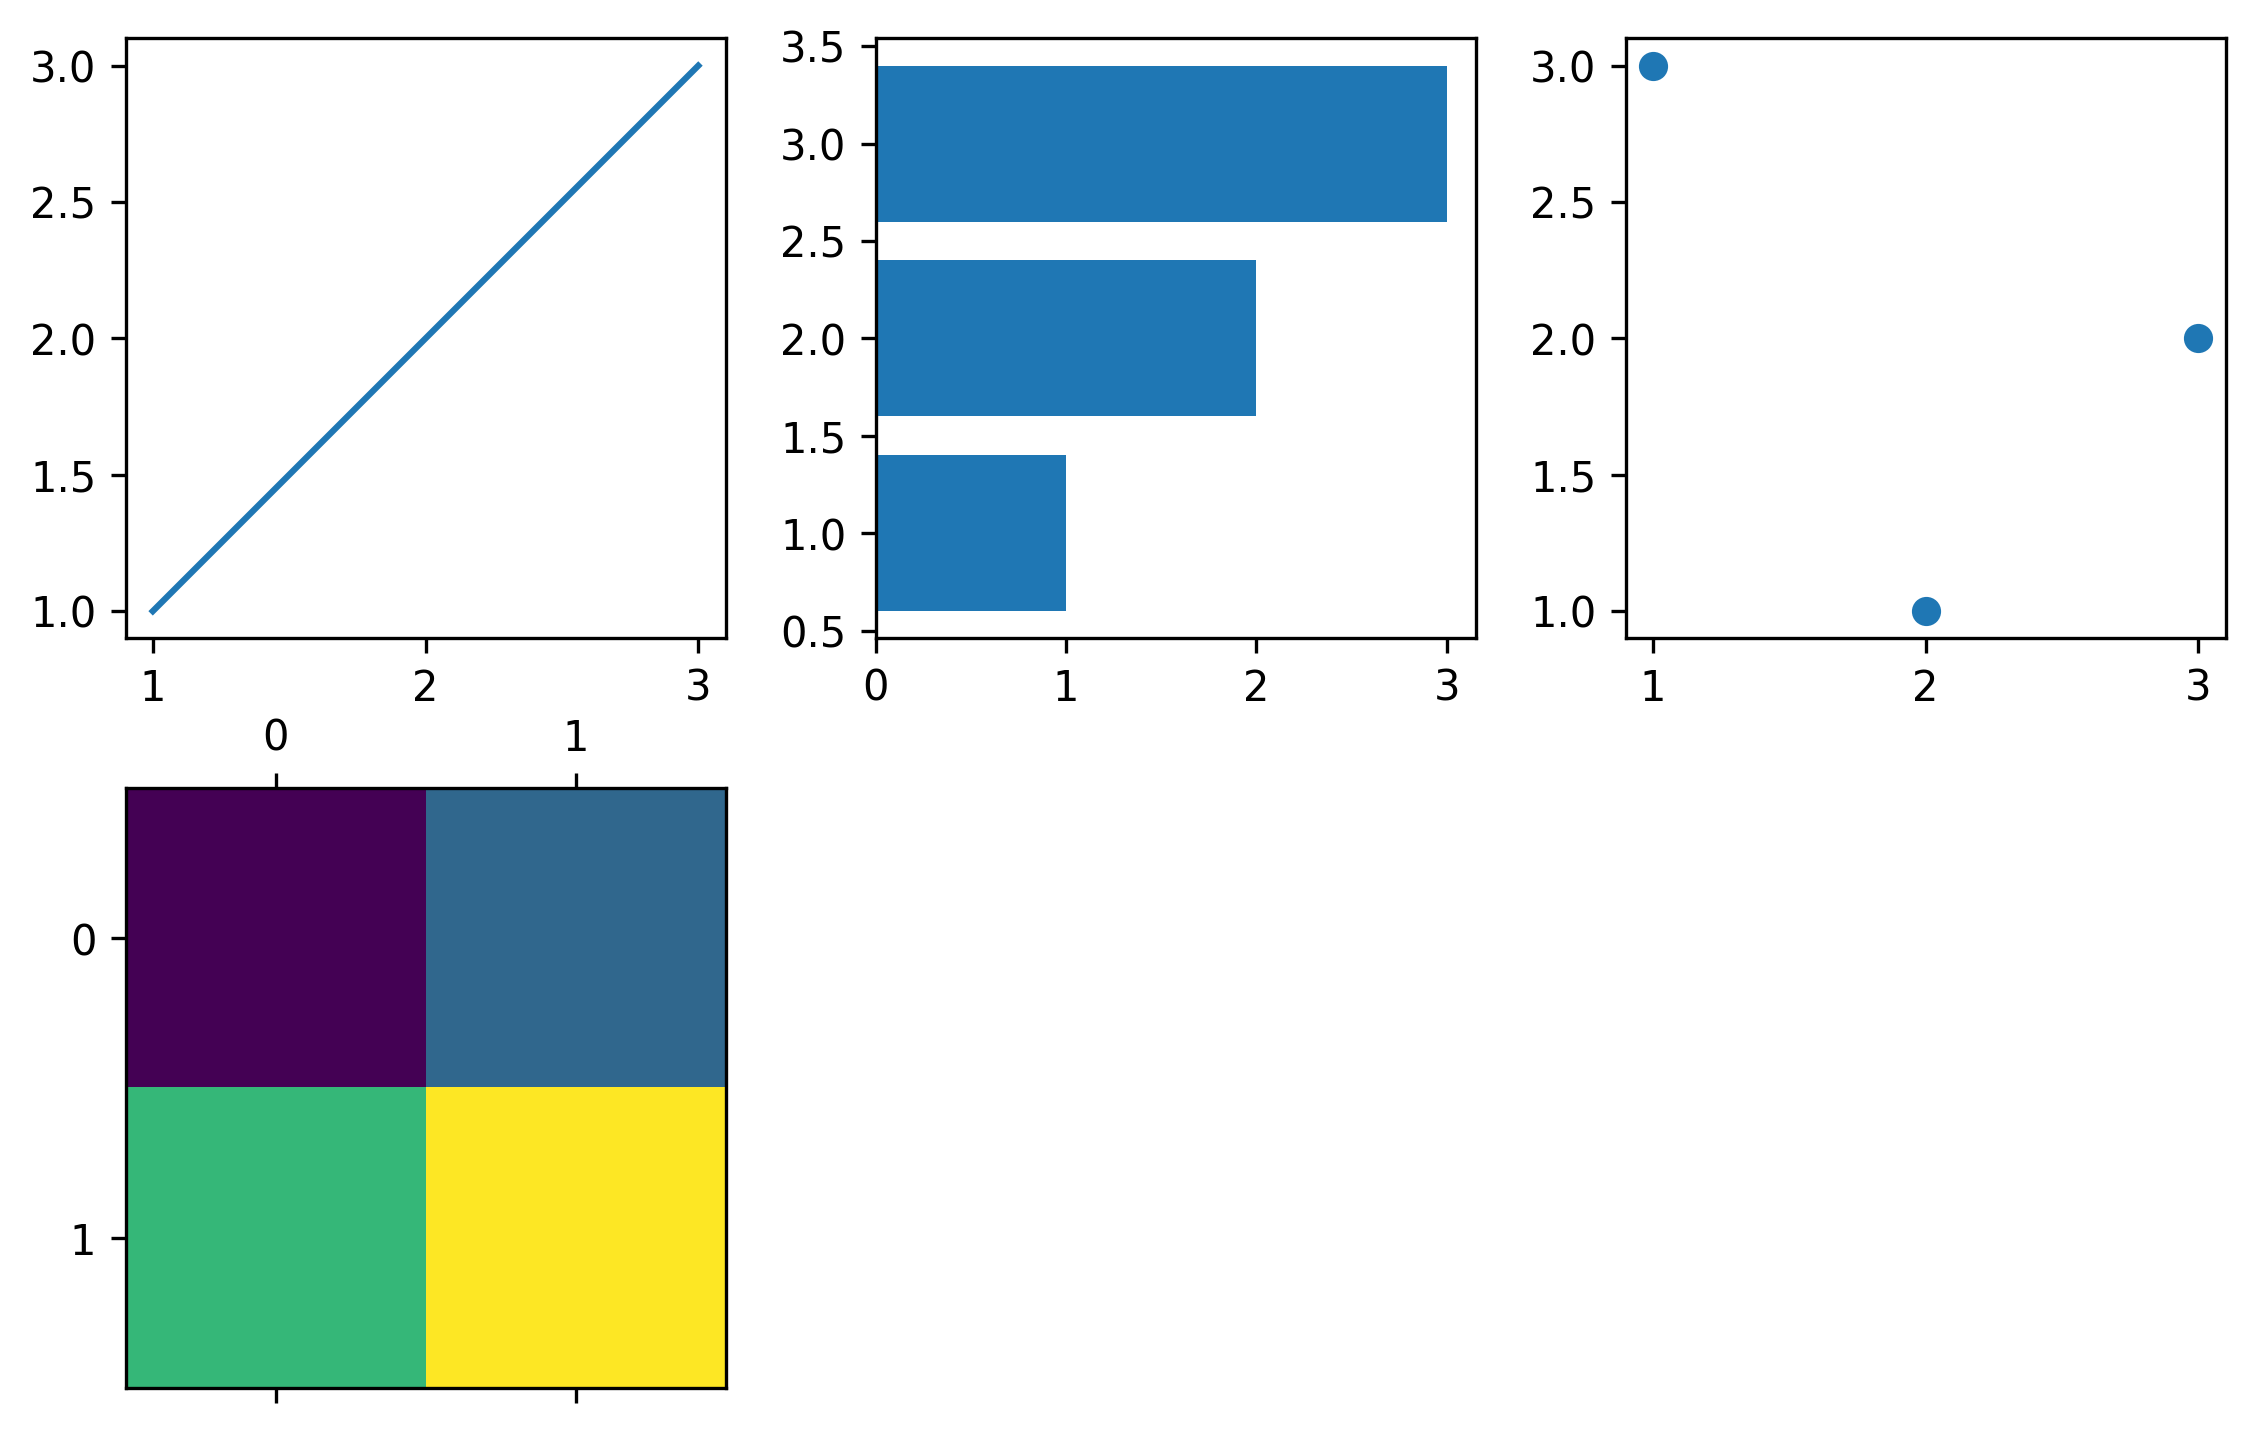
```python
fig = pp.Figure()
axes = []
ax1 = pp.Panel((2, 2))
ax1.plot([1, 2, 3], [1, 2, 3])
axes.append(ax1)
ax2 = pp.Panel((2, 2))
ax2.barh([1, 2, 3], [1, 2, 3])
axes.append(ax2)
ax3 = pp.Panel((2, 2))
ax3.scatter([1, 2, 3], [3, 1, 2])
axes.append(ax3)
ax4 = pp.Panel((2, 2))
ax4.matshow([[1, 2], [3, 4]])
axes.append(ax4)
fig.main = pp.Wrap(axes, ncol = 3)
fig.display()
```

```python
import pandas as pd
import numpy as np
data = pd.DataFrame(np.random.randn(1000, 20))
obs = pd.DataFrame({
"celltype":["Kupffer cells"] * 300 + ["Stellate cells"] * 300 + ["Stupid cells"] * 400
})
celltypes = pd.DataFrame.from_dict({
"Kupffer cells": {"color": "red"},
"Stellate cells": {"color": "blue"},
"Stupid cells": {"color": "green"}
}, orient = "index")
var = pd.DataFrame(index = [f"gene_{i}" for i in range(20)])
var["module"] = ["module_1"] * 5 + ["module_2"] * 5 + ["module_3"] * 10
data.columns = var.index
modules = pd.DataFrame({
"module":["module_1", "module_2", "module_3"],
"color":["red", "blue", "green"]
}).set_index("module")
var["color"] = modules.loc[var["module"]]["color"].values
```
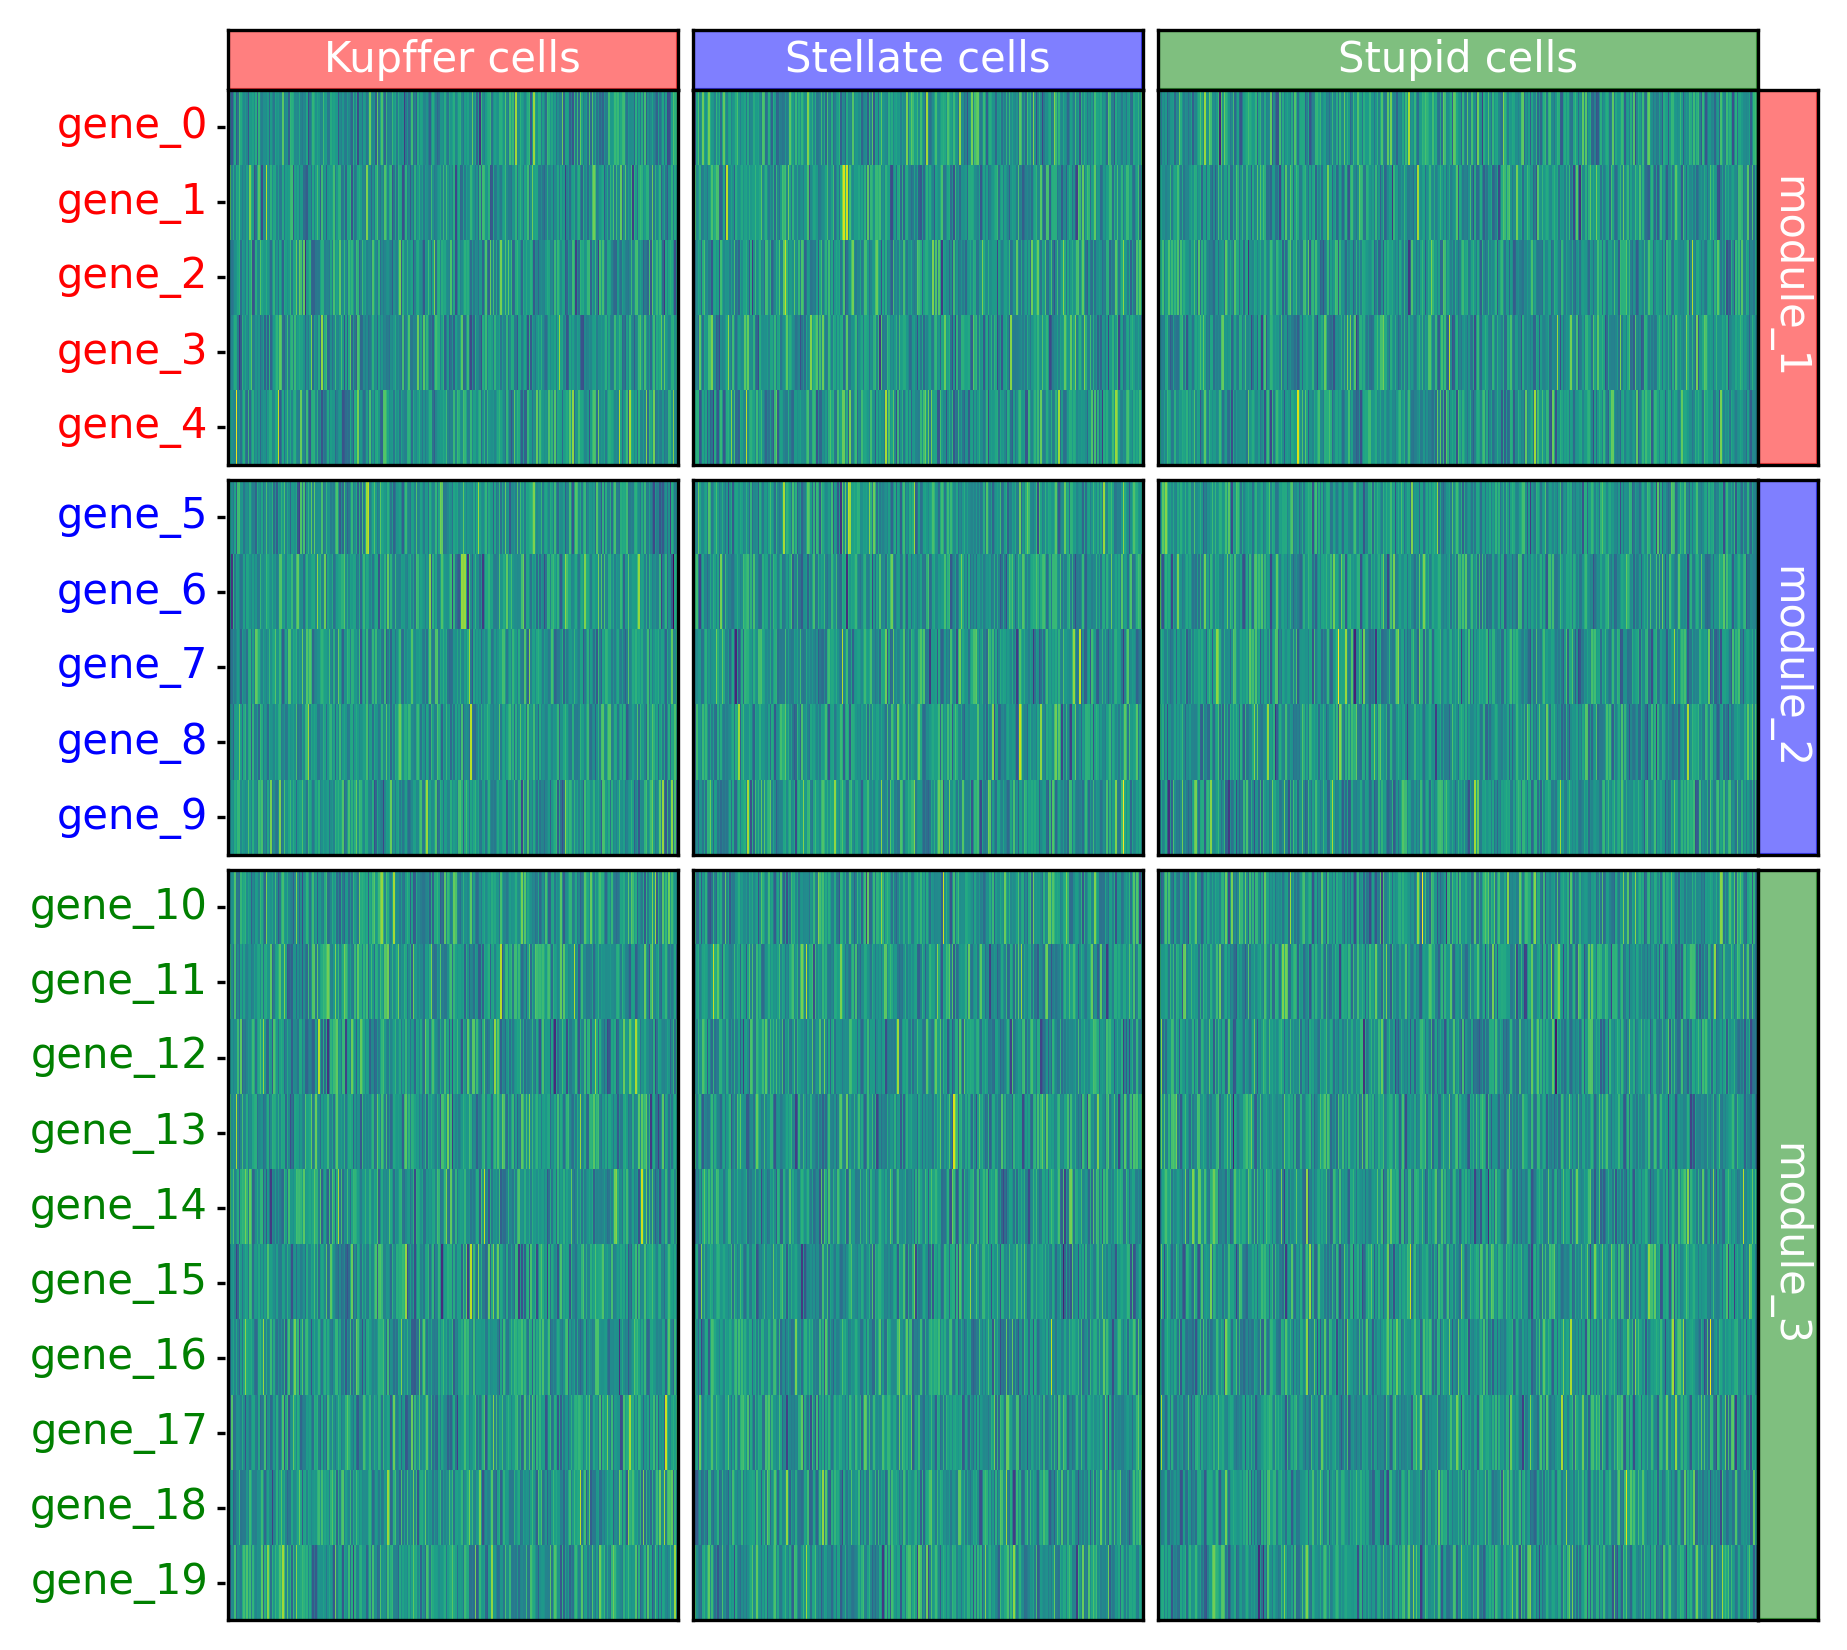
```python
fig = pp.Figure(pp.Grid(padding_height = 0., padding_width = 0.))
row_layout = pp.heatmap.layouts.Broken(var["module"].astype("category"))
col_layout = pp.heatmap.layouts.Broken(obs["celltype"].astype("category"))
main_heatmap = fig.main.add(pp.heatmap.Heatmap(data, row_layout = row_layout, col_layout = col_layout))
heading = fig.main.add_above(pp.heatmap.heading.HeadingTop(obs, celltypes, col_layout))
ticks = fig.main.add_left(pp.heatmap.ticks.TicksLeft(var, row_layout), row = main_heatmap)
heading = fig.main.add_right(pp.heatmap.heading.HeadingRight(var, modules, row_layout), row = main_heatmap)
fig.display()
```

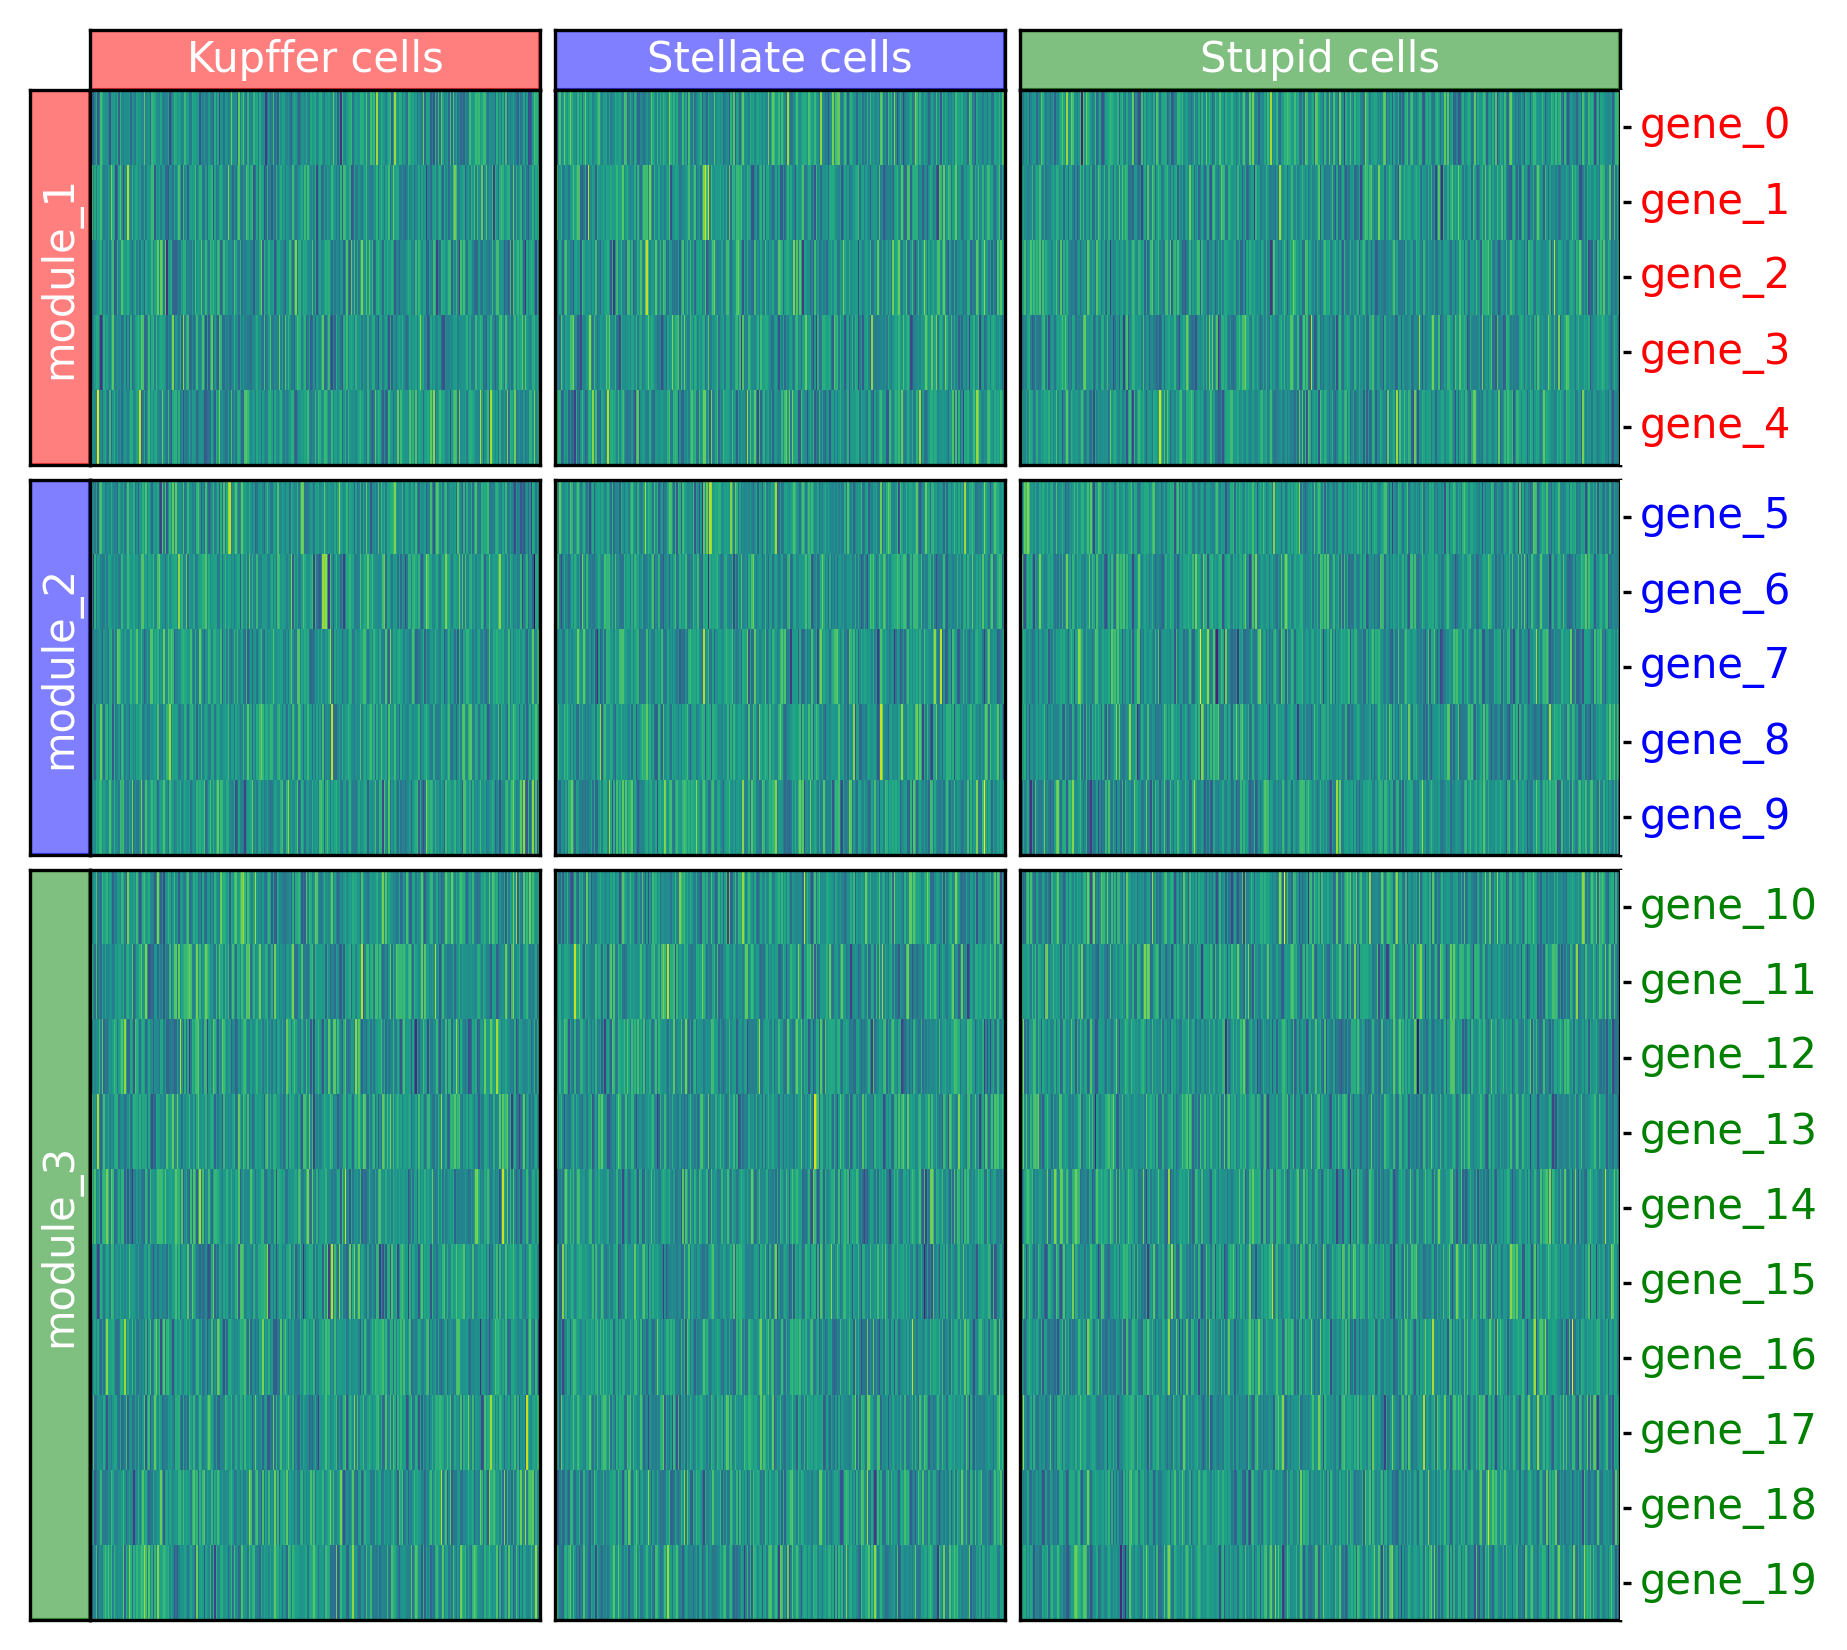
```python
fig = pp.Figure(pp.Grid(padding_height = 0., padding_width = 0.))
row_layout = pp.heatmap.layouts.Broken(var["module"].astype("category"))
col_layout = pp.heatmap.layouts.Broken(obs["celltype"].astype("category"))
main_heatmap = fig.main.add(pp.heatmap.Heatmap(data, row_layout = row_layout, col_layout = col_layout))
heading = fig.main.add_above(pp.heatmap.heading.HeadingTop(obs, celltypes, col_layout))
ticks = fig.main.add_right(pp.heatmap.ticks.TicksRight(var, row_layout), row = main_heatmap)
heading = fig.main.add_left(pp.heatmap.heading.HeadingLeft(var, modules, row_layout), row = main_heatmap)
fig.display()
```

Raw data
{
"_id": null,
"home_page": null,
"name": "polyptich",
"maintainer": null,
"docs_url": null,
"requires_python": ">=3.8",
"maintainer_email": null,
"keywords": "visualization",
"author": null,
"author_email": "Wouter Saelens <wouter.saelens@gmail.com>",
"download_url": "https://files.pythonhosted.org/packages/09/e2/53a92dda8a4bdc947d31556e1319f20fdb12f5919f9984c4358338a51145/polyptich-0.0.17.tar.gz",
"platform": null,
"description": "## Polyptich: easier layouting in matplotlib\n\n\n```python\nimport polyptich as pp\n```\n\n\n```python\nfig = pp.Figure()\nax = pp.Panel((2, 2))\nax.plot([1, 2, 3], [1, 2, 3])\nfig.main.add_right(ax)\n\nax = pp.Panel((2, 2))\nax.plot([1, 2, 3], [1, 2, 3])\nfig.main.add_right(ax)\n\nax = pp.Panel((2, 2))\nax.plot([1, 2, 3], [1, 2, 3])\nfig.main.add_right(ax)\nfig.display()\n```\n\n\n \n\n \n\n\n\n```python\nfig = pp.Figure()\nax1 = pp.Panel((2, 2))\nax1.plot([1, 2, 3], [1, 2, 3])\nax1.add_tag(\"a\")\n\nax2 = pp.Panel((2, 2))\nax2.barh([1, 2, 3], [1, 2, 3])\nax2.add_tag(\"b\")\n\nax3 = pp.Panel((2, 2))\nax3.scatter([1, 2, 3], [3, 1, 2])\nax3.add_tag(\"c\")\n\nax4 = pp.Panel((2, 2))\nax4.matshow([[1, 2], [3, 4]])\nax4.add_tag(\"d\")\n\ntitle = pp.Title(\"Nice Hello\")\nlegend = pp.Panel((None, 0.5))\nlegend.axis(\"off\")\n\nfig.main = title / (ax1 | ax2) / (ax3 | ax4) / legend\nfig.display()\n```\n\n\n \n\n \n\n\n\n```python\nfig = pp.Figure()\naxes = []\n\nax1 = pp.Panel((2, 2))\nax1.plot([1, 2, 3], [1, 2, 3])\naxes.append(ax1)\n\nax2 = pp.Panel((2, 2))\nax2.barh([1, 2, 3], [1, 2, 3])\naxes.append(ax2)\n\nax3 = pp.Panel((2, 2))\nax3.scatter([1, 2, 3], [3, 1, 2])\naxes.append(ax3)\n\nax4 = pp.Panel((2, 2))\nax4.matshow([[1, 2], [3, 4]])\naxes.append(ax4)\n\nfig.main = pp.Wrap(axes, ncol = 3)\nfig.display()\n```\n\n\n \n\n \n\n\n\n```python\nimport pandas as pd\nimport numpy as np\ndata = pd.DataFrame(np.random.randn(1000, 20))\nobs = pd.DataFrame({\n \"celltype\":[\"Kupffer cells\"] * 300 + [\"Stellate cells\"] * 300 + [\"Stupid cells\"] * 400\n})\ncelltypes = pd.DataFrame.from_dict({\n \"Kupffer cells\": {\"color\": \"red\"},\n \"Stellate cells\": {\"color\": \"blue\"},\n \"Stupid cells\": {\"color\": \"green\"}\n}, orient = \"index\")\nvar = pd.DataFrame(index = [f\"gene_{i}\" for i in range(20)])\nvar[\"module\"] = [\"module_1\"] * 5 + [\"module_2\"] * 5 + [\"module_3\"] * 10\ndata.columns = var.index\nmodules = pd.DataFrame({\n \"module\":[\"module_1\", \"module_2\", \"module_3\"],\n \"color\":[\"red\", \"blue\", \"green\"]\n}).set_index(\"module\")\nvar[\"color\"] = modules.loc[var[\"module\"]][\"color\"].values\n```\n\n\n```python\nfig = pp.Figure(pp.Grid(padding_height = 0., padding_width = 0.))\n\nrow_layout = pp.heatmap.layouts.Broken(var[\"module\"].astype(\"category\"))\ncol_layout = pp.heatmap.layouts.Broken(obs[\"celltype\"].astype(\"category\"))\n\nmain_heatmap = fig.main.add(pp.heatmap.Heatmap(data, row_layout = row_layout, col_layout = col_layout))\nheading = fig.main.add_above(pp.heatmap.heading.HeadingTop(obs, celltypes, col_layout))\n\nticks = fig.main.add_left(pp.heatmap.ticks.TicksLeft(var, row_layout), row = main_heatmap)\nheading = fig.main.add_right(pp.heatmap.heading.HeadingRight(var, modules, row_layout), row = main_heatmap)\n\nfig.display()\n```\n\n\n \n\n \n\n\n\n```python\nfig = pp.Figure(pp.Grid(padding_height = 0., padding_width = 0.))\n\nrow_layout = pp.heatmap.layouts.Broken(var[\"module\"].astype(\"category\"))\ncol_layout = pp.heatmap.layouts.Broken(obs[\"celltype\"].astype(\"category\"))\n\nmain_heatmap = fig.main.add(pp.heatmap.Heatmap(data, row_layout = row_layout, col_layout = col_layout))\nheading = fig.main.add_above(pp.heatmap.heading.HeadingTop(obs, celltypes, col_layout))\n\nticks = fig.main.add_right(pp.heatmap.ticks.TicksRight(var, row_layout), row = main_heatmap)\nheading = fig.main.add_left(pp.heatmap.heading.HeadingLeft(var, modules, row_layout), row = main_heatmap)\n\nfig.display()\n```\n\n\n \n\n \n\n",
"bugtrack_url": null,
"license": "MIT",
"summary": "Extra visualization functions",
"version": "0.0.17",
"project_urls": {
"Bug Tracker": "https://github.com/zouter/polyptich/issues",
"Homepage": "https://github.com/zouter/polyptich"
},
"split_keywords": [
"visualization"
],
"urls": [
{
"comment_text": "",
"digests": {
"blake2b_256": "09e253a92dda8a4bdc947d31556e1319f20fdb12f5919f9984c4358338a51145",
"md5": "dd1f72abe602ed5e1e746bfdc9ce4bd0",
"sha256": "715b93f87411fcd7713fbf452586c8c41d62a0110c750a60735597197cbe7e12"
},
"downloads": -1,
"filename": "polyptich-0.0.17.tar.gz",
"has_sig": false,
"md5_digest": "dd1f72abe602ed5e1e746bfdc9ce4bd0",
"packagetype": "sdist",
"python_version": "source",
"requires_python": ">=3.8",
"size": 1070542,
"upload_time": "2025-01-09T12:12:01",
"upload_time_iso_8601": "2025-01-09T12:12:01.015310Z",
"url": "https://files.pythonhosted.org/packages/09/e2/53a92dda8a4bdc947d31556e1319f20fdb12f5919f9984c4358338a51145/polyptich-0.0.17.tar.gz",
"yanked": false,
"yanked_reason": null
}
],
"upload_time": "2025-01-09 12:12:01",
"github": true,
"gitlab": false,
"bitbucket": false,
"codeberg": false,
"github_user": "zouter",
"github_project": "polyptich",
"travis_ci": false,
"coveralls": false,
"github_actions": false,
"lcname": "polyptich"
}
