<a href="https://pypi.org/project/pretty-confusion-matrix/"><img alt="PyPI" src="https://img.shields.io/pypi/v/pretty-confusion-matrix?logo=pypi&logoColor=%23FFFFFF"></a>
<a href="https://github.com/psf/black"><img alt="Code style: black" src="https://img.shields.io/badge/code%20style-black-000000.svg?logo=codeclimate&logoColor=%23FFFFFF"></a>

<a href="https://libraries.io/pypi/pretty-confusion-matrix"><img alt="GitHub Repo stars" src="https://img.shields.io/librariesio/github/wcipriano/pretty-print-confusion-matrix"></a>
<a href="https://github.com/wcipriano"><img alt="GitHub Repo stars" src="https://img.shields.io/github/license/wcipriano/pretty-print-confusion-matrix?logo=apache"></a>
<a href="https://github.com/wcipriano/pretty-print-confusion-matrix/blob/master/LICENSE"><img alt="GitHub License" src="https://img.shields.io/github/stars/wcipriano/pretty-print-confusion-matrix?style=flat&logo=github"></a>

# Confusion Matrix in Python
Plot a pretty confusion matrix (like Matlab) in python using seaborn and matplotlib
Created on Mon Jun 25 14:17:37 2018
@author: Wagner Cipriano - wagnerbhbr
This module get a pretty print confusion matrix from a NumPy matrix or from 2 NumPy arrays (`y_test` and `predictions`).
## Installation
```bash
pip install pretty-confusion-matrix
```
## Get Started
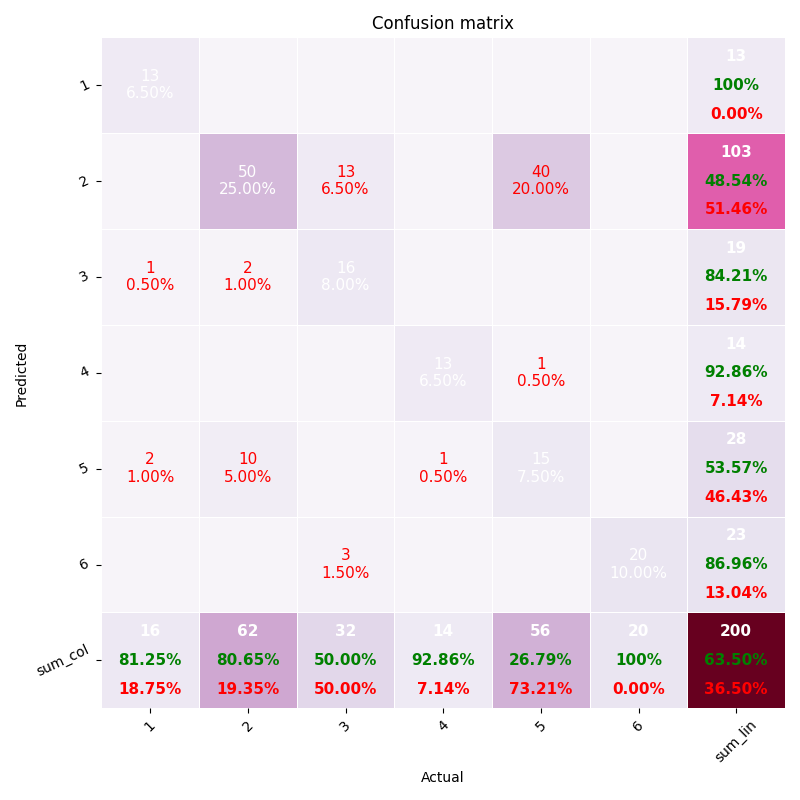
### Plotting from DataFrame:
```python
import numpy as np
import pandas as pd
from pretty_confusion_matrix import pp_matrix
array = np.array([[13, 0, 1, 0, 2, 0],
[0, 50, 2, 0, 10, 0],
[0, 13, 16, 0, 0, 3],
[0, 0, 0, 13, 1, 0],
[0, 40, 0, 1, 15, 0],
[0, 0, 0, 0, 0, 20]])
# get pandas dataframe
df_cm = pd.DataFrame(array, index=range(1, 7), columns=range(1, 7))
# colormap: see this and choose your more dear
cmap = 'PuRd'
pp_matrix(df_cm, cmap=cmap)
```

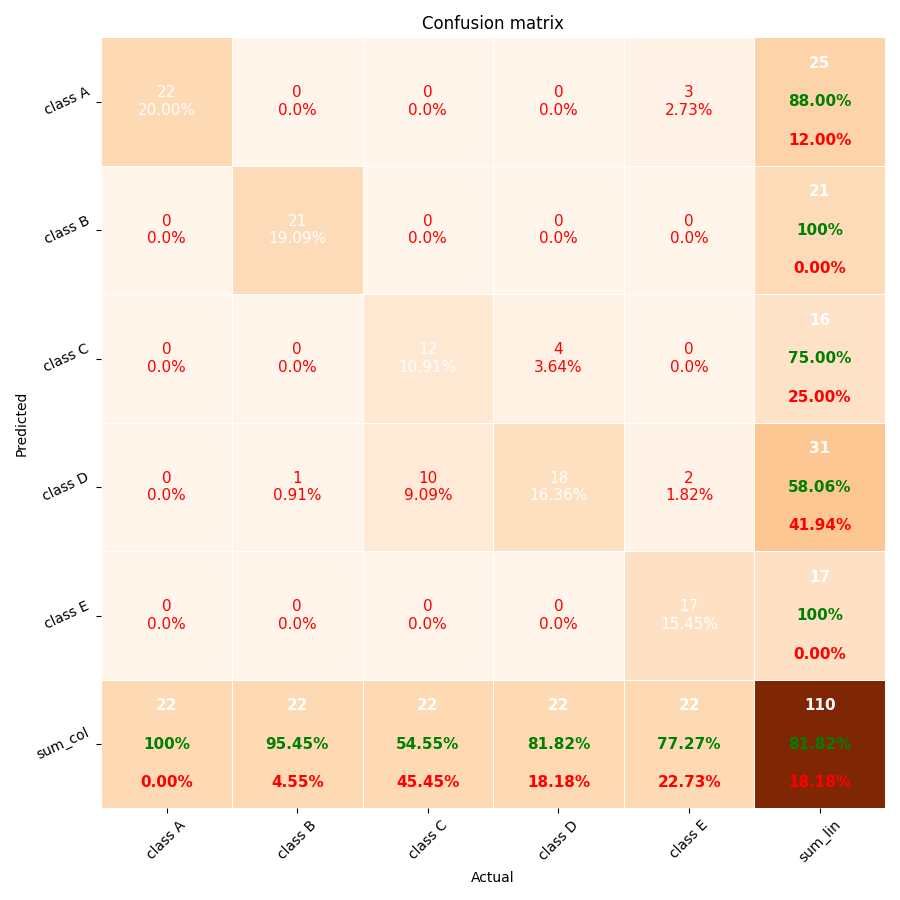
### Plotting from vectors
```python
import numpy as np
from pretty_confusion_matrix import pp_matrix_from_data
y_test = np.array([1, 2, 3, 4, 5, 1, 2, 3, 4, 5, 1, 2, 3, 4, 5, 1, 2, 3, 4, 5, 1, 2, 3, 4, 5, 1, 2, 3, 4, 5, 1, 2, 3, 4, 5, 1, 2, 3, 4, 5, 1, 2, 3, 4, 5, 1, 2, 3, 4, 5, 1, 2,
3, 4, 5, 1, 2, 3, 4, 5, 1, 2, 3, 4, 5, 1, 2, 3, 4, 5, 1, 2, 3, 4, 5, 1, 2, 3, 4, 5, 1, 2, 3, 4, 5, 1, 2, 3, 4, 5, 1, 2, 3, 4, 5, 1, 2, 3, 4, 5, 1, 2, 3, 4, 5, 1, 2, 3, 4, 5])
predic = np.array([1, 2, 4, 3, 5, 1, 2, 4, 3, 5, 1, 2, 3, 4, 4, 1, 4, 3, 4, 5, 1, 2, 4, 4, 5, 1, 2, 4, 4, 5, 1, 2, 4, 4, 5, 1, 2, 4, 4, 5, 1, 2, 3, 3, 5, 1, 2, 3, 3, 5, 1, 2,
3, 4, 4, 1, 2, 3, 4, 1, 1, 2, 3, 4, 1, 1, 2, 3, 4, 1, 1, 2, 4, 4, 5, 1, 2, 4, 4, 5, 1, 2, 4, 4, 5, 1, 2, 4, 4, 5, 1, 2, 3, 4, 5, 1, 2, 3, 4, 5, 1, 2, 3, 4, 5, 1, 2, 3, 4, 5])
pp_matrix_from_data(y_test, predic)
```

## Using custom labels in axis
You can customize the labels in axis, whether by DataFrame or vectors.
### From DataFrame
To plot the matrix with text labels in axis rather than integer, change the params `index` and `columns` of your dataframe.
Getting the example one above, just change the line `df_cm = pd.DataFrame(array, index=range(1, 7), columns=range(1, 7))` by
```python
col = ['Dog', 'Cat', 'Mouse', 'Fox', 'Bird', 'Chicken']
df_cm = pd.DataFrame(array, index=col, columns=col)
```
It'll replace the integer labels (**1...6**) in the axis, by **Dog, Cat, Mouse**, and so on..
### From vectors
It's very similar, in this case you just need to use the `columns` param like the example below.
This param is a positional array, i.e., the order must be the same of the data representation.
In this example _Dog_ will be assigned to the class 0, _Cat_ will be assigned to the class 1, and so on and so forth.
Getting the example two above, just change the line `pp_matrix_from_data(y_test, predic)`, by
```python
columns = ['Dog', 'Cat', 'Mouse', 'Fox', 'Bird']
pp_matrix_from_data(y_test, predic, columns)
```
It'll replace "class A, ..., class E" in the axis, by **Dog, Cat, ..., Bird**.
More information about "_How to plot confusion matrix with string axis rather than integer in python_" in [this Stackoverflow answer](https://stackoverflow.com/a/51176855/1809554).
## Choosing Colormaps
You can choose the layout of the your matrix by a lot of colors options like PuRd, Oranges and more...
To customizer your color scheme, use the param cmap of funcion pp_matrix.
To see all the colormap available, please do this:
```python
from matplotlib import colormaps
list(colormaps)
```
More information about Choosing Colormaps in Matplotlib is available [here](https://matplotlib.org/stable/users/explain/colors/colormaps.html).
## References:
### 1. MATLAB confusion matrix:
a) [Plot Confusion](https://www.mathworks.com/help/nnet/ref/plotconfusion.html)
b) [Plot Confusion Matrix Using Categorical Labels](https://www.mathworks.com/help/examples/nnet/win64/PlotConfusionMatrixUsingCategoricalLabelsExample_02.png)
### 2. Examples and more on Python:
a) [How to plot confusion matrix with string axis rather than integer in python](https://stackoverflow.com/questions/5821125/how-to-plot-confusion-matrix-with-string-axis-rather-than-integer-in-python/51176855#51176855)
b) [Plot-scikit-learn-classification-report](https://stackoverflow.com/questions/28200786/how-to-plot-scikit-learn-classification-report)
c) [Plot-confusion-matrix-with-string-axis-rather-than-integer-in-Python](https://stackoverflow.com/questions/5821125/how-to-plot-confusion-matrix-with-string-axis-rather-than-integer-in-python)
d) [Seaborn heatmap](https://www.programcreek.com/python/example/96197/seaborn.heatmap)
e) [Sklearn-plot-confusion-matrix-with-labels](https://stackoverflow.com/questions/19233771/sklearn-plot-confusion-matrix-with-labels/31720054)
f) [Model-selection-plot-confusion-matrix](http://scikit-learn.org/stable/auto_examples/model_selection/plot_confusion_matrix.html#sphx-glr-auto-examples-model-selection-plot-confusion-matrix-py)
Raw data
{
"_id": null,
"home_page": "https://github.com/wcipriano/pretty-print-confusion-matrix",
"name": "pretty-confusion-matrix",
"maintainer": null,
"docs_url": null,
"requires_python": "<3.12,>=3.9",
"maintainer_email": null,
"keywords": "confusion matrix",
"author": "Wagner Cipriano",
"author_email": "wagnao@gmail.com",
"download_url": "https://files.pythonhosted.org/packages/6c/44/e55904d701f9ee633c4086455a1e56f182567107adb2af39e47049df986a/pretty_confusion_matrix-0.6.0.tar.gz",
"platform": null,
"description": "\n<a href=\"https://pypi.org/project/pretty-confusion-matrix/\"><img alt=\"PyPI\" src=\"https://img.shields.io/pypi/v/pretty-confusion-matrix?logo=pypi&logoColor=%23FFFFFF\"></a>\n<a href=\"https://github.com/psf/black\"><img alt=\"Code style: black\" src=\"https://img.shields.io/badge/code%20style-black-000000.svg?logo=codeclimate&logoColor=%23FFFFFF\"></a>\n\n<a href=\"https://libraries.io/pypi/pretty-confusion-matrix\"><img alt=\"GitHub Repo stars\" src=\"https://img.shields.io/librariesio/github/wcipriano/pretty-print-confusion-matrix\"></a>\n<a href=\"https://github.com/wcipriano\"><img alt=\"GitHub Repo stars\" src=\"https://img.shields.io/github/license/wcipriano/pretty-print-confusion-matrix?logo=apache\"></a>\n<a href=\"https://github.com/wcipriano/pretty-print-confusion-matrix/blob/master/LICENSE\"><img alt=\"GitHub License\" src=\"https://img.shields.io/github/stars/wcipriano/pretty-print-confusion-matrix?style=flat&logo=github\"></a>\n\n\n# Confusion Matrix in Python\nPlot a pretty confusion matrix (like Matlab) in python using seaborn and matplotlib\n\nCreated on Mon Jun 25 14:17:37 2018\n@author: Wagner Cipriano - wagnerbhbr\n\n\nThis module get a pretty print confusion matrix from a NumPy matrix or from 2 NumPy arrays (`y_test` and `predictions`).\n\n## Installation\n```bash\npip install pretty-confusion-matrix\n```\n\n## Get Started\n\n### Plotting from DataFrame:\n```python\nimport numpy as np\nimport pandas as pd\nfrom pretty_confusion_matrix import pp_matrix\n\narray = np.array([[13, 0, 1, 0, 2, 0],\n [0, 50, 2, 0, 10, 0],\n [0, 13, 16, 0, 0, 3],\n [0, 0, 0, 13, 1, 0],\n [0, 40, 0, 1, 15, 0],\n [0, 0, 0, 0, 0, 20]])\n\n# get pandas dataframe\ndf_cm = pd.DataFrame(array, index=range(1, 7), columns=range(1, 7))\n# colormap: see this and choose your more dear\ncmap = 'PuRd'\npp_matrix(df_cm, cmap=cmap)\n```\n\n\n\n### Plotting from vectors\n\n\n```python\nimport numpy as np\nfrom pretty_confusion_matrix import pp_matrix_from_data\n\ny_test = np.array([1, 2, 3, 4, 5, 1, 2, 3, 4, 5, 1, 2, 3, 4, 5, 1, 2, 3, 4, 5, 1, 2, 3, 4, 5, 1, 2, 3, 4, 5, 1, 2, 3, 4, 5, 1, 2, 3, 4, 5, 1, 2, 3, 4, 5, 1, 2, 3, 4, 5, 1, 2,\n 3, 4, 5, 1, 2, 3, 4, 5, 1, 2, 3, 4, 5, 1, 2, 3, 4, 5, 1, 2, 3, 4, 5, 1, 2, 3, 4, 5, 1, 2, 3, 4, 5, 1, 2, 3, 4, 5, 1, 2, 3, 4, 5, 1, 2, 3, 4, 5, 1, 2, 3, 4, 5, 1, 2, 3, 4, 5])\npredic = np.array([1, 2, 4, 3, 5, 1, 2, 4, 3, 5, 1, 2, 3, 4, 4, 1, 4, 3, 4, 5, 1, 2, 4, 4, 5, 1, 2, 4, 4, 5, 1, 2, 4, 4, 5, 1, 2, 4, 4, 5, 1, 2, 3, 3, 5, 1, 2, 3, 3, 5, 1, 2,\n 3, 4, 4, 1, 2, 3, 4, 1, 1, 2, 3, 4, 1, 1, 2, 3, 4, 1, 1, 2, 4, 4, 5, 1, 2, 4, 4, 5, 1, 2, 4, 4, 5, 1, 2, 4, 4, 5, 1, 2, 3, 4, 5, 1, 2, 3, 4, 5, 1, 2, 3, 4, 5, 1, 2, 3, 4, 5])\n\npp_matrix_from_data(y_test, predic)\n```\n\n\n\n\n## Using custom labels in axis\nYou can customize the labels in axis, whether by DataFrame or vectors.\n\n### From DataFrame\nTo plot the matrix with text labels in axis rather than integer, change the params `index` and `columns` of your dataframe.\nGetting the example one above, just change the line `df_cm = pd.DataFrame(array, index=range(1, 7), columns=range(1, 7))` by\n```python\ncol = ['Dog', 'Cat', 'Mouse', 'Fox', 'Bird', 'Chicken']\ndf_cm = pd.DataFrame(array, index=col, columns=col)\n```\nIt'll replace the integer labels (**1...6**) in the axis, by **Dog, Cat, Mouse**, and so on..\n\n\n### From vectors\nIt's very similar, in this case you just need to use the `columns` param like the example below.\nThis param is a positional array, i.e., the order must be the same of the data representation. \nIn this example _Dog_ will be assigned to the class 0, _Cat_ will be assigned to the class 1, and so on and so forth.\nGetting the example two above, just change the line `pp_matrix_from_data(y_test, predic)`, by\n```python\ncolumns = ['Dog', 'Cat', 'Mouse', 'Fox', 'Bird'] \npp_matrix_from_data(y_test, predic, columns)\n```\nIt'll replace \"class A, ..., class E\" in the axis, by **Dog, Cat, ..., Bird**.\n\nMore information about \"_How to plot confusion matrix with string axis rather than integer in python_\" in [this Stackoverflow answer](https://stackoverflow.com/a/51176855/1809554).\n\n\n\n## Choosing Colormaps\n\nYou can choose the layout of the your matrix by a lot of colors options like PuRd, Oranges and more... \nTo customizer your color scheme, use the param cmap of funcion pp_matrix. \nTo see all the colormap available, please do this:\n```python\nfrom matplotlib import colormaps\nlist(colormaps)\n```\n\nMore information about Choosing Colormaps in Matplotlib is available [here](https://matplotlib.org/stable/users/explain/colors/colormaps.html).\n\n\n\n\n## References:\n### 1. MATLAB confusion matrix:\n\na) [Plot Confusion](https://www.mathworks.com/help/nnet/ref/plotconfusion.html)\n \nb) [Plot Confusion Matrix Using Categorical Labels](https://www.mathworks.com/help/examples/nnet/win64/PlotConfusionMatrixUsingCategoricalLabelsExample_02.png)\n\n\n\n### 2. Examples and more on Python:\n\n a) [How to plot confusion matrix with string axis rather than integer in python](https://stackoverflow.com/questions/5821125/how-to-plot-confusion-matrix-with-string-axis-rather-than-integer-in-python/51176855#51176855)\n \n b) [Plot-scikit-learn-classification-report](https://stackoverflow.com/questions/28200786/how-to-plot-scikit-learn-classification-report)\n \n c) [Plot-confusion-matrix-with-string-axis-rather-than-integer-in-Python](https://stackoverflow.com/questions/5821125/how-to-plot-confusion-matrix-with-string-axis-rather-than-integer-in-python)\n \n d) [Seaborn heatmap](https://www.programcreek.com/python/example/96197/seaborn.heatmap)\n \n e) [Sklearn-plot-confusion-matrix-with-labels](https://stackoverflow.com/questions/19233771/sklearn-plot-confusion-matrix-with-labels/31720054)\n\n f) [Model-selection-plot-confusion-matrix](http://scikit-learn.org/stable/auto_examples/model_selection/plot_confusion_matrix.html#sphx-glr-auto-examples-model-selection-plot-confusion-matrix-py)\n\n\n",
"bugtrack_url": null,
"license": null,
"summary": "plot a pretty confusion matrix (like Matlab) in python using seaborn and matplotlib",
"version": "0.6.0",
"project_urls": {
"Homepage": "https://github.com/wcipriano/pretty-print-confusion-matrix",
"Repository": "https://github.com/wcipriano/pretty-print-confusion-matrix"
},
"split_keywords": [
"confusion",
"matrix"
],
"urls": [
{
"comment_text": "",
"digests": {
"blake2b_256": "a3a7d1e1ed8b2f8ab003500c53726617c011dc22764236b36cad1126b5b86caf",
"md5": "6719196b8a8e03abaac967bb4e3d6780",
"sha256": "79c8fff637379314061bb0145d762a61daf046bec57dab07c29f6aa2ef9ab2ea"
},
"downloads": -1,
"filename": "pretty_confusion_matrix-0.6.0-py3-none-any.whl",
"has_sig": false,
"md5_digest": "6719196b8a8e03abaac967bb4e3d6780",
"packagetype": "bdist_wheel",
"python_version": "py3",
"requires_python": "<3.12,>=3.9",
"size": 10821,
"upload_time": "2024-08-22T01:36:20",
"upload_time_iso_8601": "2024-08-22T01:36:20.938545Z",
"url": "https://files.pythonhosted.org/packages/a3/a7/d1e1ed8b2f8ab003500c53726617c011dc22764236b36cad1126b5b86caf/pretty_confusion_matrix-0.6.0-py3-none-any.whl",
"yanked": false,
"yanked_reason": null
},
{
"comment_text": "",
"digests": {
"blake2b_256": "6c44e55904d701f9ee633c4086455a1e56f182567107adb2af39e47049df986a",
"md5": "0a276498335b3bb64de47ec91df316ce",
"sha256": "60dcd20760a6c1b9c64efffb0509f93f42149b7ba87963bb35c71df50c5cdd7c"
},
"downloads": -1,
"filename": "pretty_confusion_matrix-0.6.0.tar.gz",
"has_sig": false,
"md5_digest": "0a276498335b3bb64de47ec91df316ce",
"packagetype": "sdist",
"python_version": "source",
"requires_python": "<3.12,>=3.9",
"size": 9959,
"upload_time": "2024-08-22T01:36:22",
"upload_time_iso_8601": "2024-08-22T01:36:22.464678Z",
"url": "https://files.pythonhosted.org/packages/6c/44/e55904d701f9ee633c4086455a1e56f182567107adb2af39e47049df986a/pretty_confusion_matrix-0.6.0.tar.gz",
"yanked": false,
"yanked_reason": null
}
],
"upload_time": "2024-08-22 01:36:22",
"github": true,
"gitlab": false,
"bitbucket": false,
"codeberg": false,
"github_user": "wcipriano",
"github_project": "pretty-print-confusion-matrix",
"travis_ci": false,
"coveralls": false,
"github_actions": false,
"lcname": "pretty-confusion-matrix"
}
