# pyEllipse
A Python package for computing Hotelling's T² statistics and generating confidence ellipse/ellipsoid coordinates for multivariate data analysis and visualization.
[](https://badge.fury.io/py/pyellipse)
[](https://pypi.org/project/pyellipse/)
[](https://github.com/ChristianGoueguel/pyEllipse/blob/main/LICENSE)


## Overview
`pyEllipse` provides three main functions for analyzing multivariate data:
1. __`hotelling_parameters`__ - Calculate Hotelling's T² statistics and ellipse parameters
2. __`hotelling_coordinates`__ - Generate Hotelling's ellipse/ellipsoid coordinates from PCA/PLS scores
3. __`confidence_ellipse`__ - Compute confidence ellipse/ellipsoid coordinates from raw data with grouping support
## Installation
```bash
pip install pyEllipse
```
## Usage Examples
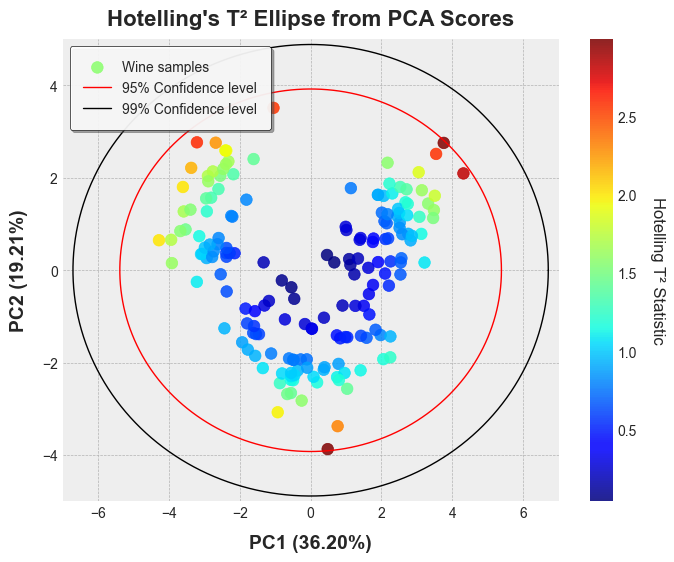
### Example 1: Hotelling's T² statistic and confidence ellipse from PCA Scores
```python
import numpy as np
import pandas as pd
import matplotlib.pyplot as plt
from mpl_toolkits.mplot3d import Axes3D
from sklearn.preprocessing import StandardScaler
from sklearn.decomposition import PCA
from pathlib import Path
from pyEllipse import hotelling_parameters, hotelling_coordinates, confidence_ellipse
```
```python
def load_wine_data():
"""Load wine dataset and add cultivar labels"""
wine_df = pd.read_csv('data/wine.csv')
# Add cultivar labels based on standard Wine dataset structure
cultivar = []
for i in range(len(wine_df)):
if i < 59:
cultivar.append('Cultivar 1')
elif i < 130:
cultivar.append('Cultivar 2')
else:
cultivar.append('Cultivar 3')
wine_df['Cultivar'] = cultivar
return wine_df
```
```python
wine_df = load_wine_data()
X = wine_df.drop('Cultivar', axis=1)
y = wine_df['Cultivar']
# Perform PCA
pca = PCA()
SS = StandardScaler()
X = SS.fit_transform(X)
pca_scores = pca.fit_transform(X)
explained_var = pca.explained_variance_ratio_
```
```python
plt.style.use('bmh')
# Calculate T² statistics
results = hotelling_parameters(pca_scores, k=2)
t2 = results['Tsquared'].values
# Generate ellipse coordinates for plotting
ellipse_95 = hotelling_coordinates(pca_scores, pcx=1, pcy=2, conf_limit=0.95)
ellipse_99 = hotelling_coordinates(pca_scores, pcx=1, pcy=2, conf_limit=0.99)
# Plot the PCA scores with Hotelling's T² ellipse
plt.figure(figsize=(8, 6))
scatter = plt.scatter(
pca_scores[:, 0], pca_scores[:, 1],
c=t2, cmap='jet', alpha=0.85, s=70, label='Wine samples'
)
cbar = plt.colorbar(scatter)
cbar.set_label('Hotelling T² Statistic', rotation=270, labelpad=20)
plt.plot(ellipse_95['x'], ellipse_95['y'], 'r-', linewidth=1, label='95% Confidence level')
plt.plot(ellipse_99['x'], ellipse_99['y'], 'k-', linewidth=1, label='99% Confidence level')
plt.xlim(-1000, 1000)
plt.ylim(-50, 60)
plt.xlabel(f'PC1 ({explained_var[0]*100:.2f}%)', fontsize=14, labelpad=10, fontweight='bold')
plt.ylabel(f'PC2 ({explained_var[1]*100:.2f}%)', fontsize=14, labelpad=10, fontweight='bold')
plt.title("Hotelling's T² Ellipse from PCA Scores", fontsize=16, pad=10, fontweight='bold')
plt.legend(
loc='upper left', fontsize=10, frameon=True, framealpha=0.9,
edgecolor='black', shadow=True, facecolor='white', borderpad=1
)
plt.show()
```
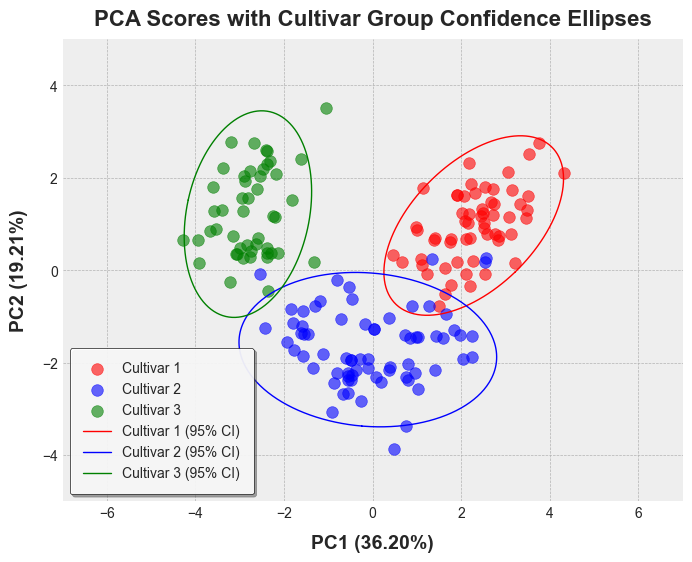
### Example 2: Grouped Confidence Ellipses
```python
wine_df['PC1'] = pca_scores[:, 0]
wine_df['PC2'] = pca_scores[:, 1]
colors = ['red', 'blue', 'green']
cultivars = wine_df['Cultivar'].unique()
color_map = {cultivar: color for cultivar, color in zip(cultivars, colors)}
point_colors = wine_df['Cultivar'].map(color_map)
# Plott PCA scores with confidence ellipses for each cultivar
plt.figure(figsize=(8, 6))
for i, cultivar in enumerate(cultivars):
mask = wine_df['Cultivar'] == cultivar
plt.scatter(
wine_df.loc[mask, 'PC1'], wine_df.loc[mask, 'PC2'], # type: ignore
c=colors[i], alpha=0.6, s=70, label=cultivar
)
ellipse_coords = confidence_ellipse(
data=wine_df,
x='PC1',
y='PC2',
group_by='Cultivar',
conf_level=0.95,
robust=True,
distribution='hotelling'
)
for i, cultivar in enumerate(cultivars):
ellipse_data = ellipse_coords[ellipse_coords['Cultivar'] == cultivar]
plt.plot(
ellipse_data['x'], ellipse_data['y'],
color=colors[i], linewidth=1, linestyle='-', label=f'{cultivar} (95% CI)'
)
plt.xlim(-1000, 1000)
plt.ylim(-50, 60)
plt.xlabel(f'PC1 ({explained_var[0]*100:.2f}%)', fontsize=14, labelpad=10, fontweight='bold')
plt.ylabel(f'PC2 ({explained_var[1]*100:.2f}%)', fontsize=14, labelpad=10, fontweight='bold')
plt.title("PCA Scores with Cultivar Group Confidence Ellipses", fontsize=16, pad=10, fontweight='bold')
plt.legend(
loc='upper left', fontsize=10, frameon=True, framealpha=0.9,
edgecolor='black', shadow=True, facecolor='white', borderpad=1
)
plt.show()
```
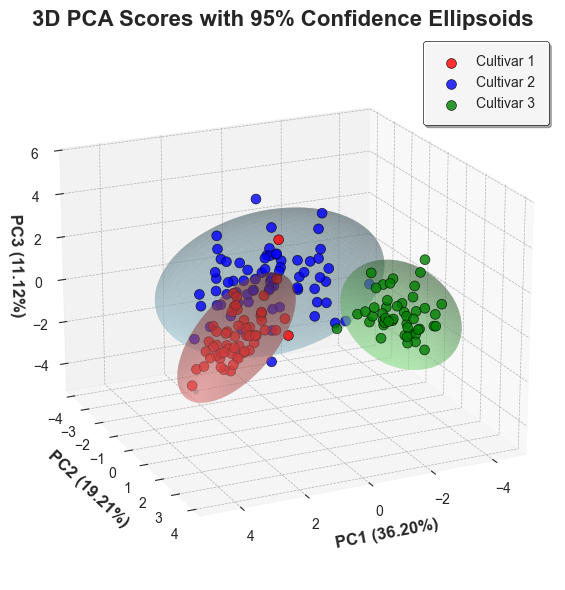
### Example 3: Grouped 3D Confidence Ellipsoids
```python
wine_df['PC1'] = pca_scores[:, 0]
wine_df['PC2'] = pca_scores[:, 1]
wine_df['PC3'] = pca_scores[:, 2]
colors = ['red', 'blue', 'green']
light_colors = ['lightcoral', 'lightblue', 'lightgreen']
cultivars = wine_df['Cultivar'].unique()
ellipse_coords = confidence_ellipse(
data=wine_df,
x='PC1',
y='PC2',
z='PC3',
group_by='Cultivar',
conf_level=0.95,
robust=True,
distribution='hotelling'
)
fig = plt.figure(figsize=(10, 6), facecolor='white')
ax = fig.add_subplot(111, projection='3d', facecolor='white')
for i, cultivar in enumerate(cultivars):
mask = wine_df['Cultivar'] == cultivar
ax.scatter(
wine_df.loc[mask, 'PC1'],
wine_df.loc[mask, 'PC2'],
wine_df.loc[mask, 'PC3'], # type: ignore
c=colors[i],
alpha=0.8,
s=50,
label=cultivar,
edgecolors='black',
linewidth=0.5
)
ellipse_data = ellipse_coords[ellipse_coords['Cultivar'] == cultivar]
n_points = int(np.sqrt(len(ellipse_data)))
x_2d = ellipse_data['x'].values.reshape(n_points, -1)
y_2d = ellipse_data['y'].values.reshape(n_points, -1)
z_2d = ellipse_data['z'].values.reshape(n_points, -1)
ax.plot_surface(
x_2d,
y_2d,
z_2d,
color=light_colors[i],
alpha=0.4,
linewidth=0,
antialiased=True
)
ax.set_xlabel(f'PC1 ({explained_var[0]*100:.2f}%)', fontsize=12, labelpad=5, fontweight='bold')
ax.set_ylabel(f'PC2 ({explained_var[1]*100:.2f}%)', fontsize=12, labelpad=5, fontweight='bold')
ax.set_zlabel(f'PC3 ({explained_var[2]*100:.2f}%)', fontsize=12, labelpad=1, fontweight='bold')
ax.set_title('3D PCA Scores with 95% Confidence Ellipsoids', fontsize=16, fontweight='bold')
ax.legend(
loc='upper right', fontsize=10, frameon=True, framealpha=0.9,
edgecolor='black', shadow=True, facecolor='white', borderpad=1
)
ax.grid(True, alpha=0.3, color='gray')
ax.view_init(elev=20, azim=65)
plt.tight_layout()
plt.show()
```
## Key Differences Between Functions
| Feature | `hotelling_parameters` | `hotelling_coordinates` | `confidence_ellipse` |
|---------|----------------|-----------------|---------------------|
| __Input__ | Component scores | Component scores | Raw data |
| __Purpose__ | T² statistics | Plot coordinates | Plot coordinates |
| __Grouping__ | -- | -- | Yes |
| __Robust__ | -- | -- | Yes |
| __2D/3D__ | 2D only for ellipse params | Both | Both |
| __Distribution__ | Hotelling only | Hotelling only | Normal or Hotelling |
| __Use Case__ | Outlier detection, QC | Visualizing PCA | Exploratory data analysis |
## When to Use Each Function
### Use `hotelling_parameters` when:
- You need T² statistics for outlier detection
- You want confidence cutoff values
- You're performing quality control or process monitoring
- You need ellipse parameters (semi-axes lengths)
### Use `hotelling_coordinates` when:
- You have PCA/PLS component scores
- You want to visualize confidence regions on score plots
- You need precise control over which components to plot
- You're creating publication-quality figures from multivariate models
### Use `confidence_ellipse` when:
- You're working with raw data (not scores)
- You need to compare multiple groups
- You want robust estimation for outlier-resistant analysis
- You need flexibility in distribution choice (normal vs Hotelling)
## References
1. Hotelling, H. (1931). The generalization of Student's ratio. *Annals of Mathematical Statistics*, 2(3), 360-378.
2. Brereton, R. G. (2016). Hotelling's T-squared distribution, its relationship to the F distribution and its use in multivariate space. *Journal of Chemometrics*, 30(1), 18-21.
3. Raymaekers, J., & Rousseeuw, P. J. (2019). Fast robust correlation for high dimensional data. *Technometrics*, 63(2), 184-198.
4. Jackson, J. E. (1991). *A User's Guide to Principal Components*. Wiley.
Raw data
{
"_id": null,
"home_page": "https://github.com/ChristianGoueguel/pyEllipse",
"name": "pyEllipse",
"maintainer": null,
"docs_url": null,
"requires_python": "<3.14,>=3.9",
"maintainer_email": null,
"keywords": "statistics, confidence-ellipse, hotelling, multivariate, visualization",
"author": "Christian L. Goueguel",
"author_email": "christian.goueguel@gmail.com",
"download_url": "https://files.pythonhosted.org/packages/60/2a/3aef4bc0aeecec019ac1de9d7e3636c3244ab9bfc80fda4f4ec1a4549bc2/pyellipse-0.1.3.tar.gz",
"platform": null,
"description": "# pyEllipse\n\nA Python package for computing Hotelling's T\u00b2 statistics and generating confidence ellipse/ellipsoid coordinates for multivariate data analysis and visualization.\n\n[](https://badge.fury.io/py/pyellipse)\n[](https://pypi.org/project/pyellipse/)\n[](https://github.com/ChristianGoueguel/pyEllipse/blob/main/LICENSE)\n\n\n\n\n\n\n\n## Overview\n\n`pyEllipse` provides three main functions for analyzing multivariate data:\n\n1. __`hotelling_parameters`__ - Calculate Hotelling's T\u00b2 statistics and ellipse parameters\n2. __`hotelling_coordinates`__ - Generate Hotelling's ellipse/ellipsoid coordinates from PCA/PLS scores\n3. __`confidence_ellipse`__ - Compute confidence ellipse/ellipsoid coordinates from raw data with grouping support\n\n## Installation\n\n```bash\npip install pyEllipse\n```\n\n## Usage Examples\n\n### Example 1: Hotelling's T\u00b2 statistic and confidence ellipse from PCA Scores\n\n```python\nimport numpy as np\nimport pandas as pd\nimport matplotlib.pyplot as plt\nfrom mpl_toolkits.mplot3d import Axes3D\nfrom sklearn.preprocessing import StandardScaler\nfrom sklearn.decomposition import PCA\nfrom pathlib import Path\nfrom pyEllipse import hotelling_parameters, hotelling_coordinates, confidence_ellipse\n```\n\n```python\ndef load_wine_data():\n \"\"\"Load wine dataset and add cultivar labels\"\"\"\n wine_df = pd.read_csv('data/wine.csv')\n \n # Add cultivar labels based on standard Wine dataset structure\n cultivar = []\n for i in range(len(wine_df)):\n if i < 59:\n cultivar.append('Cultivar 1')\n elif i < 130:\n cultivar.append('Cultivar 2')\n else:\n cultivar.append('Cultivar 3')\n \n wine_df['Cultivar'] = cultivar\n return wine_df\n```\n\n```python\nwine_df = load_wine_data()\nX = wine_df.drop('Cultivar', axis=1)\ny = wine_df['Cultivar']\n\n# Perform PCA\npca = PCA()\nSS = StandardScaler()\nX = SS.fit_transform(X)\npca_scores = pca.fit_transform(X)\nexplained_var = pca.explained_variance_ratio_\n```\n\n```python\nplt.style.use('bmh')\n# Calculate T\u00b2 statistics\nresults = hotelling_parameters(pca_scores, k=2)\nt2 = results['Tsquared'].values\n\n# Generate ellipse coordinates for plotting\nellipse_95 = hotelling_coordinates(pca_scores, pcx=1, pcy=2, conf_limit=0.95)\nellipse_99 = hotelling_coordinates(pca_scores, pcx=1, pcy=2, conf_limit=0.99)\n\n# Plot the PCA scores with Hotelling's T\u00b2 ellipse\nplt.figure(figsize=(8, 6))\nscatter = plt.scatter(\n pca_scores[:, 0], pca_scores[:, 1], \n c=t2, cmap='jet', alpha=0.85, s=70, label='Wine samples'\n )\ncbar = plt.colorbar(scatter)\ncbar.set_label('Hotelling T\u00b2 Statistic', rotation=270, labelpad=20)\n\nplt.plot(ellipse_95['x'], ellipse_95['y'], 'r-', linewidth=1, label='95% Confidence level')\nplt.plot(ellipse_99['x'], ellipse_99['y'], 'k-', linewidth=1, label='99% Confidence level')\nplt.xlim(-1000, 1000)\nplt.ylim(-50, 60)\nplt.xlabel(f'PC1 ({explained_var[0]*100:.2f}%)', fontsize=14, labelpad=10, fontweight='bold')\nplt.ylabel(f'PC2 ({explained_var[1]*100:.2f}%)', fontsize=14, labelpad=10, fontweight='bold')\nplt.title(\"Hotelling's T\u00b2 Ellipse from PCA Scores\", fontsize=16, pad=10, fontweight='bold')\nplt.legend(\n loc='upper left', fontsize=10, frameon=True, framealpha=0.9, \n edgecolor='black', shadow=True, facecolor='white', borderpad=1\n )\nplt.show()\n```\n\n\n\n### Example 2: Grouped Confidence Ellipses\n\n```python\nwine_df['PC1'] = pca_scores[:, 0]\nwine_df['PC2'] = pca_scores[:, 1]\n\ncolors = ['red', 'blue', 'green']\ncultivars = wine_df['Cultivar'].unique()\ncolor_map = {cultivar: color for cultivar, color in zip(cultivars, colors)}\npoint_colors = wine_df['Cultivar'].map(color_map)\n\n# Plott PCA scores with confidence ellipses for each cultivar\nplt.figure(figsize=(8, 6))\n\nfor i, cultivar in enumerate(cultivars):\n mask = wine_df['Cultivar'] == cultivar\n plt.scatter(\n wine_df.loc[mask, 'PC1'], wine_df.loc[mask, 'PC2'], # type: ignore\n c=colors[i], alpha=0.6, s=70, label=cultivar\n ) \n\nellipse_coords = confidence_ellipse(\n data=wine_df,\n x='PC1',\n y='PC2',\n group_by='Cultivar',\n conf_level=0.95,\n robust=True,\n distribution='hotelling'\n)\n\nfor i, cultivar in enumerate(cultivars):\n ellipse_data = ellipse_coords[ellipse_coords['Cultivar'] == cultivar]\n plt.plot(\n ellipse_data['x'], ellipse_data['y'], \n color=colors[i], linewidth=1, linestyle='-', label=f'{cultivar} (95% CI)'\n )\n\nplt.xlim(-1000, 1000)\nplt.ylim(-50, 60)\nplt.xlabel(f'PC1 ({explained_var[0]*100:.2f}%)', fontsize=14, labelpad=10, fontweight='bold')\nplt.ylabel(f'PC2 ({explained_var[1]*100:.2f}%)', fontsize=14, labelpad=10, fontweight='bold')\nplt.title(\"PCA Scores with Cultivar Group Confidence Ellipses\", fontsize=16, pad=10, fontweight='bold')\nplt.legend(\n loc='upper left', fontsize=10, frameon=True, framealpha=0.9, \n edgecolor='black', shadow=True, facecolor='white', borderpad=1\n )\nplt.show()\n```\n\n\n\n### Example 3: Grouped 3D Confidence Ellipsoids\n\n```python\nwine_df['PC1'] = pca_scores[:, 0]\nwine_df['PC2'] = pca_scores[:, 1]\nwine_df['PC3'] = pca_scores[:, 2]\n\ncolors = ['red', 'blue', 'green']\nlight_colors = ['lightcoral', 'lightblue', 'lightgreen']\ncultivars = wine_df['Cultivar'].unique()\n\nellipse_coords = confidence_ellipse(\n data=wine_df,\n x='PC1',\n y='PC2',\n z='PC3',\n group_by='Cultivar',\n conf_level=0.95,\n robust=True,\n distribution='hotelling'\n)\n\nfig = plt.figure(figsize=(10, 6), facecolor='white')\nax = fig.add_subplot(111, projection='3d', facecolor='white')\n\nfor i, cultivar in enumerate(cultivars):\n mask = wine_df['Cultivar'] == cultivar\n ax.scatter(\n wine_df.loc[mask, 'PC1'], \n wine_df.loc[mask, 'PC2'], \n wine_df.loc[mask, 'PC3'], # type: ignore\n c=colors[i], \n alpha=0.8, \n s=50, \n label=cultivar, \n edgecolors='black', \n linewidth=0.5\n )\n \n ellipse_data = ellipse_coords[ellipse_coords['Cultivar'] == cultivar]\n n_points = int(np.sqrt(len(ellipse_data)))\n \n x_2d = ellipse_data['x'].values.reshape(n_points, -1)\n y_2d = ellipse_data['y'].values.reshape(n_points, -1)\n z_2d = ellipse_data['z'].values.reshape(n_points, -1)\n \n ax.plot_surface(\n x_2d, \n y_2d, \n z_2d, \n color=light_colors[i], \n alpha=0.4, \n linewidth=0, \n antialiased=True\n )\n\nax.set_xlabel(f'PC1 ({explained_var[0]*100:.2f}%)', fontsize=12, labelpad=5, fontweight='bold')\nax.set_ylabel(f'PC2 ({explained_var[1]*100:.2f}%)', fontsize=12, labelpad=5, fontweight='bold')\nax.set_zlabel(f'PC3 ({explained_var[2]*100:.2f}%)', fontsize=12, labelpad=1, fontweight='bold')\nax.set_title('3D PCA Scores with 95% Confidence Ellipsoids', fontsize=16, fontweight='bold')\nax.legend(\n loc='upper right', fontsize=10, frameon=True, framealpha=0.9, \n edgecolor='black', shadow=True, facecolor='white', borderpad=1\n )\nax.grid(True, alpha=0.3, color='gray')\nax.view_init(elev=20, azim=65)\nplt.tight_layout()\nplt.show()\n```\n\n\n\n## Key Differences Between Functions\n\n| Feature | `hotelling_parameters` | `hotelling_coordinates` | `confidence_ellipse` |\n|---------|----------------|-----------------|---------------------|\n| __Input__ | Component scores | Component scores | Raw data |\n| __Purpose__ | T\u00b2 statistics | Plot coordinates | Plot coordinates |\n| __Grouping__ | -- | -- | Yes |\n| __Robust__ | -- | -- | Yes |\n| __2D/3D__ | 2D only for ellipse params | Both | Both |\n| __Distribution__ | Hotelling only | Hotelling only | Normal or Hotelling |\n| __Use Case__ | Outlier detection, QC | Visualizing PCA | Exploratory data analysis |\n\n## When to Use Each Function\n\n### Use `hotelling_parameters` when:\n\n- You need T\u00b2 statistics for outlier detection\n- You want confidence cutoff values\n- You're performing quality control or process monitoring\n- You need ellipse parameters (semi-axes lengths)\n\n### Use `hotelling_coordinates` when:\n\n- You have PCA/PLS component scores\n- You want to visualize confidence regions on score plots\n- You need precise control over which components to plot\n- You're creating publication-quality figures from multivariate models\n\n### Use `confidence_ellipse` when:\n\n- You're working with raw data (not scores)\n- You need to compare multiple groups\n- You want robust estimation for outlier-resistant analysis\n- You need flexibility in distribution choice (normal vs Hotelling)\n\n## References\n\n1. Hotelling, H. (1931). The generalization of Student's ratio. *Annals of Mathematical Statistics*, 2(3), 360-378.\n2. Brereton, R. G. (2016). Hotelling's T-squared distribution, its relationship to the F distribution and its use in multivariate space. *Journal of Chemometrics*, 30(1), 18-21.\n3. Raymaekers, J., & Rousseeuw, P. J. (2019). Fast robust correlation for high dimensional data. *Technometrics*, 63(2), 184-198.\n4. Jackson, J. E. (1991). *A User's Guide to Principal Components*. Wiley.\n",
"bugtrack_url": null,
"license": "MIT",
"summary": "Tools for creating and analyzing confidence ellipses, including Hotelling's T-squared ellipses for multivariate statistical analysis and data visualization.",
"version": "0.1.3",
"project_urls": {
"Bug Tracker": "https://github.com/ChristianGoueguel/pyEllipse/issues",
"Documentation": "https://christiangoueguel.github.io/pyEllipse",
"Homepage": "https://github.com/ChristianGoueguel/pyEllipse",
"Repository": "https://github.com/ChristianGoueguel/pyEllipse"
},
"split_keywords": [
"statistics",
" confidence-ellipse",
" hotelling",
" multivariate",
" visualization"
],
"urls": [
{
"comment_text": "",
"digests": {
"blake2b_256": "58a51967237d6b8d5b8b88df080886b13c4ceedab66bab9c64ee5de5a098590a",
"md5": "89d7cc752fff164a8e57375e7866f8e7",
"sha256": "17d9428b9908c6d6fbfa15a72176b4b28564b247a0bce52facfef33d44321d27"
},
"downloads": -1,
"filename": "pyellipse-0.1.3-py3-none-any.whl",
"has_sig": false,
"md5_digest": "89d7cc752fff164a8e57375e7866f8e7",
"packagetype": "bdist_wheel",
"python_version": "py3",
"requires_python": "<3.14,>=3.9",
"size": 12427,
"upload_time": "2025-10-19T02:56:48",
"upload_time_iso_8601": "2025-10-19T02:56:48.430301Z",
"url": "https://files.pythonhosted.org/packages/58/a5/1967237d6b8d5b8b88df080886b13c4ceedab66bab9c64ee5de5a098590a/pyellipse-0.1.3-py3-none-any.whl",
"yanked": false,
"yanked_reason": null
},
{
"comment_text": "",
"digests": {
"blake2b_256": "602a3aef4bc0aeecec019ac1de9d7e3636c3244ab9bfc80fda4f4ec1a4549bc2",
"md5": "5dd9054888f7ded92eaebc82964f0d65",
"sha256": "4a3add0fdd984af31f1f6d8abb6b5c4e0e75eb6f2bbfc607d5bd6d5ccc68508f"
},
"downloads": -1,
"filename": "pyellipse-0.1.3.tar.gz",
"has_sig": false,
"md5_digest": "5dd9054888f7ded92eaebc82964f0d65",
"packagetype": "sdist",
"python_version": "source",
"requires_python": "<3.14,>=3.9",
"size": 13256,
"upload_time": "2025-10-19T02:56:49",
"upload_time_iso_8601": "2025-10-19T02:56:49.657326Z",
"url": "https://files.pythonhosted.org/packages/60/2a/3aef4bc0aeecec019ac1de9d7e3636c3244ab9bfc80fda4f4ec1a4549bc2/pyellipse-0.1.3.tar.gz",
"yanked": false,
"yanked_reason": null
}
],
"upload_time": "2025-10-19 02:56:49",
"github": true,
"gitlab": false,
"bitbucket": false,
"codeberg": false,
"github_user": "ChristianGoueguel",
"github_project": "pyEllipse",
"travis_ci": false,
"coveralls": false,
"github_actions": false,
"lcname": "pyellipse"
}

