[](https://pypi.org/project/pytracecall/)
[](https://pypi.org/project/pytracecall/)
[](https://pypi.org/project/pytracecall/)
[](https://coveralls.io/github/alexsemenyaka/calltracer?branch=main)
[](https://github.com/alexsemenyaka/calltracer/actions/workflows/ci.yml)
A powerful, flexible, and user-friendly debugging module for tracing function calls in Python.
`pytracecall` provides simple yet powerful tools to help you understand your code's execution flow without a full step-by-step debugger. It is designed to integrate seamlessly with Python's standard `logging` module and can produce output for human analysis, IDEs, and automated systems.
---
## Why PyTraceCall?
* **Unmatched Insight, Zero Intrusion**: Get deep insights into your code's execution flow, arguments, return values, and performance without modifying your core logic. The decorator pattern keeps your code clean and readable.
* **Debug Concurrency with Confidence**: Built from the ground up with `contextvars`, `pytracecall` provides clear, isolated traces for complex `asyncio` applications, eliminating the guesswork of concurrent execution flows.
* **From Quick Glance to Deep Analysis**: Whether you need a quick print-style debug, a detailed performance profile with exclusive timings, or structured JSON for automated analysis, the flexible API scales to your needs.
* **Highly Configurable & User-Friendly**: Fine-tune everything from output colors and argument visibility to conditional tracing triggers. The power is in your hands.
* **A Joy to Use**: With features like clickable IDE/terminal integration and beautiful `rich` tree views, debugging stops being a chore and becomes an insightful, and even enjoyable, experience.
---
## Features
- **Synchronous and Asynchronous Tracing**: Decorators for both standard (`def`) and asynchronous (`async def`) functions.
- **Concurrency Safe**: Uses `contextvars` to safely trace concurrent tasks without mixing up call chains.
- **A variety of output options:**
- **Traditional Text Output**: It is default, the old school never dies.
- **IDE & Terminal Integration**: Optionally generates log entries that are clickable in modern IDEs (VSCode, PyCharm) and terminals (with OSC 8 support, like iTerm2), taking you directly to the source code line.
- **Rich Interactive Output**: Optional integration with the `rich` library to render call stacks as beautiful, dynamic trees.
- **Structured JSON Output**: Log trace events as JSON objects for easy parsing, filtering, and analysis by automated systems.
- **Conditional Tracing**: Define custom rules to activate tracing only for specific calls, preventing log spam and focusing on what matters.
- **Argument & Return Value Control**: Mask sensitive data (like passwords), truncate long values, and even hide arguments (like `self`) from the output. Consider to use it with the [filter-url module](https://pypi.org/project/filter-url/) if you are dealing with URLs to avoid sending sensitive information to log files.
- **Builtin Performance Profiling**: Measure execution time with multiple system clocks. Differentiate between **inclusive** time (total) and **exclusive** time (function's own work, excluding children).
- **Runtime Control**: Programmatically enable or disable any tracer instance on the fly.
---
## Installation
You can install the package from PyPI using **`pip`**.
```bash
pip install pytracecall
```
To enable the optional `rich` integration for beautiful tree-like logging, install the `rich` extra:
```bash
pip install "pytracecall[rich]"
```
---
## Usage Examples
### Basic Synchronous Tracing
First, ensure you configure Python's `logging` module to see the output.
```python
import logging
from calltracer import CallTracer
# Configure logging to display DEBUG level messages
logging.basicConfig(
level=logging.DEBUG,
format='%(asctime)s - %(message)s',
datefmt='%H:%M:%S'
)
trace = CallTracer()
@trace
def add(x, y):
return x + y
add(10, 5)
```
**Output:**
```
21:15:10 - --> Calling add(x=10, y=5)
21:15:10 - <-- Exiting add(x=10, y=5), returned: 15
```
### Advanced Features Showcase
The true power of `pytracecall` lies in its rich configuration.
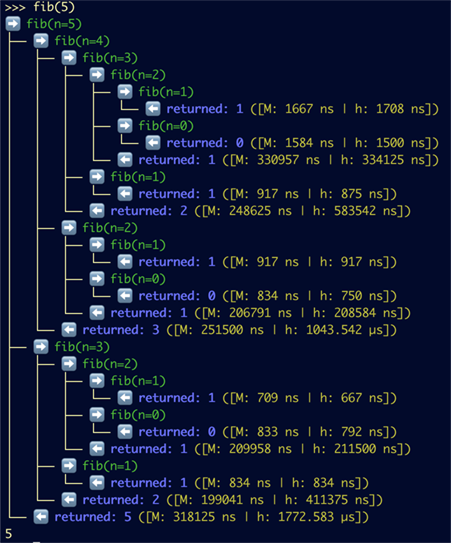
#### Rich Interactive Trees
For the most intuitive visualization, use the `RichPyTraceHandler`.
**Code (`rex.py`):**
```python
import logging
from calltracer import CallTracer, DFMT, RichPyTraceHandler
# 1. Configure a logger to use the Rich handler exclusively
log = logging.getLogger("rich_demo")
log.setLevel(logging.DEBUG)
log.handlers = [RichPyTraceHandler(overwrite=False)] # `overwrite=False` for append-only tree
log.propagate = False
# 2. Configure the tracer to output JSON for the handler to consume
trace = CallTracer(logger=log, output="json", timing="Mh")
@trace
def fib(n):
if n <= 1:
return n
return fib(n-1) + fib(n-2)
fib(5)
```
**Output:**
#### Call Chain Tracing (`trace_chain`)
Set `trace_chain=True` to see the full context for every call.
```python
trace_with_chain = CallTracer(trace_chain=True)
```
**Output:**
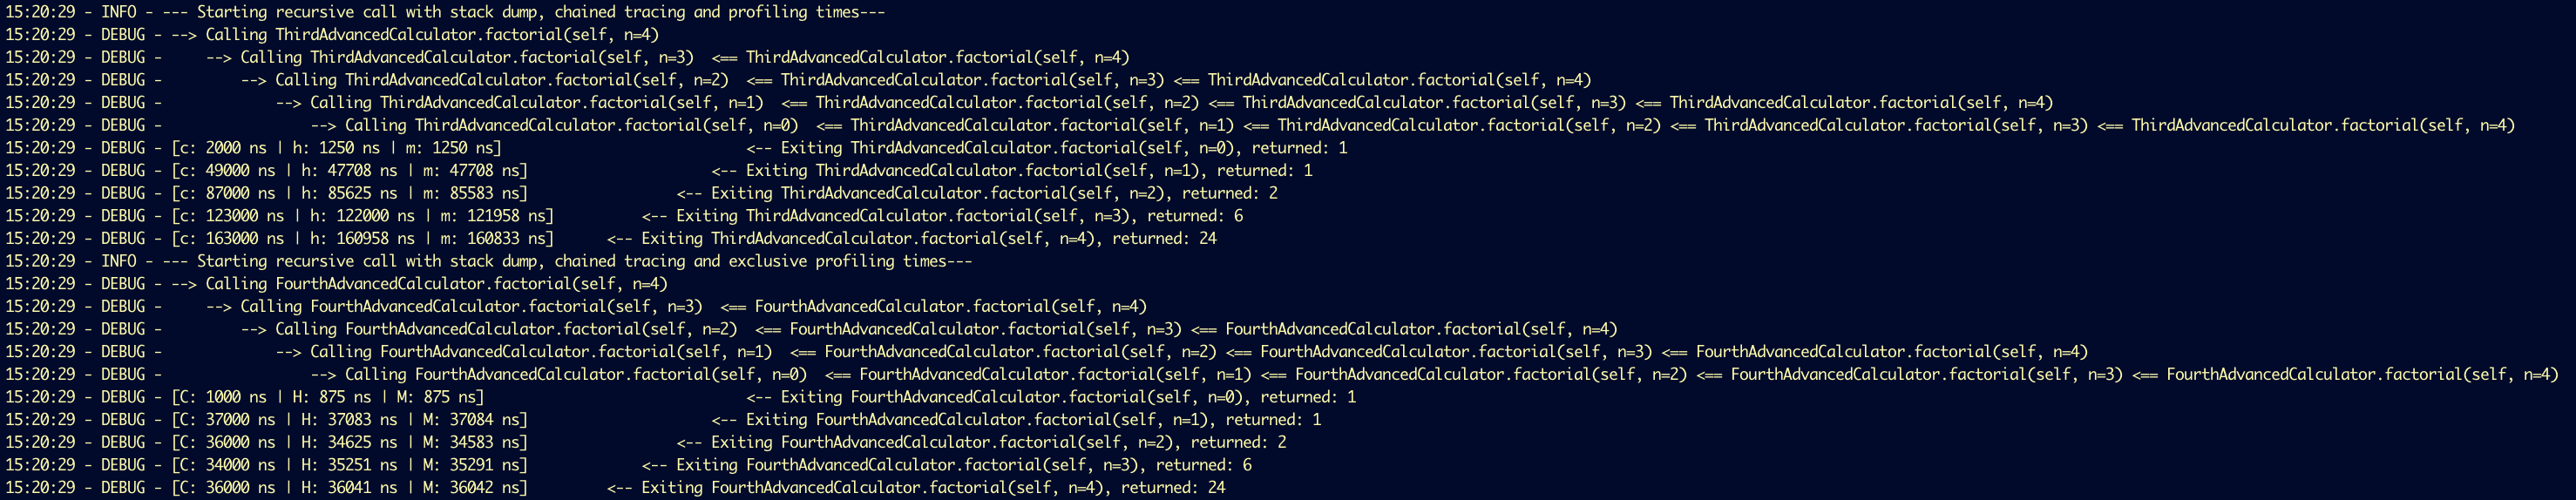
#### Performance Profiling (`timing`)
Measure performance using different clocks. Use **lowercase** for inclusive time and **uppercase** for exclusive time.
**Inclusive** means that the total execution time will be printed, while **exclusive** indicates that the execution
time of the nested functions/methods decorated by the same object will be substraced first (i.e. the execution time of
this only level will be printed). See an example on the screentshot above (in the
[Call Chain Tracing Section](#call-chain-tracing) ).
If you need this feature, set one or more timers in the timing parameter. The following timers are available:
- "m" for `time.monotonic_ns`
- "h" for `time.perf_counter_ns` (high resolution)
- "c" for `time.process_time_ns` (pure CPU time for all threads)
- "t" for `time.thread_time_ns` (CPU time per this thread)
**Example**:
```python
# M: Exclusive monotonic time, h: Inclusive perf_counter time
profile_trace = CallTracer(timing="Mh", timing_fmt=DFMT.SINGLE)
```
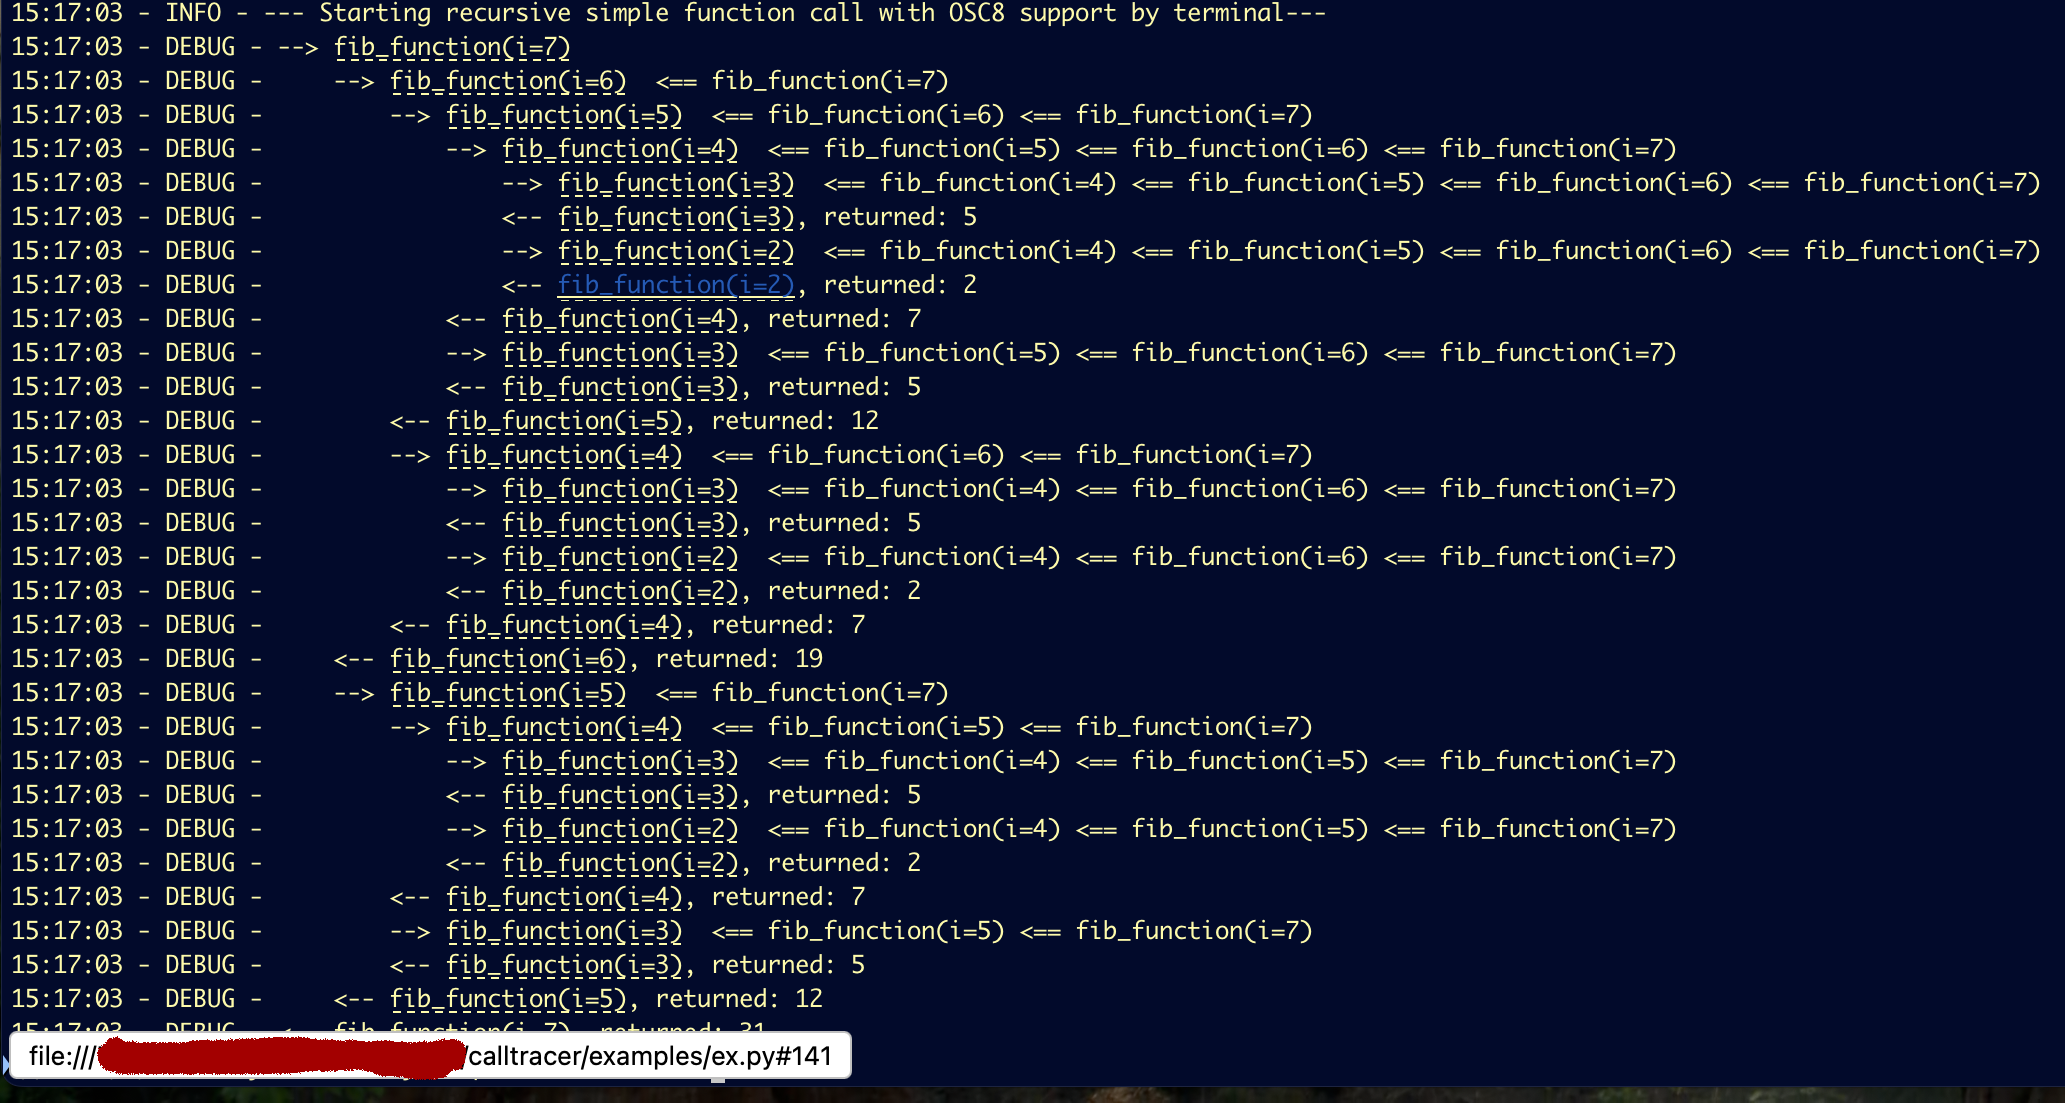
#### IDE & Terminal Integration
Make your logs clickable! `ide_support` creates links for IDEs, while `term_support` uses OSC 8 for modern terminals.
```python
# For clickable links in PyCharm/VSCode
ide_trace = CallTracer(ide_support=True)
# For Ctrl/Cmd-Click in iTerm2 and other modern terminals
term_trace = CallTracer(term_support=True)
```
**Output in iTerm2 (with `term_support=True`):** The function signature becomes a clickable link (check the bottom left corner) that opens the file at the correct line in your editor:
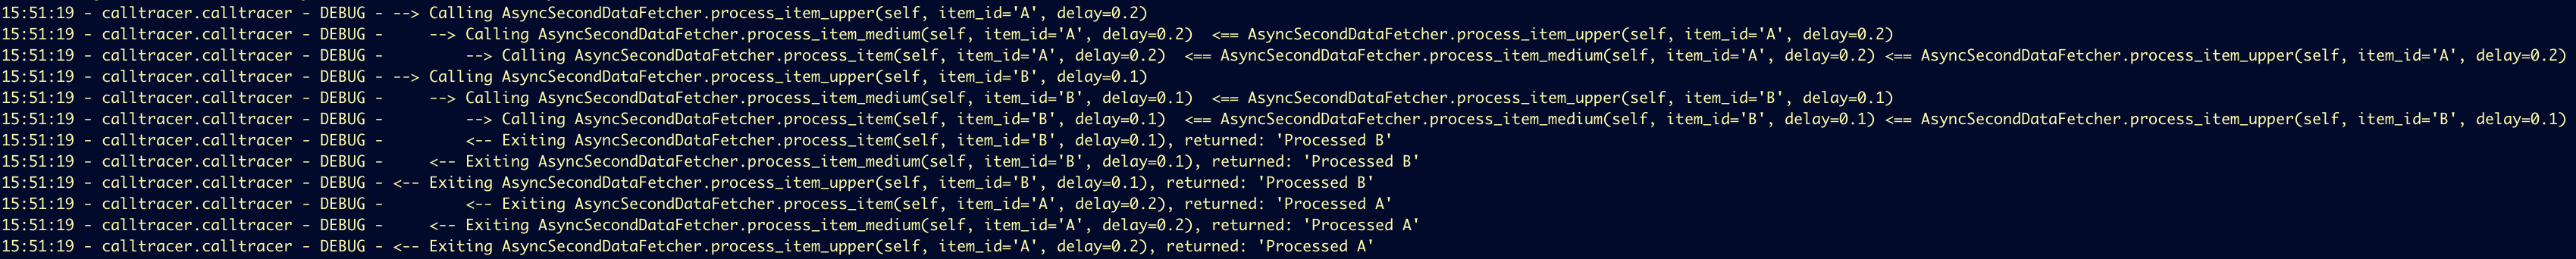
#### Asynchronous Tracing
`aCallTracer` handles `async` functions and concurrency flawlessly, keeping call chains isolated.
**Output:**
---
## Full API Reference
The `CallTracer` and `aCallTracer` classes share the same rich set of initialization parameters, inherited from a base class.
### `CallTracer` / `aCallTracer` Parameters
```python
__init__(self,
level=logging.DEBUG,
trace_chain=False,
logger=None,
transform=None,
max_argval_len=None,
return_transform: Optional[Callable] = None,
max_return_len: Optional[int] = None,
condition: Optional[Callable] = None,
timing: str = None,
timing_fmt: DFMT = DFMT.SINGLE,
output: str = 'text',
ide_support: bool = False,
term_support: bool = False,
rel_path: bool = True)
```
All arguments have default value, i.e. are optional.
- **`level`** (`int`): The logging level for trace messages (check the docs for the `logging` module)
- **`logger`** (`logging.Logger`): A custom logger instance to use
- **`trace_chain`** (`bool`): If `True`, logs the full call chain for each event, showing the sequence of all decorated call preceeding this one
- **`transform`** (`dict`): A dictionary of callbacks to transform/hide argument values. Keys are `(func_qualname, arg_name)` tuples. A wildcard `('*', arg_name)` can be used. Values are callback functions to be called (take an agrument value as an input). If a callback returns `None`, only the argument name is printed.
- **`max_argval_len`** (`int`): Maximum length for the string representation of argument values.
- **`return_transform`** (`Callable`): A function to transform the return value before logging. Takes a return value as an argument.
- **`max_return_len`** (`int`): Maximum length for the string representation of the return value.
- **`condition`** (`Callable`): A function `(func_name, *args, **kwargs) -> bool` that determines if tracing should be active for a call. If it returns `False`, this call and ALL NESTED decorated calls are skipped. Useful
- **`timing`** (`str`): Enables [poor mens'] profiling. A string of characters specifying clocks to use (`m`onotonic, `h`igh-perf, `c`pu, `t`hread). **Lowercase** measures inclusive (total) time. **Uppercase** measures exclusive time (total time minus decorated child calls).
- **`timing_fmt`** (`DFMT`): The display format for timing values (`DFMT.NANO`, `DFMT.MICRO`, `DFMT.SEC`, `DFMT.SINGLE`, `DFMT.HUMAN`):
- `DFMT.NANO`: Plain nanoseconds (e.g., "123 ns")
- `DFMT.MICRO`: Plain microseconds (e.g., "0.123 µs")
- `DFMT.SEC`: Plain seconds (e.g., "0.000000123 s")
- `DFMT.SINGLE`: A "smart" format that uses the single most appropriate unit (ns, µs, s, min, or hr) depending on the magnitude
- `DFMT.HUMAN`: A compound, human-readable format for larger durations (e.g., "5 min, 23.4 s"). For small values (<100ms), it behaves like `SINGLE`
- **`output`** (`str`): The output format. `'text'` (default) for human-readable logs or `'json'` for structured logging
- **`ide_support`** (`bool`): If `True`, formats text logs to be clickable in IDEs (e.g., PyCharm, VSCode)
- **`term_support`** (`bool`): If `True`, formats text logs with OSC 8 hyperlinks for modern terminals. If `ide_support` is set, `term_support` will be ignored.
- **`rel_path`** (`bool`): If `True`, uses relative paths for `ide_support` and `term_support`, othervise uses an absolute one (which might be important for `term_support` on some terminals)
Methods:
- **`enable()` / `disable()`**: Each tracer instance has these methods to control tracing at runtime.
### `RichPyTraceHandler` Parameters
The handler for beautiful `rich` tree output.
```python
__init__(self,
overwrite: bool = False,
color_enter: str = "green",
color_exit: str = "bold blue",
color_exception: str = "bold red",
color_timing: str = "yellow")
```
All arguments have default value, i.e. are optional.
- **`overwrite`** (`bool`): If `False` (default), creates an append-only tree showing both enter and exit events. If `True`, uses a `Live` animated display to overwrite enter nodes with exit information (might be usefult if functions execute a long time, almost senseless for the fast functions)
- **`color_*`** (`str`): Rich markup strings to customize the output colors.
### `stack()` Function
```python
stack(level=logging.DEBUG, logger=None, limit=None, start=0)
```
Logs the current call stack. All arguments have default value, i.e. are optional.
- **`level`** (`int`): The logging level for the stack trace message
- **`logger`** (`logging.Logger`): The logger to use
- **`limit`** (`int`): Maximum number of frames to show, `None` (defaults) means no limit.
- **`start`** (`int`): Frame offset to start from
Raw data
{
"_id": null,
"home_page": null,
"name": "pytracecall",
"maintainer": null,
"docs_url": null,
"requires_python": ">=3.8",
"maintainer_email": null,
"keywords": "debug, debugging, trace, tracer, decorator, logging, stacktrace, callstack, inspect, recursion",
"author": null,
"author_email": "Alex Semenyaka <alex.semenyaka@gmail.com>",
"download_url": "https://files.pythonhosted.org/packages/52/ec/2cd8efb76274ea9eadc76d00c3758d0a56bcdea80b34ffa79e79714c2cf9/pytracecall-4.2.3.tar.gz",
"platform": null,
"description": "[](https://pypi.org/project/pytracecall/)\n[](https://pypi.org/project/pytracecall/)\n[](https://pypi.org/project/pytracecall/)\n[](https://coveralls.io/github/alexsemenyaka/calltracer?branch=main)\n[](https://github.com/alexsemenyaka/calltracer/actions/workflows/ci.yml)\n\nA powerful, flexible, and user-friendly debugging module for tracing function calls in Python.\n\n`pytracecall` provides simple yet powerful tools to help you understand your code's execution flow without a full step-by-step debugger. It is designed to integrate seamlessly with Python's standard `logging` module and can produce output for human analysis, IDEs, and automated systems.\n\n---\n\n## Why PyTraceCall?\n\n* **Unmatched Insight, Zero Intrusion**: Get deep insights into your code's execution flow, arguments, return values, and performance without modifying your core logic. The decorator pattern keeps your code clean and readable.\n* **Debug Concurrency with Confidence**: Built from the ground up with `contextvars`, `pytracecall` provides clear, isolated traces for complex `asyncio` applications, eliminating the guesswork of concurrent execution flows.\n* **From Quick Glance to Deep Analysis**: Whether you need a quick print-style debug, a detailed performance profile with exclusive timings, or structured JSON for automated analysis, the flexible API scales to your needs.\n* **Highly Configurable & User-Friendly**: Fine-tune everything from output colors and argument visibility to conditional tracing triggers. The power is in your hands.\n* **A Joy to Use**: With features like clickable IDE/terminal integration and beautiful `rich` tree views, debugging stops being a chore and becomes an insightful, and even enjoyable, experience.\n\n---\n\n## Features\n\n- **Synchronous and Asynchronous Tracing**: Decorators for both standard (`def`) and asynchronous (`async def`) functions.\n- **Concurrency Safe**: Uses `contextvars` to safely trace concurrent tasks without mixing up call chains.\n- **A variety of output options:**\n\n - **Traditional Text Output**: It is default, the old school never dies.\n - **IDE & Terminal Integration**: Optionally generates log entries that are clickable in modern IDEs (VSCode, PyCharm) and terminals (with OSC 8 support, like iTerm2), taking you directly to the source code line.\n - **Rich Interactive Output**: Optional integration with the `rich` library to render call stacks as beautiful, dynamic trees.\n - **Structured JSON Output**: Log trace events as JSON objects for easy parsing, filtering, and analysis by automated systems.\n- **Conditional Tracing**: Define custom rules to activate tracing only for specific calls, preventing log spam and focusing on what matters.\n- **Argument & Return Value Control**: Mask sensitive data (like passwords), truncate long values, and even hide arguments (like `self`) from the output. Consider to use it with the [filter-url module](https://pypi.org/project/filter-url/) if you are dealing with URLs to avoid sending sensitive information to log files.\n- **Builtin Performance Profiling**: Measure execution time with multiple system clocks. Differentiate between **inclusive** time (total) and **exclusive** time (function's own work, excluding children).\n- **Runtime Control**: Programmatically enable or disable any tracer instance on the fly.\n\n---\n\n## Installation\n\nYou can install the package from PyPI using **`pip`**.\n\n```bash\npip install pytracecall\n```\n\nTo enable the optional `rich` integration for beautiful tree-like logging, install the `rich` extra:\n\n```bash\npip install \"pytracecall[rich]\"\n```\n\n---\n\n## Usage Examples\n\n### Basic Synchronous Tracing\n\nFirst, ensure you configure Python's `logging` module to see the output.\n\n```python\nimport logging\nfrom calltracer import CallTracer\n\n# Configure logging to display DEBUG level messages\nlogging.basicConfig(\n level=logging.DEBUG,\n format='%(asctime)s - %(message)s',\n datefmt='%H:%M:%S'\n)\n\ntrace = CallTracer()\n\n@trace\ndef add(x, y):\n return x + y\n\nadd(10, 5)\n```\n\n**Output:**\n```\n21:15:10 - --> Calling add(x=10, y=5)\n21:15:10 - <-- Exiting add(x=10, y=5), returned: 15\n```\n\n### Advanced Features Showcase\n\nThe true power of `pytracecall` lies in its rich configuration.\n\n#### Rich Interactive Trees\n\nFor the most intuitive visualization, use the `RichPyTraceHandler`.\n\n**Code (`rex.py`):**\n```python\nimport logging\nfrom calltracer import CallTracer, DFMT, RichPyTraceHandler\n\n# 1. Configure a logger to use the Rich handler exclusively\nlog = logging.getLogger(\"rich_demo\")\nlog.setLevel(logging.DEBUG)\nlog.handlers = [RichPyTraceHandler(overwrite=False)] # `overwrite=False` for append-only tree\nlog.propagate = False\n\n# 2. Configure the tracer to output JSON for the handler to consume\ntrace = CallTracer(logger=log, output=\"json\", timing=\"Mh\")\n\n@trace\ndef fib(n):\n if n <= 1:\n return n\n return fib(n-1) + fib(n-2)\n\nfib(5)\n```\n\n**Output:**\n\n\n\n#### Call Chain Tracing (`trace_chain`)\n\nSet `trace_chain=True` to see the full context for every call.\n\n```python\ntrace_with_chain = CallTracer(trace_chain=True)\n```\n\n**Output:**\n\n\n\n#### Performance Profiling (`timing`)\n\nMeasure performance using different clocks. Use **lowercase** for inclusive time and **uppercase** for exclusive time.\n**Inclusive** means that the total execution time will be printed, while **exclusive** indicates that the execution\ntime of the nested functions/methods decorated by the same object will be substraced first (i.e. the execution time of\nthis only level will be printed). See an example on the screentshot above (in the\n[Call Chain Tracing Section](#call-chain-tracing) ).\n\nIf you need this feature, set one or more timers in the timing parameter. The following timers are available:\n- \"m\" for `time.monotonic_ns`\n- \"h\" for `time.perf_counter_ns` (high resolution)\n- \"c\" for `time.process_time_ns` (pure CPU time for all threads)\n- \"t\" for `time.thread_time_ns` (CPU time per this thread)\n\n**Example**:\n\n```python\n# M: Exclusive monotonic time, h: Inclusive perf_counter time\nprofile_trace = CallTracer(timing=\"Mh\", timing_fmt=DFMT.SINGLE)\n```\n\n#### IDE & Terminal Integration\n\nMake your logs clickable! `ide_support` creates links for IDEs, while `term_support` uses OSC 8 for modern terminals.\n\n```python\n# For clickable links in PyCharm/VSCode\nide_trace = CallTracer(ide_support=True)\n\n# For Ctrl/Cmd-Click in iTerm2 and other modern terminals\nterm_trace = CallTracer(term_support=True)\n```\n\n**Output in iTerm2 (with `term_support=True`):** The function signature becomes a clickable link (check the bottom left corner) that opens the file at the correct line in your editor:\n\n\n#### Asynchronous Tracing\n\n`aCallTracer` handles `async` functions and concurrency flawlessly, keeping call chains isolated.\n\n**Output:**\n\n\n\n---\n\n## Full API Reference\n\nThe `CallTracer` and `aCallTracer` classes share the same rich set of initialization parameters, inherited from a base class.\n\n### `CallTracer` / `aCallTracer` Parameters\n\n```python\n__init__(self,\n level=logging.DEBUG,\n trace_chain=False,\n logger=None,\n transform=None,\n max_argval_len=None,\n return_transform: Optional[Callable] = None,\n max_return_len: Optional[int] = None,\n condition: Optional[Callable] = None,\n timing: str = None,\n timing_fmt: DFMT = DFMT.SINGLE,\n output: str = 'text',\n ide_support: bool = False,\n term_support: bool = False,\n rel_path: bool = True)\n```\n\nAll arguments have default value, i.e. are optional.\n\n- **`level`** (`int`): The logging level for trace messages (check the docs for the `logging` module)\n- **`logger`** (`logging.Logger`): A custom logger instance to use\n- **`trace_chain`** (`bool`): If `True`, logs the full call chain for each event, showing the sequence of all decorated call preceeding this one\n- **`transform`** (`dict`): A dictionary of callbacks to transform/hide argument values. Keys are `(func_qualname, arg_name)` tuples. A wildcard `('*', arg_name)` can be used. Values are callback functions to be called (take an agrument value as an input). If a callback returns `None`, only the argument name is printed.\n- **`max_argval_len`** (`int`): Maximum length for the string representation of argument values.\n- **`return_transform`** (`Callable`): A function to transform the return value before logging. Takes a return value as an argument.\n- **`max_return_len`** (`int`): Maximum length for the string representation of the return value.\n- **`condition`** (`Callable`): A function `(func_name, *args, **kwargs) -> bool` that determines if tracing should be active for a call. If it returns `False`, this call and ALL NESTED decorated calls are skipped. Useful\n- **`timing`** (`str`): Enables [poor mens'] profiling. A string of characters specifying clocks to use (`m`onotonic, `h`igh-perf, `c`pu, `t`hread). **Lowercase** measures inclusive (total) time. **Uppercase** measures exclusive time (total time minus decorated child calls).\n- **`timing_fmt`** (`DFMT`): The display format for timing values (`DFMT.NANO`, `DFMT.MICRO`, `DFMT.SEC`, `DFMT.SINGLE`, `DFMT.HUMAN`):\n\n - `DFMT.NANO`: Plain nanoseconds (e.g., \"123 ns\")\n - `DFMT.MICRO`: Plain microseconds (e.g., \"0.123 \u00b5s\")\n - `DFMT.SEC`: Plain seconds (e.g., \"0.000000123 s\")\n - `DFMT.SINGLE`: A \"smart\" format that uses the single most appropriate unit (ns, \u00b5s, s, min, or hr) depending on the magnitude\n - `DFMT.HUMAN`: A compound, human-readable format for larger durations (e.g., \"5 min, 23.4 s\"). For small values (<100ms), it behaves like `SINGLE`\n- **`output`** (`str`): The output format. `'text'` (default) for human-readable logs or `'json'` for structured logging\n- **`ide_support`** (`bool`): If `True`, formats text logs to be clickable in IDEs (e.g., PyCharm, VSCode)\n- **`term_support`** (`bool`): If `True`, formats text logs with OSC 8 hyperlinks for modern terminals. If `ide_support` is set, `term_support` will be ignored.\n- **`rel_path`** (`bool`): If `True`, uses relative paths for `ide_support` and `term_support`, othervise uses an absolute one (which might be important for `term_support` on some terminals)\n\nMethods:\n- **`enable()` / `disable()`**: Each tracer instance has these methods to control tracing at runtime.\n\n### `RichPyTraceHandler` Parameters\n\nThe handler for beautiful `rich` tree output.\n\n```python\n__init__(self,\n overwrite: bool = False,\n color_enter: str = \"green\",\n color_exit: str = \"bold blue\",\n color_exception: str = \"bold red\",\n color_timing: str = \"yellow\")\n```\n\nAll arguments have default value, i.e. are optional.\n\n- **`overwrite`** (`bool`): If `False` (default), creates an append-only tree showing both enter and exit events. If `True`, uses a `Live` animated display to overwrite enter nodes with exit information (might be usefult if functions execute a long time, almost senseless for the fast functions)\n- **`color_*`** (`str`): Rich markup strings to customize the output colors.\n\n### `stack()` Function\n\n```python\nstack(level=logging.DEBUG, logger=None, limit=None, start=0)\n```\nLogs the current call stack. All arguments have default value, i.e. are optional.\n\n\n- **`level`** (`int`): The logging level for the stack trace message\n- **`logger`** (`logging.Logger`): The logger to use\n- **`limit`** (`int`): Maximum number of frames to show, `None` (defaults) means no limit.\n- **`start`** (`int`): Frame offset to start from\n",
"bugtrack_url": null,
"license": "MIT",
"summary": "pytracecall: A debugging module with sync and async decorators (CallTracer and aCallTracer) for tracing function calls, and a function (stack) for logging the current call stack",
"version": "4.2.3",
"project_urls": {
"Homepage": "https://github.com/alexsemenyaka/calltracer",
"Issues": "https://github.com/alexsemenyaka/calltracer/issues",
"Repository": "https://github.com/alexsemenyaka/calltracer.git"
},
"split_keywords": [
"debug",
" debugging",
" trace",
" tracer",
" decorator",
" logging",
" stacktrace",
" callstack",
" inspect",
" recursion"
],
"urls": [
{
"comment_text": null,
"digests": {
"blake2b_256": "de5fdc23e8ff06644e94601946b9263affbd5ac703e2ececc042ef576468b31f",
"md5": "c678d6045ce0472e51e37333228dfdff",
"sha256": "2374ff41c5c4541fe5629950953688a088077714d76ea59aba88cbaba88437d8"
},
"downloads": -1,
"filename": "pytracecall-4.2.3-py3-none-any.whl",
"has_sig": false,
"md5_digest": "c678d6045ce0472e51e37333228dfdff",
"packagetype": "bdist_wheel",
"python_version": "py3",
"requires_python": ">=3.8",
"size": 25727,
"upload_time": "2025-08-07T15:52:18",
"upload_time_iso_8601": "2025-08-07T15:52:18.304409Z",
"url": "https://files.pythonhosted.org/packages/de/5f/dc23e8ff06644e94601946b9263affbd5ac703e2ececc042ef576468b31f/pytracecall-4.2.3-py3-none-any.whl",
"yanked": false,
"yanked_reason": null
},
{
"comment_text": null,
"digests": {
"blake2b_256": "52ec2cd8efb76274ea9eadc76d00c3758d0a56bcdea80b34ffa79e79714c2cf9",
"md5": "e15326c83ce3c9600a82f7ba286cb03a",
"sha256": "027aca2695d550119ab253f91414da1842c3d7aa3e7b9b822b12758adf110600"
},
"downloads": -1,
"filename": "pytracecall-4.2.3.tar.gz",
"has_sig": false,
"md5_digest": "e15326c83ce3c9600a82f7ba286cb03a",
"packagetype": "sdist",
"python_version": "source",
"requires_python": ">=3.8",
"size": 26910,
"upload_time": "2025-08-07T15:52:19",
"upload_time_iso_8601": "2025-08-07T15:52:19.642483Z",
"url": "https://files.pythonhosted.org/packages/52/ec/2cd8efb76274ea9eadc76d00c3758d0a56bcdea80b34ffa79e79714c2cf9/pytracecall-4.2.3.tar.gz",
"yanked": false,
"yanked_reason": null
}
],
"upload_time": "2025-08-07 15:52:19",
"github": true,
"gitlab": false,
"bitbucket": false,
"codeberg": false,
"github_user": "alexsemenyaka",
"github_project": "calltracer",
"travis_ci": false,
"coveralls": true,
"github_actions": true,
"requirements": [
{
"name": "iniconfig",
"specs": [
[
"==",
"2.1.0"
]
]
},
{
"name": "markdown-it-py",
"specs": [
[
"==",
"3.0.0"
]
]
},
{
"name": "mdurl",
"specs": [
[
"==",
"0.1.2"
]
]
},
{
"name": "packaging",
"specs": [
[
"==",
"25.0"
]
]
},
{
"name": "pluggy",
"specs": [
[
"==",
"1.6.0"
]
]
},
{
"name": "pygments",
"specs": [
[
"==",
"2.19.2"
]
]
},
{
"name": "pyte",
"specs": [
[
"==",
"0.8.2"
]
]
},
{
"name": "pytest",
"specs": [
[
"==",
"8.4.1"
]
]
},
{
"name": "rich",
"specs": [
[
"==",
"14.1.0"
]
]
},
{
"name": "wcwidth",
"specs": [
[
"==",
"0.2.13"
]
]
}
],
"lcname": "pytracecall"
}


