| Name | qgate-graph JSON |
| Version |
1.4.30
 JSON
JSON |
| download |
| home_page | None |
| Summary | Generate graphs based on outputs from Quality Gate |
| upload_time | 2024-12-04 11:28:16 |
| maintainer | None |
| docs_url | None |
| author | None |
| requires_python | >=3.6 |
| license | MIT |
| keywords |
quality
qualitygate
graph
|
| VCS |
 |
| bugtrack_url |
|
| requirements |
No requirements were recorded.
|
| Travis-CI |
No Travis.
|
| coveralls test coverage |

|
[](https://opensource.org/licenses/Apache-2.0)
[](https://pypi.python.org/pypi/qgate-graph/)


# QGate-Graph
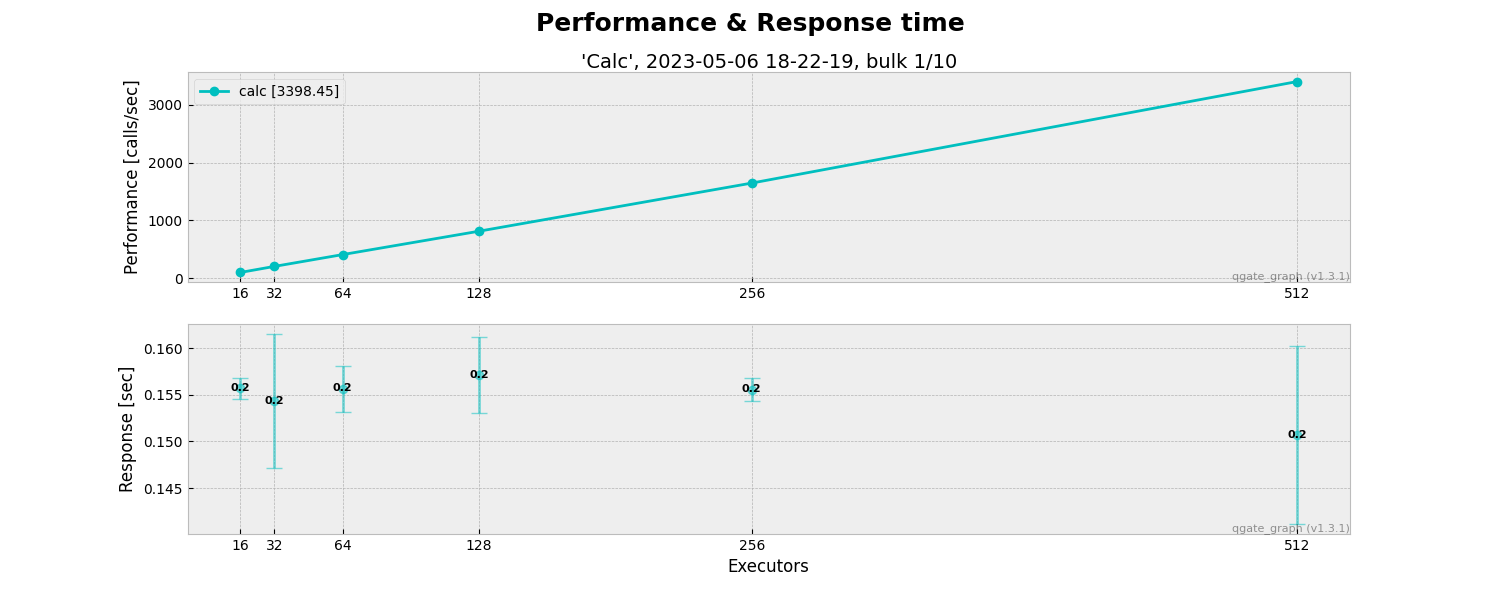
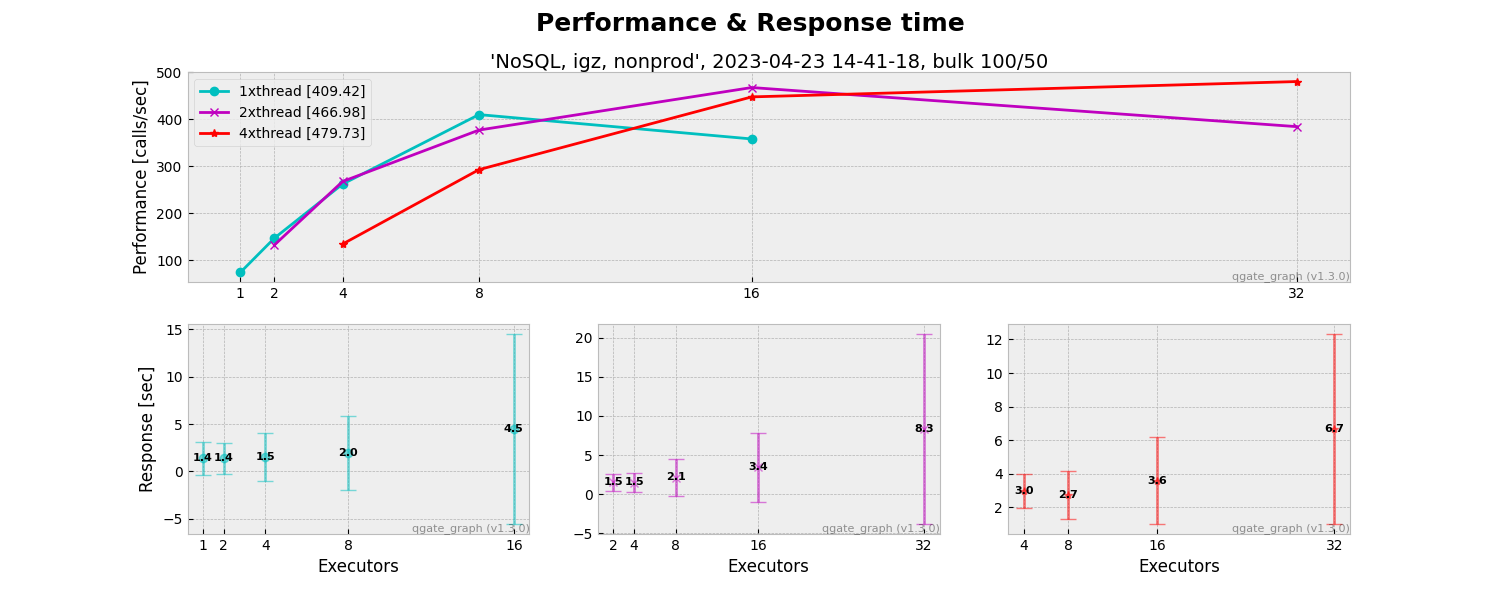
The QGate graph generates graphical outputs based on performance tests (QGate Perf). Key benefits:
- provide graphs about Performance/Throughput and Response time (on typically client side)
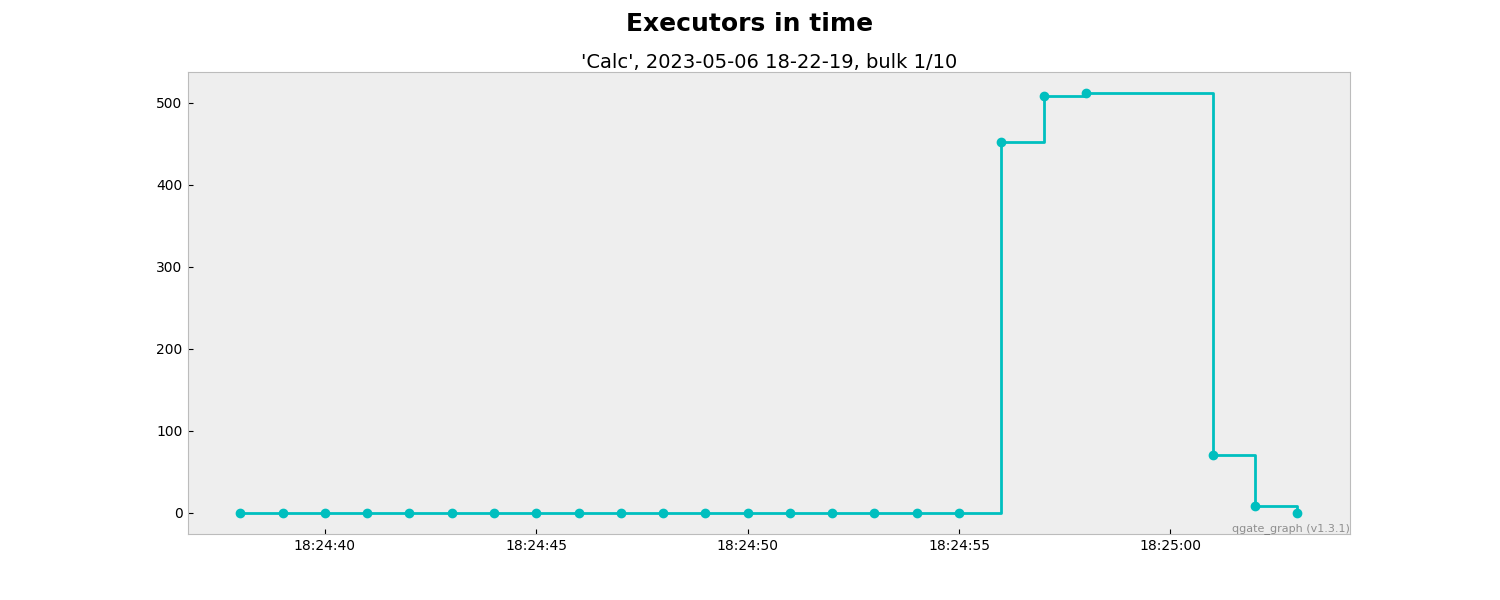
- provide graphs about Executors in time
It is a quick way, how you can identify real performance for your python solution.
NOTE: These graphs only visualize outputs from performance tests (QGate Perf), it is not replacement of
detail views from Grafana, Prometheus, etc. in detail of CPU, GPU, RAM, I/O etc. on
side of testing system.
## Usage
```python
from qgate_graph.graph_performance_txt import GraphPerformanceTxt
from qgate_graph.graph_performance_csv import GraphPerformanceCsv
from qgate_graph.graph_performance import GraphPerformance
from qgate_graph.graph_executor import GraphExecutor
import logging
# setup login level
logging.basicConfig()
logging.getLogger().setLevel(logging.INFO)
# generate performance/throughput graphs
graph=GraphPerformance()
graph.generate_from_dir()
# generate executors in time graphs
graph=GraphExecutor()
graph.generate_from_dir()
# generate performance/throughput graphs in TXT form
graph=GraphPerformanceTxt()
graph.generate_from_dir()
# generate performance/throughput graphs in CSV form
graph=GraphPerformanceCsv()
graph.generate_from_dir()
```
## Sample of outputs
#### Performance/Throughput & Response time
#### Executors in time

#### Performance/Throughput & Response time in [TXT form](https://github.com/george0st/qgate-graph/blob/main/assets/TXT-cassandra-163551-W1-low-RAW-2024-10-11_14-36-07-bulk-200x10.txt?raw=true)

#### Performance/Throughput & Response time in [CSV form](https://github.com/george0st/qgate-graph/blob/main/assets/CSV-cassandra-235115-W2-med-RAW-2024-10-11_22-14-47-bulk-200x20.csv?raw=true)

Raw data
{
"_id": null,
"home_page": null,
"name": "qgate-graph",
"maintainer": null,
"docs_url": null,
"requires_python": ">=3.6",
"maintainer_email": "Jiri Steuer <steuer.jiri@gmail.com>",
"keywords": "Quality, QualityGate, Graph",
"author": null,
"author_email": "Jiri Steuer <steuer.jiri@gmail.com>",
"download_url": null,
"platform": null,
"description": "[](https://opensource.org/licenses/Apache-2.0)\r\n[](https://pypi.python.org/pypi/qgate-graph/)\r\n\r\n\r\n\r\n\r\n# QGate-Graph\r\n\r\nThe QGate graph generates graphical outputs based on performance tests (QGate Perf). Key benefits:\r\n - provide graphs about Performance/Throughput and Response time (on typically client side)\r\n - provide graphs about Executors in time\r\n\r\nIt is a quick way, how you can identify real performance for your python solution.\r\n\r\nNOTE: These graphs only visualize outputs from performance tests (QGate Perf), it is not replacement of\r\ndetail views from Grafana, Prometheus, etc. in detail of CPU, GPU, RAM, I/O etc. on \r\nside of testing system. \r\n\r\n## Usage\r\n\r\n```python\r\nfrom qgate_graph.graph_performance_txt import GraphPerformanceTxt\r\nfrom qgate_graph.graph_performance_csv import GraphPerformanceCsv\r\nfrom qgate_graph.graph_performance import GraphPerformance\r\nfrom qgate_graph.graph_executor import GraphExecutor\r\nimport logging\r\n\r\n# setup login level\r\nlogging.basicConfig()\r\nlogging.getLogger().setLevel(logging.INFO)\r\n\r\n# generate performance/throughput graphs\r\ngraph=GraphPerformance()\r\ngraph.generate_from_dir()\r\n\r\n# generate executors in time graphs\r\ngraph=GraphExecutor()\r\ngraph.generate_from_dir()\r\n\r\n# generate performance/throughput graphs in TXT form\r\ngraph=GraphPerformanceTxt()\r\ngraph.generate_from_dir()\r\n\r\n# generate performance/throughput graphs in CSV form\r\ngraph=GraphPerformanceCsv()\r\ngraph.generate_from_dir()\r\n```\r\n\r\n## Sample of outputs\r\n#### Performance/Throughput & Response time\r\n\r\n\r\n\r\n#### Executors in time\r\n\r\n\r\n\r\n#### Performance/Throughput & Response time in [TXT form](https://github.com/george0st/qgate-graph/blob/main/assets/TXT-cassandra-163551-W1-low-RAW-2024-10-11_14-36-07-bulk-200x10.txt?raw=true)\r\n\r\n\r\n#### Performance/Throughput & Response time in [CSV form](https://github.com/george0st/qgate-graph/blob/main/assets/CSV-cassandra-235115-W2-med-RAW-2024-10-11_22-14-47-bulk-200x20.csv?raw=true)\r\n\r\n",
"bugtrack_url": null,
"license": "MIT",
"summary": "Generate graphs based on outputs from Quality Gate",
"version": "1.4.30",
"project_urls": {
"homepage": "https://github.com/george0st/qgate-graph/",
"repository": "https://pypi.org/project/qgate_graph/"
},
"split_keywords": [
"quality",
" qualitygate",
" graph"
],
"urls": [
{
"comment_text": "",
"digests": {
"blake2b_256": "3e0fdd2948de788d26a898a70d0c2cf308acec8f9bd2b57ab6c5b2347683def2",
"md5": "8fc9c97221a94b5d74808ae8147eaac1",
"sha256": "26a80a727955809de5b1f39cce1cd472e3dd42fcc97765e10d909beca8591968"
},
"downloads": -1,
"filename": "qgate_graph-1.4.30-py3-none-any.whl",
"has_sig": false,
"md5_digest": "8fc9c97221a94b5d74808ae8147eaac1",
"packagetype": "bdist_wheel",
"python_version": "py3",
"requires_python": ">=3.6",
"size": 19736,
"upload_time": "2024-12-04T11:28:16",
"upload_time_iso_8601": "2024-12-04T11:28:16.003625Z",
"url": "https://files.pythonhosted.org/packages/3e/0f/dd2948de788d26a898a70d0c2cf308acec8f9bd2b57ab6c5b2347683def2/qgate_graph-1.4.30-py3-none-any.whl",
"yanked": false,
"yanked_reason": null
}
],
"upload_time": "2024-12-04 11:28:16",
"github": true,
"gitlab": false,
"bitbucket": false,
"codeberg": false,
"github_user": "george0st",
"github_project": "qgate-graph",
"travis_ci": false,
"coveralls": true,
"github_actions": false,
"requirements": [],
"lcname": "qgate-graph"
}
