## reactpy-apexcharts
<p align="center"><img src="https://apexcharts.com/media/apexcharts-banner.png"></p>
Minimal [ReactPy](https://reactpy.dev/docs/index.html) wrapper for
the [react-apexcharts](https://github.com/apexcharts/react-apexcharts) library (v 1.4.1).
## Usage
pip install reactpy-apexcharts
## Documentation
Configuration options can be found [here](https://apexcharts.com/docs/react-charts/)
### Simple Barchart Example
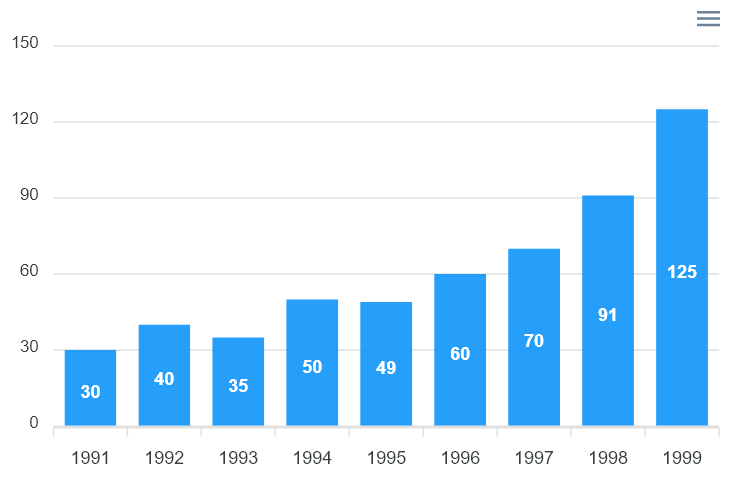
*./examples/barchart_example.py*
```
from reactpy import component, html, run
from reactpy_apexcharts import ApexChart
@component
def AppMain():
return html.div(
ApexChart(
options = {
'chart': {'id': 'apex-chart-example'},
'xaxis': {
'categories': [1991, 1992, 1993, 1994, 1995, 1996, 1997, 1998, 1999]}
},
series = [{
'name': 'series-1',
'data': [30, 40, 35, 50, 49, 60, 70, 91, 125]
}],
chart_type = "bar",
width=500,
height=320
)
)
# python -m examples.chart_example
if __name__ == "__main__":
run(AppMain)
```
### More complex area chart
[syncing_chart.py](examples/syncing_chart.py), is a more complex example showing how to control color, grids and
format X & Y axis labels.
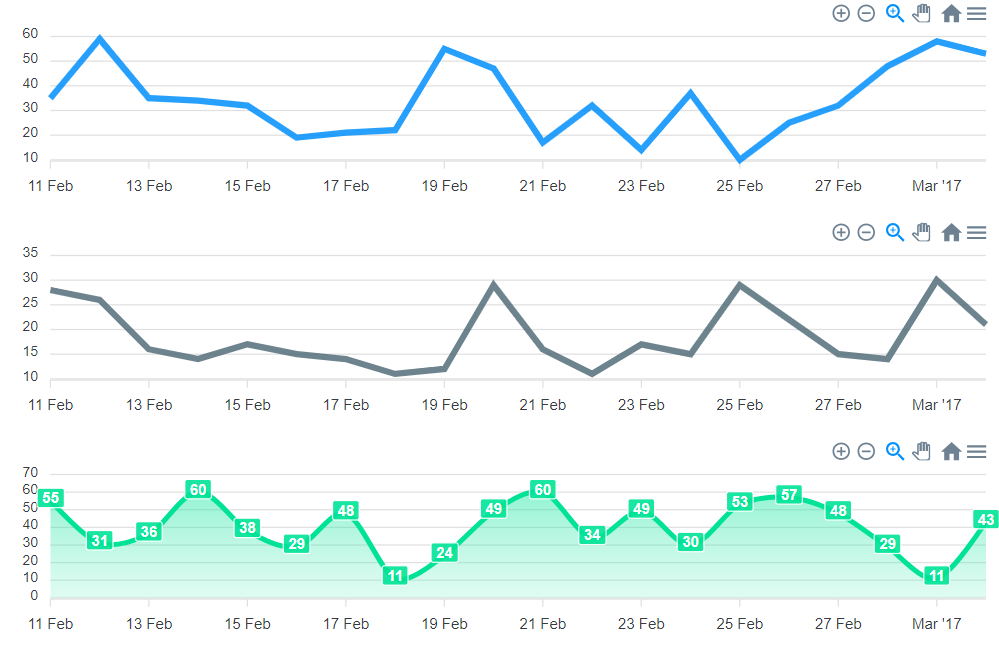
*./examples/syncing_chart.py*
```
from reactpy import component, html, run
from reactpy_apexcharts import ApexChart
DATE = dt(2017, 2, 11)
options = {
"series": [{"data": time_series(DATE, 20, {"min": 10, "max": 60})}],
"chart": {"id": "fb", "group": "social", "type": "line", "height": 160},
"xaxis": {'type': 'datetime'},
"colors": ["#008FFB"],
}
optionsLine2 = {
"series": [{"data": time_series(DATE, 20, {"min": 10, "max": 30})}],
"chart": {"id": "tw", "group": "social", "type": "line", "height": 160},
"xaxis": {'type': 'datetime'},
"colors": ["#546E7A"],
}
optionsArea = {
"series": [{"data": time_series(DATE, 20, {"min": 10, "max": 60})}],
"chart": {"id": "yt","group": "social","type": "area","height": 160},
"xaxis": {'type': 'datetime'},
"colors": ["#00E396"]
}
@component
def CustomChart(options):
return html.div({'style': {'min-height': '175px'}},
ApexChart(options=options),
)
@component
def AppMain():
return html.div(
CustomChart(options=options),
CustomChart(options=optionsLine2),
CustomChart(options=optionsArea),
)
# python -m examples.syncing_chart
if __name__ == "__main__":
run(AppMain)
```
Raw data
{
"_id": null,
"home_page": "https://github.com/stevej2608/reactpy-apexcharts",
"name": "reactpy-apexcharts",
"maintainer": null,
"docs_url": null,
"requires_python": "<4.0.0,>=3.9",
"maintainer_email": null,
"keywords": null,
"author": "Steve Jones",
"author_email": "jonesst2608@gmail.com",
"download_url": "https://files.pythonhosted.org/packages/6e/66/f2778206e9f31c179afa30bc3ba1cec679a2d389d66bbcb49083b41623b5/reactpy_apexcharts-0.0.12.tar.gz",
"platform": null,
"description": "## reactpy-apexcharts\n\n<p align=\"center\"><img src=\"https://apexcharts.com/media/apexcharts-banner.png\"></p>\n\n\n Minimal [ReactPy](https://reactpy.dev/docs/index.html) wrapper for \n the [react-apexcharts](https://github.com/apexcharts/react-apexcharts) library (v 1.4.1).\n\n## Usage\n\n pip install reactpy-apexcharts\n\n## Documentation\n\nConfiguration options can be found [here](https://apexcharts.com/docs/react-charts/)\n\n### Simple Barchart Example\n\n\n\n*./examples/barchart_example.py*\n```\nfrom reactpy import component, html, run\nfrom reactpy_apexcharts import ApexChart\n\n@component\ndef AppMain():\n\n return html.div(\n\n ApexChart(\n options = {\n 'chart': {'id': 'apex-chart-example'},\n 'xaxis': {\n 'categories': [1991, 1992, 1993, 1994, 1995, 1996, 1997, 1998, 1999]}\n },\n\n series = [{\n 'name': 'series-1',\n 'data': [30, 40, 35, 50, 49, 60, 70, 91, 125]\n }],\n\n chart_type = \"bar\",\n width=500,\n height=320\n )\n )\n\n# python -m examples.chart_example\n\nif __name__ == \"__main__\":\n run(AppMain)\n```\n\n### More complex area chart\n\n[syncing_chart.py](examples/syncing_chart.py), is a more complex example showing how to control color, grids and\nformat X & Y axis labels.\n\n\n\n*./examples/syncing_chart.py*\n```\nfrom reactpy import component, html, run\nfrom reactpy_apexcharts import ApexChart\n\nDATE = dt(2017, 2, 11)\n\noptions = {\n \"series\": [{\"data\": time_series(DATE, 20, {\"min\": 10, \"max\": 60})}],\n \"chart\": {\"id\": \"fb\", \"group\": \"social\", \"type\": \"line\", \"height\": 160},\n \"xaxis\": {'type': 'datetime'},\n \"colors\": [\"#008FFB\"],\n}\n\noptionsLine2 = {\n \"series\": [{\"data\": time_series(DATE, 20, {\"min\": 10, \"max\": 30})}],\n \"chart\": {\"id\": \"tw\", \"group\": \"social\", \"type\": \"line\", \"height\": 160},\n \"xaxis\": {'type': 'datetime'},\n \"colors\": [\"#546E7A\"],\n}\n\noptionsArea = {\n \"series\": [{\"data\": time_series(DATE, 20, {\"min\": 10, \"max\": 60})}],\n \"chart\": {\"id\": \"yt\",\"group\": \"social\",\"type\": \"area\",\"height\": 160},\n \"xaxis\": {'type': 'datetime'},\n \"colors\": [\"#00E396\"]\n}\n\n\n@component\ndef CustomChart(options):\n return html.div({'style': {'min-height': '175px'}},\n ApexChart(options=options),\n )\n\n@component\ndef AppMain():\n return html.div(\n CustomChart(options=options),\n CustomChart(options=optionsLine2),\n CustomChart(options=optionsArea),\n )\n\n\n# python -m examples.syncing_chart\n\nif __name__ == \"__main__\":\n run(AppMain)\n```\n",
"bugtrack_url": null,
"license": "MIT",
"summary": null,
"version": "0.0.12",
"project_urls": {
"Homepage": "https://github.com/stevej2608/reactpy-apexcharts",
"Repository": "https://github.com/stevej2608/reactpy-apexcharts"
},
"split_keywords": [],
"urls": [
{
"comment_text": "",
"digests": {
"blake2b_256": "fdc5b892083cd65468d81d5df7fd27b8c51131a6c2d34cc38cb8bc3226a33f71",
"md5": "3d4bc5d132add608000c2efb117c69ec",
"sha256": "baec728051a79c7358b231e7a59bdaa4328f634d9ab5460fce6e4cb82e990431"
},
"downloads": -1,
"filename": "reactpy_apexcharts-0.0.12-py3-none-any.whl",
"has_sig": false,
"md5_digest": "3d4bc5d132add608000c2efb117c69ec",
"packagetype": "bdist_wheel",
"python_version": "py3",
"requires_python": "<4.0.0,>=3.9",
"size": 1560106,
"upload_time": "2024-09-28T12:28:37",
"upload_time_iso_8601": "2024-09-28T12:28:37.953987Z",
"url": "https://files.pythonhosted.org/packages/fd/c5/b892083cd65468d81d5df7fd27b8c51131a6c2d34cc38cb8bc3226a33f71/reactpy_apexcharts-0.0.12-py3-none-any.whl",
"yanked": false,
"yanked_reason": null
},
{
"comment_text": "",
"digests": {
"blake2b_256": "6e66f2778206e9f31c179afa30bc3ba1cec679a2d389d66bbcb49083b41623b5",
"md5": "1e570d73814c0f078942fba89d307e9f",
"sha256": "2a34c88a39415a1b92bba2c59753bb294355fdb9891122cd01d829516a562d66"
},
"downloads": -1,
"filename": "reactpy_apexcharts-0.0.12.tar.gz",
"has_sig": false,
"md5_digest": "1e570d73814c0f078942fba89d307e9f",
"packagetype": "sdist",
"python_version": "source",
"requires_python": "<4.0.0,>=3.9",
"size": 1552843,
"upload_time": "2024-09-28T12:28:40",
"upload_time_iso_8601": "2024-09-28T12:28:40.904974Z",
"url": "https://files.pythonhosted.org/packages/6e/66/f2778206e9f31c179afa30bc3ba1cec679a2d389d66bbcb49083b41623b5/reactpy_apexcharts-0.0.12.tar.gz",
"yanked": false,
"yanked_reason": null
}
],
"upload_time": "2024-09-28 12:28:40",
"github": true,
"gitlab": false,
"bitbucket": false,
"codeberg": false,
"github_user": "stevej2608",
"github_project": "reactpy-apexcharts",
"travis_ci": false,
"coveralls": false,
"github_actions": false,
"lcname": "reactpy-apexcharts"
}

