| Name | renkodf JSON |
| Version |
1.1
 JSON
JSON |
| download |
| home_page | |
| Summary | Transform Tick Data into OHLCV Renko Dataframe! |
| upload_time | 2023-12-29 03:07:14 |
| maintainer | |
| docs_url | None |
| author | |
| requires_python | >=3.8 |
| license | MIT License Copyright (c) 2023-present Permission is hereby granted, free of charge, to any person obtaining a copy of this software and associated documentation files (the "Software"), to deal in the Software without restriction, including without limitation the rights to use, copy, modify, merge, publish, distribute, sublicense, and/or sell copies of the Software, and to permit persons to whom the Software is furnished to do so, subject to the following conditions: The above copyright notice and this permission notice shall be included in all copies or substantial portions of the Software. THE SOFTWARE IS PROVIDED "AS IS", WITHOUT WARRANTY OF ANY KIND, EXPRESS OR IMPLIED, INCLUDING BUT NOT LIMITED TO THE WARRANTIES OF MERCHANTABILITY, FITNESS FOR A PARTICULAR PURPOSE AND NONINFRINGEMENT. IN NO EVENT SHALL THE AUTHORS OR COPYRIGHT HOLDERS BE LIABLE FOR ANY CLAIM, DAMAGES OR OTHER LIABILITY, WHETHER IN AN ACTION OF CONTRACT, TORT OR OTHERWISE, ARISING FROM, OUT OF OR IN CONNECTION WITH THE SOFTWARE OR THE USE OR OTHER DEALINGS IN THE SOFTWARE. |
| keywords |
renko
pyrenko
renkopy
renkowicks
renko ohlc
finance
candlestick
ohlc
market
investing
technical analysis
|
| VCS |
 |
| bugtrack_url |
|
| requirements |
No requirements were recorded.
|
| Travis-CI |
No Travis.
|
| coveralls test coverage |
No coveralls.
|
# renkodf
#### Transform Tick Data into OHLCV Renko Dataframe!
-----
# Installation
## `pip install renkodf`
#### or just copy *renkodf.py* file to your project!
- renkodf requires [pandas](https://pypi.org/project/pandas/), [numpy](https://pypi.org/project/numpy/) and [mplfinance](https://pypi.org/project/mplfinance/)
---
# Content
- **[Usage](#usage)**
- **[Animation/Realtime Renko Chart](#anim)**
- **[Is the Renko chart calculated correctly?](#calculated)**
---
# <a name="usage"></a>Usage
There are two classes available:
* `Renko(df, brick_size, add_columns)`
<br>To create Renko OHLCV dataframe with existing Ticks data.
* `RenkoWS(timestamp, price, brick_size, external_df, external_mode)`
<br>To create real-time Renko charts, usually over a **WebSocket** connection.
Let's start with the first class, load a Pandas DataFrame containing Ticks Data, for example:
```python
import pandas as pd
df_ticks = pd.read_parquet('examples/data/EURGBP_T1_cT.parquet')
df_ticks.rename(columns={'bid': 'close'}, inplace=True)
df_ticks.head(3)
df_ticks.tail(3)
```
<div>
<table border="1" class="dataframe">
<thead>
<tr style="text-align: right;">
<th></th>
<th>ask</th>
<th>close</th>
<th>spread</th>
</tr>
<tr>
<th>datetime</th>
<th></th>
<th></th>
<th></th>
</tr>
</thead>
<tbody>
<tr>
<th>2023-06-23 00:00:00.335</th>
<td>0.85950</td>
<td>0.85945</td>
<td>0.00005</td>
</tr>
<tr>
<th>2023-06-23 00:00:00.541</th>
<td>0.85951</td>
<td>0.85944</td>
<td>0.00007</td>
</tr>
<tr>
<th>2023-06-23 00:00:02.106</th>
<td>0.85950</td>
<td>0.85944</td>
<td>0.00006</td>
</tr>
</tbody>
</table>
</div>
<div>
<table border="1" class="dataframe">
<thead>
<tr style="text-align: right;">
<th></th>
<th>ask</th>
<th>close</th>
<th>spread</th>
</tr>
<tr>
<th>datetime</th>
<th></th>
<th></th>
<th></th>
</tr>
</thead>
<tbody>
<tr>
<th>2023-06-27 23:59:56.612</th>
<td>0.85976</td>
<td>0.85969</td>
<td>0.00007</td>
</tr>
<tr>
<th>2023-06-27 23:59:57.175</th>
<td>0.85975</td>
<td>0.85969</td>
<td>0.00006</td>
</tr>
<tr>
<th>2023-06-27 23:59:59.053</th>
<td>0.85974</td>
<td>0.85969</td>
<td>0.00005</td>
</tr>
</tbody>
</table>
</div>
---
Only two columns are required:
* `close`: Mandatory.
* `datetime`: If is not present, the index will be used.
<br>You can add other columns if you want, just put a list with their names in the `add_columns` parameter.
After importing renkodf and setting `brick_size`, just call `renko_df()` with the chosen mode name.<br>
**See all available modes in [renkodf_modes.ipynb](https://github.com/srlcarlg/renkodf/blob/master/examples/renkodf_modes.ipynb)**
```python
from renkodf import Renko
r = Renko(df_ticks, brick_size=0.0003)
df = r.renko_df('normal') # 'wicks' = default
df.head(3)
df.tail(3)
```
100.0%
<div>
<table border="1" class="dataframe">
<thead>
<tr style="text-align: right;">
<th></th>
<th>open</th>
<th>high</th>
<th>low</th>
<th>close</th>
<th>volume</th>
</tr>
<tr>
<th>datetime</th>
<th></th>
<th></th>
<th></th>
<th></th>
<th></th>
</tr>
</thead>
<tbody>
<tr>
<th>2023-06-23 01:21:58.333</th>
<td>0.8595</td>
<td>0.8598</td>
<td>0.8595</td>
<td>0.8598</td>
<td>3458.0</td>
</tr>
<tr>
<th>2023-06-23 01:33:24.996</th>
<td>0.8598</td>
<td>0.8601</td>
<td>0.8598</td>
<td>0.8601</td>
<td>571.0</td>
</tr>
<tr>
<th>2023-06-23 03:18:30.345</th>
<td>0.8601</td>
<td>0.8604</td>
<td>0.8601</td>
<td>0.8604</td>
<td>4993.0</td>
</tr>
</tbody>
</table>
</div>
<div>
<table border="1" class="dataframe">
<thead>
<tr style="text-align: right;">
<th></th>
<th>open</th>
<th>high</th>
<th>low</th>
<th>close</th>
<th>volume</th>
</tr>
<tr>
<th>datetime</th>
<th></th>
<th></th>
<th></th>
<th></th>
<th></th>
</tr>
</thead>
<tbody>
<tr>
<th>2023-06-27 17:29:15.119</th>
<td>0.8595</td>
<td>0.8598</td>
<td>0.8595</td>
<td>0.8598</td>
<td>2889.0</td>
</tr>
<tr>
<th>2023-06-27 21:01:00.071</th>
<td>0.8595</td>
<td>0.8595</td>
<td>0.8592</td>
<td>0.8592</td>
<td>7779.0</td>
</tr>
<tr>
<th>2023-06-27 21:31:48.569</th>
<td>0.8595</td>
<td>0.8598</td>
<td>0.8595</td>
<td>0.8598</td>
<td>359.0</td>
</tr>
</tbody>
</table>
</div>
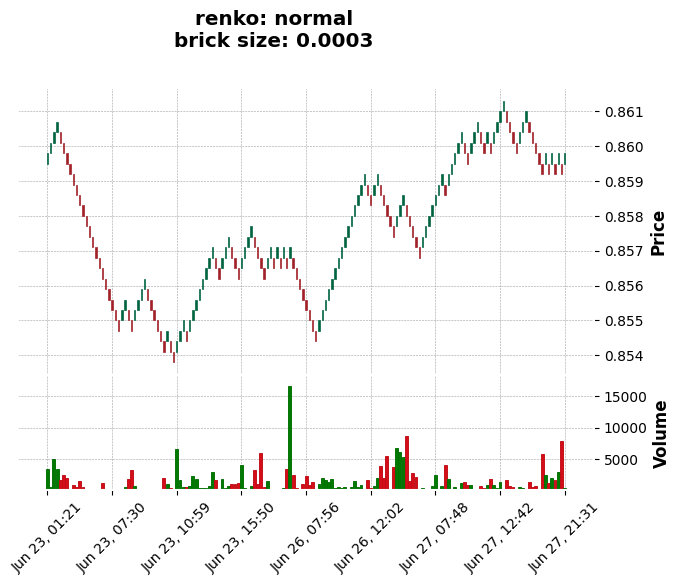
You can use `mpf.plot()` or `r.plot()`, as in the example below.
```python
import mplfinance as mpf
mpf.plot(df, type='candle', volume=True, style="charles",
title=f"renko: normal\nbrick size: 0.0003")
mpf.show()
# same as:
# r.plot('normal')
```
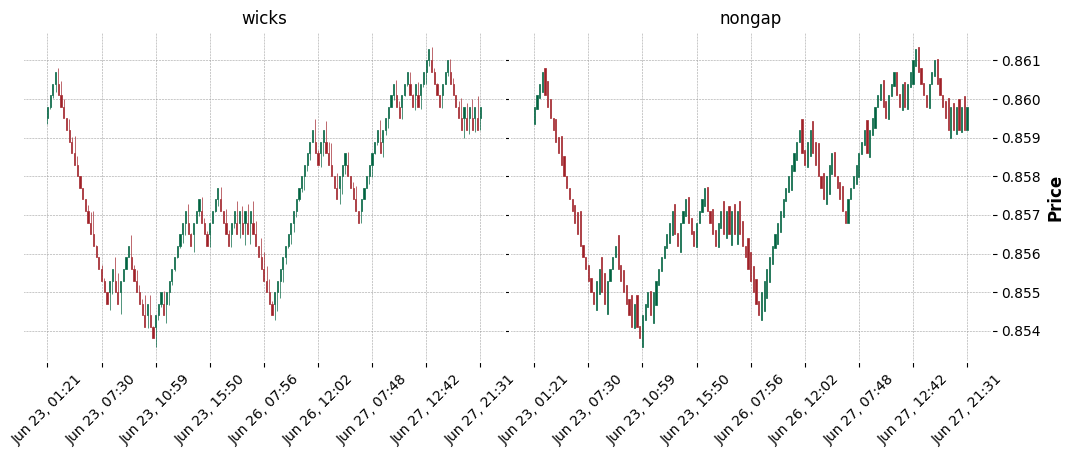
As described in [renkodf_modes.ipynb](https://github.com/srlcarlg/renkodf/blob/master/examples/renkodf_modes.ipynb), we can have multiple dataframes of different modes from the same instance.
```python
df_wicks = r.renko_df('wicks')
df_nongap = r.renko_df('nongap')
fig = mpf.figure(style='charles', figsize=(12.5,9))
fig.subplots_adjust(hspace=0.1, wspace=0.01)
ax1 = fig.add_subplot(2,2,1)
ax2 = fig.add_subplot(2,2,2)
mpf.plot(df_wicks,type='candle',ax=ax1,axtitle='wicks', )
mpf.plot(df_nongap,type='candle',ax=ax2,axtitle='nongap')
mpf.show()
```
# <a name="anim"></a>Animation/Real-time Renko Chart
Following the steps of the mplfinance documentation, it can be tricky to display animations properly in jupyter notebooks, therefore, to keep things simple, the animation examples are scripts.
To run the animation examples, clone this repository, then into the `renkodf/examples` folder, run:
* python ws_animchart_demo.py
* python ws_multichart_demo.py
* python ws_externaldf_demo.py
**NOTE:** There are comments, in each of the above example files, talking about situations or recommendations to be applied in real cases.
# <a name="calculated"></a>Is the Renko chart calculated correctly?
I also asked myself the same question, how about we see for ourselves? <br>
We are going to do this based on *Spotware's FX/CFD Trading Platform* called **cTrader**,<br>
using *IC Markets* as a Price Provider.
#### **[Let's go!](https://github.com/srlcarlg/renkodf/blob/master/examples/comparison_ctrader.ipynb)**
**RESUME**: Despite the possible occurrence of more/less bricks, the renko calculation used is practically the same, or very approximate.
### Non-Affiliation Disclaimer
I'm not endorsed by, directly affiliated with, maintained, authorized, or sponsored by any company previously mentioned.
All product and company names are the registered trademarks of their original owners.
The use of any trade name or trademark is for identification and reference purposes only and does not imply any association with the trademark holder of their product brand.
```python
```
Raw data
{
"_id": null,
"home_page": "",
"name": "renkodf",
"maintainer": "",
"docs_url": null,
"requires_python": ">=3.8",
"maintainer_email": "",
"keywords": "renko,pyrenko,renkopy,renkowicks,renko ohlc,finance,candlestick,ohlc,market,investing,technical analysis",
"author": "",
"author_email": "Carlos Gabriel <carlgsr1@gmail.com>",
"download_url": "https://files.pythonhosted.org/packages/65/b8/dff56d880af88a2d9c3bb09c887866c414650b161b339812dabf1f00e902/renkodf-1.1.tar.gz",
"platform": null,
"description": "# renkodf\n#### Transform Tick Data into OHLCV Renko Dataframe!\n\n\n-----\n\n# Installation\n## `pip install renkodf`\n#### or just copy *renkodf.py* file to your project!\n - renkodf requires [pandas](https://pypi.org/project/pandas/), [numpy](https://pypi.org/project/numpy/) and [mplfinance](https://pypi.org/project/mplfinance/)\n\n---\n\n# Content\n - **[Usage](#usage)**\n - **[Animation/Realtime Renko Chart](#anim)**\n - **[Is the Renko chart calculated correctly?](#calculated)**\n\n---\n\n# <a name=\"usage\"></a>Usage\n\nThere are two classes available:\n* `Renko(df, brick_size, add_columns)`\n<br>To create Renko OHLCV dataframe with existing Ticks data.\n* `RenkoWS(timestamp, price, brick_size, external_df, external_mode)`\n<br>To create real-time Renko charts, usually over a **WebSocket** connection.\n\nLet's start with the first class, load a Pandas DataFrame containing Ticks Data, for example:\n\n\n```python\nimport pandas as pd\ndf_ticks = pd.read_parquet('examples/data/EURGBP_T1_cT.parquet')\ndf_ticks.rename(columns={'bid': 'close'}, inplace=True)\ndf_ticks.head(3)\ndf_ticks.tail(3)\n```\n\n\n\n\n<div>\n<table border=\"1\" class=\"dataframe\">\n <thead>\n <tr style=\"text-align: right;\">\n <th></th>\n <th>ask</th>\n <th>close</th>\n <th>spread</th>\n </tr>\n <tr>\n <th>datetime</th>\n <th></th>\n <th></th>\n <th></th>\n </tr>\n </thead>\n <tbody>\n <tr>\n <th>2023-06-23 00:00:00.335</th>\n <td>0.85950</td>\n <td>0.85945</td>\n <td>0.00005</td>\n </tr>\n <tr>\n <th>2023-06-23 00:00:00.541</th>\n <td>0.85951</td>\n <td>0.85944</td>\n <td>0.00007</td>\n </tr>\n <tr>\n <th>2023-06-23 00:00:02.106</th>\n <td>0.85950</td>\n <td>0.85944</td>\n <td>0.00006</td>\n </tr>\n </tbody>\n</table>\n</div>\n\n\n\n\n\n\n<div>\n<table border=\"1\" class=\"dataframe\">\n <thead>\n <tr style=\"text-align: right;\">\n <th></th>\n <th>ask</th>\n <th>close</th>\n <th>spread</th>\n </tr>\n <tr>\n <th>datetime</th>\n <th></th>\n <th></th>\n <th></th>\n </tr>\n </thead>\n <tbody>\n <tr>\n <th>2023-06-27 23:59:56.612</th>\n <td>0.85976</td>\n <td>0.85969</td>\n <td>0.00007</td>\n </tr>\n <tr>\n <th>2023-06-27 23:59:57.175</th>\n <td>0.85975</td>\n <td>0.85969</td>\n <td>0.00006</td>\n </tr>\n <tr>\n <th>2023-06-27 23:59:59.053</th>\n <td>0.85974</td>\n <td>0.85969</td>\n <td>0.00005</td>\n </tr>\n </tbody>\n</table>\n</div>\n\n\n\n---\nOnly two columns are required:\n * `close`: Mandatory.\n * `datetime`: If is not present, the index will be used.\n<br>You can add other columns if you want, just put a list with their names in the `add_columns` parameter.\n \nAfter importing renkodf and setting `brick_size`, just call `renko_df()` with the chosen mode name.<br> \n**See all available modes in [renkodf_modes.ipynb](https://github.com/srlcarlg/renkodf/blob/master/examples/renkodf_modes.ipynb)**\n\n\n```python\nfrom renkodf import Renko\nr = Renko(df_ticks, brick_size=0.0003)\ndf = r.renko_df('normal') # 'wicks' = default \ndf.head(3)\ndf.tail(3)\n```\n\n 100.0%\n\n\n\n\n<div>\n<table border=\"1\" class=\"dataframe\">\n <thead>\n <tr style=\"text-align: right;\">\n <th></th>\n <th>open</th>\n <th>high</th>\n <th>low</th>\n <th>close</th>\n <th>volume</th>\n </tr>\n <tr>\n <th>datetime</th>\n <th></th>\n <th></th>\n <th></th>\n <th></th>\n <th></th>\n </tr>\n </thead>\n <tbody>\n <tr>\n <th>2023-06-23 01:21:58.333</th>\n <td>0.8595</td>\n <td>0.8598</td>\n <td>0.8595</td>\n <td>0.8598</td>\n <td>3458.0</td>\n </tr>\n <tr>\n <th>2023-06-23 01:33:24.996</th>\n <td>0.8598</td>\n <td>0.8601</td>\n <td>0.8598</td>\n <td>0.8601</td>\n <td>571.0</td>\n </tr>\n <tr>\n <th>2023-06-23 03:18:30.345</th>\n <td>0.8601</td>\n <td>0.8604</td>\n <td>0.8601</td>\n <td>0.8604</td>\n <td>4993.0</td>\n </tr>\n </tbody>\n</table>\n</div>\n\n\n\n\n\n\n<div>\n<table border=\"1\" class=\"dataframe\">\n <thead>\n <tr style=\"text-align: right;\">\n <th></th>\n <th>open</th>\n <th>high</th>\n <th>low</th>\n <th>close</th>\n <th>volume</th>\n </tr>\n <tr>\n <th>datetime</th>\n <th></th>\n <th></th>\n <th></th>\n <th></th>\n <th></th>\n </tr>\n </thead>\n <tbody>\n <tr>\n <th>2023-06-27 17:29:15.119</th>\n <td>0.8595</td>\n <td>0.8598</td>\n <td>0.8595</td>\n <td>0.8598</td>\n <td>2889.0</td>\n </tr>\n <tr>\n <th>2023-06-27 21:01:00.071</th>\n <td>0.8595</td>\n <td>0.8595</td>\n <td>0.8592</td>\n <td>0.8592</td>\n <td>7779.0</td>\n </tr>\n <tr>\n <th>2023-06-27 21:31:48.569</th>\n <td>0.8595</td>\n <td>0.8598</td>\n <td>0.8595</td>\n <td>0.8598</td>\n <td>359.0</td>\n </tr>\n </tbody>\n</table>\n</div>\n\n\n\nYou can use `mpf.plot()` or `r.plot()`, as in the example below.\n\n\n```python\nimport mplfinance as mpf\nmpf.plot(df, type='candle', volume=True, style=\"charles\", \n title=f\"renko: normal\\nbrick size: 0.0003\")\nmpf.show()\n# same as:\n# r.plot('normal')\n```\n\n\n \n\n \n\n\nAs described in [renkodf_modes.ipynb](https://github.com/srlcarlg/renkodf/blob/master/examples/renkodf_modes.ipynb), we can have multiple dataframes of different modes from the same instance.\n\n\n```python\ndf_wicks = r.renko_df('wicks')\ndf_nongap = r.renko_df('nongap')\n\nfig = mpf.figure(style='charles', figsize=(12.5,9))\nfig.subplots_adjust(hspace=0.1, wspace=0.01)\nax1 = fig.add_subplot(2,2,1)\nax2 = fig.add_subplot(2,2,2)\n\nmpf.plot(df_wicks,type='candle',ax=ax1,axtitle='wicks', )\nmpf.plot(df_nongap,type='candle',ax=ax2,axtitle='nongap')\nmpf.show()\n```\n\n \n\n \n\n\n# <a name=\"anim\"></a>Animation/Real-time Renko Chart\nFollowing the steps of the mplfinance documentation, it can be tricky to display animations properly in jupyter notebooks, therefore, to keep things simple, the animation examples are scripts.\n\nTo run the animation examples, clone this repository, then into the `renkodf/examples` folder, run:\n * python ws_animchart_demo.py \n * python ws_multichart_demo.py\n * python ws_externaldf_demo.py\n\n**NOTE:** There are comments, in each of the above example files, talking about situations or recommendations to be applied in real cases.\n\n# <a name=\"calculated\"></a>Is the Renko chart calculated correctly?\nI also asked myself the same question, how about we see for ourselves? <br>\nWe are going to do this based on *Spotware's FX/CFD Trading Platform* called **cTrader**,<br>\nusing *IC Markets* as a Price Provider. \n#### **[Let's go!](https://github.com/srlcarlg/renkodf/blob/master/examples/comparison_ctrader.ipynb)**\n\n**RESUME**: Despite the possible occurrence of more/less bricks, the renko calculation used is practically the same, or very approximate.\n\n\n### Non-Affiliation Disclaimer\n\nI'm not endorsed by, directly affiliated with, maintained, authorized, or sponsored by any company previously mentioned. \n\nAll product and company names are the registered trademarks of their original owners. \n\nThe use of any trade name or trademark is for identification and reference purposes only and does not imply any association with the trademark holder of their product brand.\n\n\n```python\n\n```\n",
"bugtrack_url": null,
"license": "MIT License Copyright (c) 2023-present Permission is hereby granted, free of charge, to any person obtaining a copy of this software and associated documentation files (the \"Software\"), to deal in the Software without restriction, including without limitation the rights to use, copy, modify, merge, publish, distribute, sublicense, and/or sell copies of the Software, and to permit persons to whom the Software is furnished to do so, subject to the following conditions: The above copyright notice and this permission notice shall be included in all copies or substantial portions of the Software. THE SOFTWARE IS PROVIDED \"AS IS\", WITHOUT WARRANTY OF ANY KIND, EXPRESS OR IMPLIED, INCLUDING BUT NOT LIMITED TO THE WARRANTIES OF MERCHANTABILITY, FITNESS FOR A PARTICULAR PURPOSE AND NONINFRINGEMENT. IN NO EVENT SHALL THE AUTHORS OR COPYRIGHT HOLDERS BE LIABLE FOR ANY CLAIM, DAMAGES OR OTHER LIABILITY, WHETHER IN AN ACTION OF CONTRACT, TORT OR OTHERWISE, ARISING FROM, OUT OF OR IN CONNECTION WITH THE SOFTWARE OR THE USE OR OTHER DEALINGS IN THE SOFTWARE.",
"summary": "Transform Tick Data into OHLCV Renko Dataframe!",
"version": "1.1",
"project_urls": {
"Homepage": "https://github.com/srlcarlg/renkodf"
},
"split_keywords": [
"renko",
"pyrenko",
"renkopy",
"renkowicks",
"renko ohlc",
"finance",
"candlestick",
"ohlc",
"market",
"investing",
"technical analysis"
],
"urls": [
{
"comment_text": "",
"digests": {
"blake2b_256": "0aa34fb57f0b0a47ff408610fc5771e6918384041728bb078ffee90c883df465",
"md5": "f9dc80bcb71a5e11a85feab70c7db018",
"sha256": "605ed5ab8ee6a8ee2986e20119f340a1a5a1aabc44d6f1336c7d1d471d1f6888"
},
"downloads": -1,
"filename": "renkodf-1.1-py3-none-any.whl",
"has_sig": false,
"md5_digest": "f9dc80bcb71a5e11a85feab70c7db018",
"packagetype": "bdist_wheel",
"python_version": "py3",
"requires_python": ">=3.8",
"size": 10615,
"upload_time": "2023-12-29T03:07:12",
"upload_time_iso_8601": "2023-12-29T03:07:12.823238Z",
"url": "https://files.pythonhosted.org/packages/0a/a3/4fb57f0b0a47ff408610fc5771e6918384041728bb078ffee90c883df465/renkodf-1.1-py3-none-any.whl",
"yanked": false,
"yanked_reason": null
},
{
"comment_text": "",
"digests": {
"blake2b_256": "65b8dff56d880af88a2d9c3bb09c887866c414650b161b339812dabf1f00e902",
"md5": "da99ba4474b9b92a32c1eaefc5b45cd2",
"sha256": "815c2452092c4484ecfa2f21fea03886f56d6a3e24f821676aeeafc0f9959710"
},
"downloads": -1,
"filename": "renkodf-1.1.tar.gz",
"has_sig": false,
"md5_digest": "da99ba4474b9b92a32c1eaefc5b45cd2",
"packagetype": "sdist",
"python_version": "source",
"requires_python": ">=3.8",
"size": 13702,
"upload_time": "2023-12-29T03:07:14",
"upload_time_iso_8601": "2023-12-29T03:07:14.701287Z",
"url": "https://files.pythonhosted.org/packages/65/b8/dff56d880af88a2d9c3bb09c887866c414650b161b339812dabf1f00e902/renkodf-1.1.tar.gz",
"yanked": false,
"yanked_reason": null
}
],
"upload_time": "2023-12-29 03:07:14",
"github": true,
"gitlab": false,
"bitbucket": false,
"codeberg": false,
"github_user": "srlcarlg",
"github_project": "renkodf",
"travis_ci": false,
"coveralls": false,
"github_actions": false,
"lcname": "renkodf"
}
