| Name | span-gui JSON |
| Version |
7.1.1
 JSON
JSON |
| download |
| home_page | None |
| Summary | GUI program for the manipulation and analysis of astronomical spectra in the optical and NIR wavelength ranges. |
| upload_time | 2025-10-15 18:39:54 |
| maintainer | None |
| docs_url | None |
| author | None |
| requires_python | >=3.10 |
| license | SPAN License
1. This software is licensed for non-commercial, academic and personal use only.
2. The source code may be used and modified for research and educational purposes,
but any modifications must remain for private use unless explicitly authorized
in writing by the original author.
3. Redistribution of the software in its original, unmodified form is permitted
for non-commercial purposes, provided that this license notice is always included.
4. Redistribution or public release of modified versions of the source code
is prohibited without prior written permission from the author.
5. Any user of this software must properly attribute the original author
in any academic work, research, or derivative project.
6. Commercial use of this software is strictly prohibited without prior
written permission from the author.
DISCLAIMER:
THIS SOFTWARE IS PROVIDED "AS IS", WITHOUT WARRANTY OF ANY KIND, EXPRESS OR IMPLIED, INCLUDING BUT NOT LIMITED TO THE WARRANTIES OF MERCHANTABILITY, FITNESS FOR A PARTICULAR PURPOSE, AND NON-INFRINGEMENT. IN NO EVENT SHALL THE AUTHORS OR COPYRIGHT HOLDERS BE LIABLE FOR ANY CLAIM, DAMAGES, OR OTHER LIABILITY, WHETHER IN AN ACTION OF CONTRACT, TORT, OR OTHERWISE, ARISING FROM, OUT OF, OR IN CONNECTION WITH THE SOFTWARE OR THE USE OR OTHER DEALINGS IN THE SOFTWARE.
© Daniele Gasparri - 2025
|
| keywords |
spectral analysis
galaxies
spectral manipulation
linestrength analysis
astronomy
spectral fitting
spectroscopy
data analysis
kinematics
stellar populations
|
| VCS |
 |
| bugtrack_url |
|
| requirements |
No requirements were recorded.
|
| Travis-CI |
No Travis.
|
| coveralls test coverage |
No coveralls.
|
# SPAN: Spectral Analysis Software
📖 **Author:** Daniele Gasparri
📅 **Latest Release:** October 2025


[](./LICENSE)
[](https://span-gui.readthedocs.io/en/latest/)
[](https://arxiv.org/abs/2508.01923)
[](https://doi.org/10.5281/zenodo.17226930)
**SPAN is a cross-platform Python GUI software for the extraction, manipulation, and advanced analysis of 1D astronomical spectra in the optical and near-infrared (NIR) ranges, optimized for galaxy studies.**
## What’s New in SPAN 7.1
- Expanded and improved the two component fit of the "Stellar and gas kinematics" task, which is now available both for the stellar and gas kinematics, with four presets: old-young components, metal rich-metal poor components, all templates, and two templates mode, with custom selection of age and metallicity following the work of Rubino et al. 2021.
- Added interactive analysis modes to the Preview. You can press the key F, E, S, D, I, L, P to enter the Fitting mode, Equivalent width mode, Signal-to-noise mode, Differential wavelength and velocity mode, Integrated line flux mode, Line-peak finding, snaPshot. Draw a region for the F, E, S, I modes or click on two points in the D mode to see the results in the HUD, in the terminal window and to automatically save them in logging files in the "SPAN_results" folder. Press again the respective key to exit the selected analysis mode and return back to idle (not applicable to L and P modes, they exit automatically). Press C to cancel all the overlays. Double click resets also zoom and panning.
- Minor bug fixes
More from the version 7.X:
- Interactive Preview frame that shows the selected spectrum directly in the main GUI. In the preview you can:
- Zoom, pan, and reset with trackpad touches and/or mouse left click/scroll buttons.
- Know in real-time wavelength, flux, and S/N on every point of the spectrum.
- Look at rest-frame reference spectral features (OII, HBeta, OIII, HAlpha, CaT) for immediate comparison with your spectrum.
- Manual Redshift Estimation: shift the selected spectrum with right-click and drag to match the spectral features of your spectrum with the reference lines. Reset the shift with double right-click.
- Consistent Zooming (View menu): unified scaling for fonts, widgets, frames, and Preview to fine-tuning the view on screens with different resolution.
- Extended the preliminary check of the loaded spectra with a quick global S/N evaluation and flagging in the listbox (LOW SNR if S/N <= 5), so you can immediately identify problematic spectra.
- Interactive listbox that allows you to:
- Select multiple spectra with mouse dragging or with crtl or shift + click
- The single spectrum or the selected spectra can be reordered or deleted, via right click menu (delete works also with "Canc" button).
- You can undo the latest operation (i.e. if you accidentally deleted the wrong spectra).
- If two spectra are selected in the listbox, you can also compare them, via right click --> compare.
- You can save the modified spectra list in "Edit --> save current spectra list...".
- Double click on a single spectrum to open an info window with some basic data: name, wavelength range, sampling, mean/median flux, standard deviation and global S/N.
- Markov chain Monte Carlo (MCMC) simulations mode available for stellar parameters estimated with Lick/IDS line-strength analysis, in addition to the griddata linear interpolation and the supervised machine-learning GPR.
- Elliptical (or circular) binning mode for DataCube extraction, allowing you to extract radial spectral bins following the isophotal profiles of your source.
- SPAN now is also available as a standalone self-installing application for Windows systems (10 and 11), without requiring Python.
## Attribution
If you use this software for your research, please cite [Gasparri et al. (2025)](https://arxiv.org/pdf/2508.01923). The BibTeX entry for the paper is:
```bash
@ARTICLE{2025arXiv250801923G,
author = {{Gasparri}, Daniele and {Morelli}, Lorenzo and {Battino}, Umberto and {M{\'e}ndez Abreu}, Jairo and {de Lorenzo-C{\'a}ceres}, Adriana},
title = "{SPAN: A cross-platform Python GUI software for optical and near-infrared spectral analysis}",
journal = {arXiv e-prints},
keywords = {Instrumentation and Methods for Astrophysics, Astrophysics of Galaxies},
year = 2025,
month = aug,
eid = {arXiv:2508.01923},
pages = {arXiv:2508.01923},
doi = {10.48550/arXiv.2508.01923},
archivePrefix = {arXiv},
eprint = {2508.01923},
primaryClass = {astro-ph.IM},
adsurl = {https://ui.adsabs.harvard.edu/abs/2025arXiv250801923G},
adsnote = {Provided by the SAO/NASA Astrophysics Data System}
}
```
## Overview
**SPAN is the first cross-platform graphical user interface (GUI) program designed to extract, manipulate and analyze professional astronomical science spectra.** It is optimized for the study of galaxy spectra from the near UV to near-infrared (NIR) atmospheric windows.
SPAN has been developed to provide users with a simple and clear GUI that integrates the most commonly used tools for manipulation and analysis of stellar and galaxy spectra.
The goal of SPAN is to make spectral manipulation and analysis faster and simpler in one GUI program, fully cross-platform and user friendly.
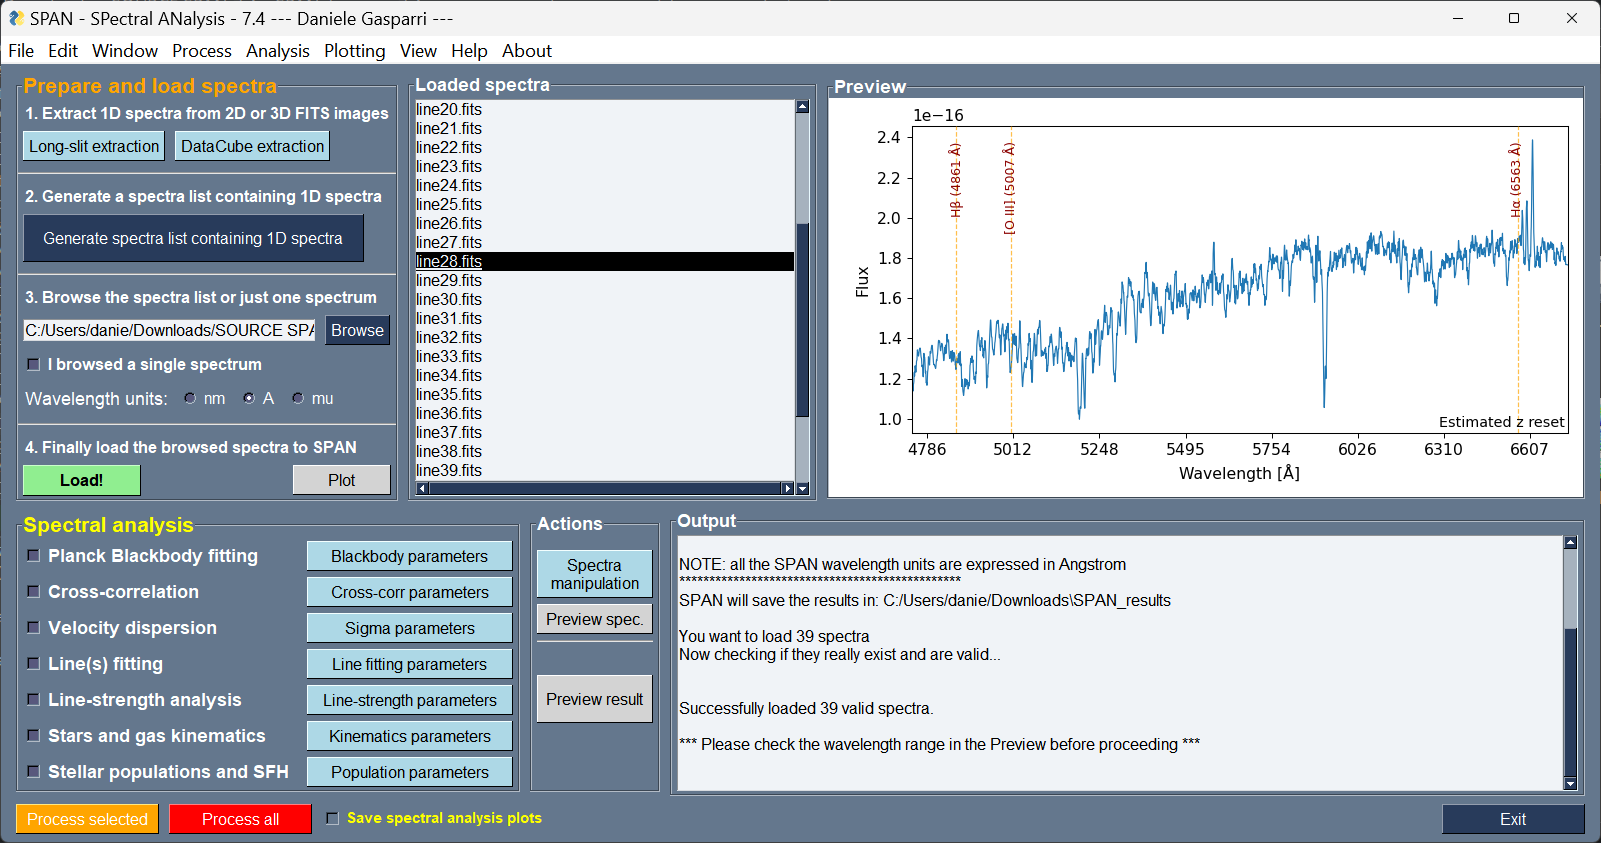
**Main panel of SPAN as it appears on Windows and Linux systems.*
## Features
- **Fully interactive GUI:** No command line required to perform high-level scientific analysis and spectra manipulation
- **Compatibility:** Automatically recognizes a wide range of **FITS and ASCII** spectral formats
- **Spectra extraction:** From reduced long-slit FITS and datacubes FITS, SPAN allows to extract 1D spectra with automatic (e.g. Voronoi) and manual binning options. Native supports for MUSE, CALIFA, WEAVE LIFU, and JWST IFU datacubes is offered. Users can also write and implement their custom routines to support more instruments
- **Spectral manipulation:** More than 20 tasks to manipulate the spectra (e.g cropping, Doppler/z correction, rebinning, smoothing, continuum modelling...)
- **Spectral analysis:** Using built-in routines and relying on state-of-the-art full spectral fitting code (pPXF), SPAN can perform all the powerful spectral analysis tasks of modern astronomy: kinematics, stellar populations studies, line-strength, cross-correlation, line fitting...
- **Batch processing support** for multiple spectra. Optimized to work with a large amount of 1D spectra (e.g. extracted from data cubes)
- **Plotting:** Generates high quality publication grade plots
- **Customizable:** Many parameters can be set to use SPAN for a wide range of science cases
- **Fully cross-platform:** SPAN is optimized and can run on any device and any operating system, including Android (using for example the Pydroid3 app)
- **Stand-alone app for Windows**: SPAN now can also be installed and used as a standard app for Windows 10 and 11 systems, without requiring Python.
## Fully cross-platform capabilities
SPAN has been carefully designed and tested to run across different platforms, making it accessible to a wide range of users. While the core functionality remains consistent, there are some minor differences in layout and interaction depending on the operating system:
- **Windows and Linux**: The interface and functionality are nearly identical. Both platforms provide the full set of tools, including the integrated output frame where progress messages and logs are displayed directly within the GUI.
- **macOS**: On macOS, the overall layout of SPAN remains consistent with Windows/Linux, but the integrated output frame has been removed. During testing, this component significantly slowed down performance on macOS systems, so messages are instead displayed in the standard system terminal. Apart from this adjustment, all features of SPAN work exactly as on other platforms.
- **Android** (via Pydroid3 app): SPAN can also be used on Android devices through the Pydroid3 environment (see the README_ANDROID.txt for instructions). The GUI has been adapted for smaller screens: the classic menu bar is replaced by practical buttons placed at the top and bottom of the panel. Some interactive functions of the Preview and Listbox frames, such as right/left mouse click actions, are not available on touch devices. However, the rest of the functionality remains identical to the desktop versions, making Android a fully usable platform for basic analysis tasks.
The images below show the aspect of SPAN on Android and macOS systems.
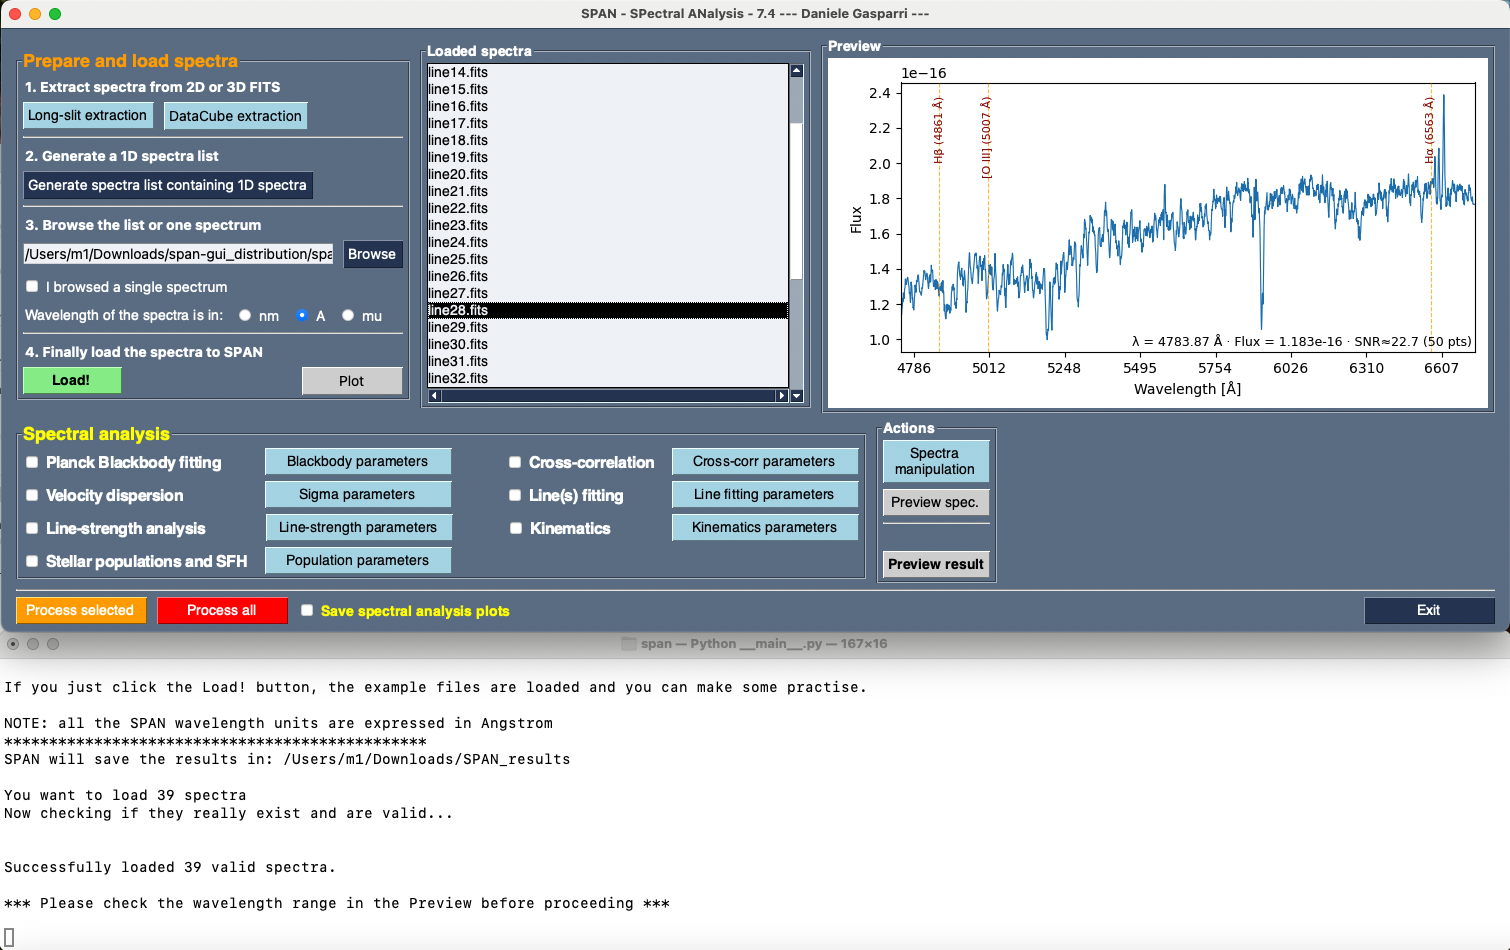
*Main panel of SPAN as it appears on macOS systems. The output messages are shown in the external terminal aligned below the GUI.*
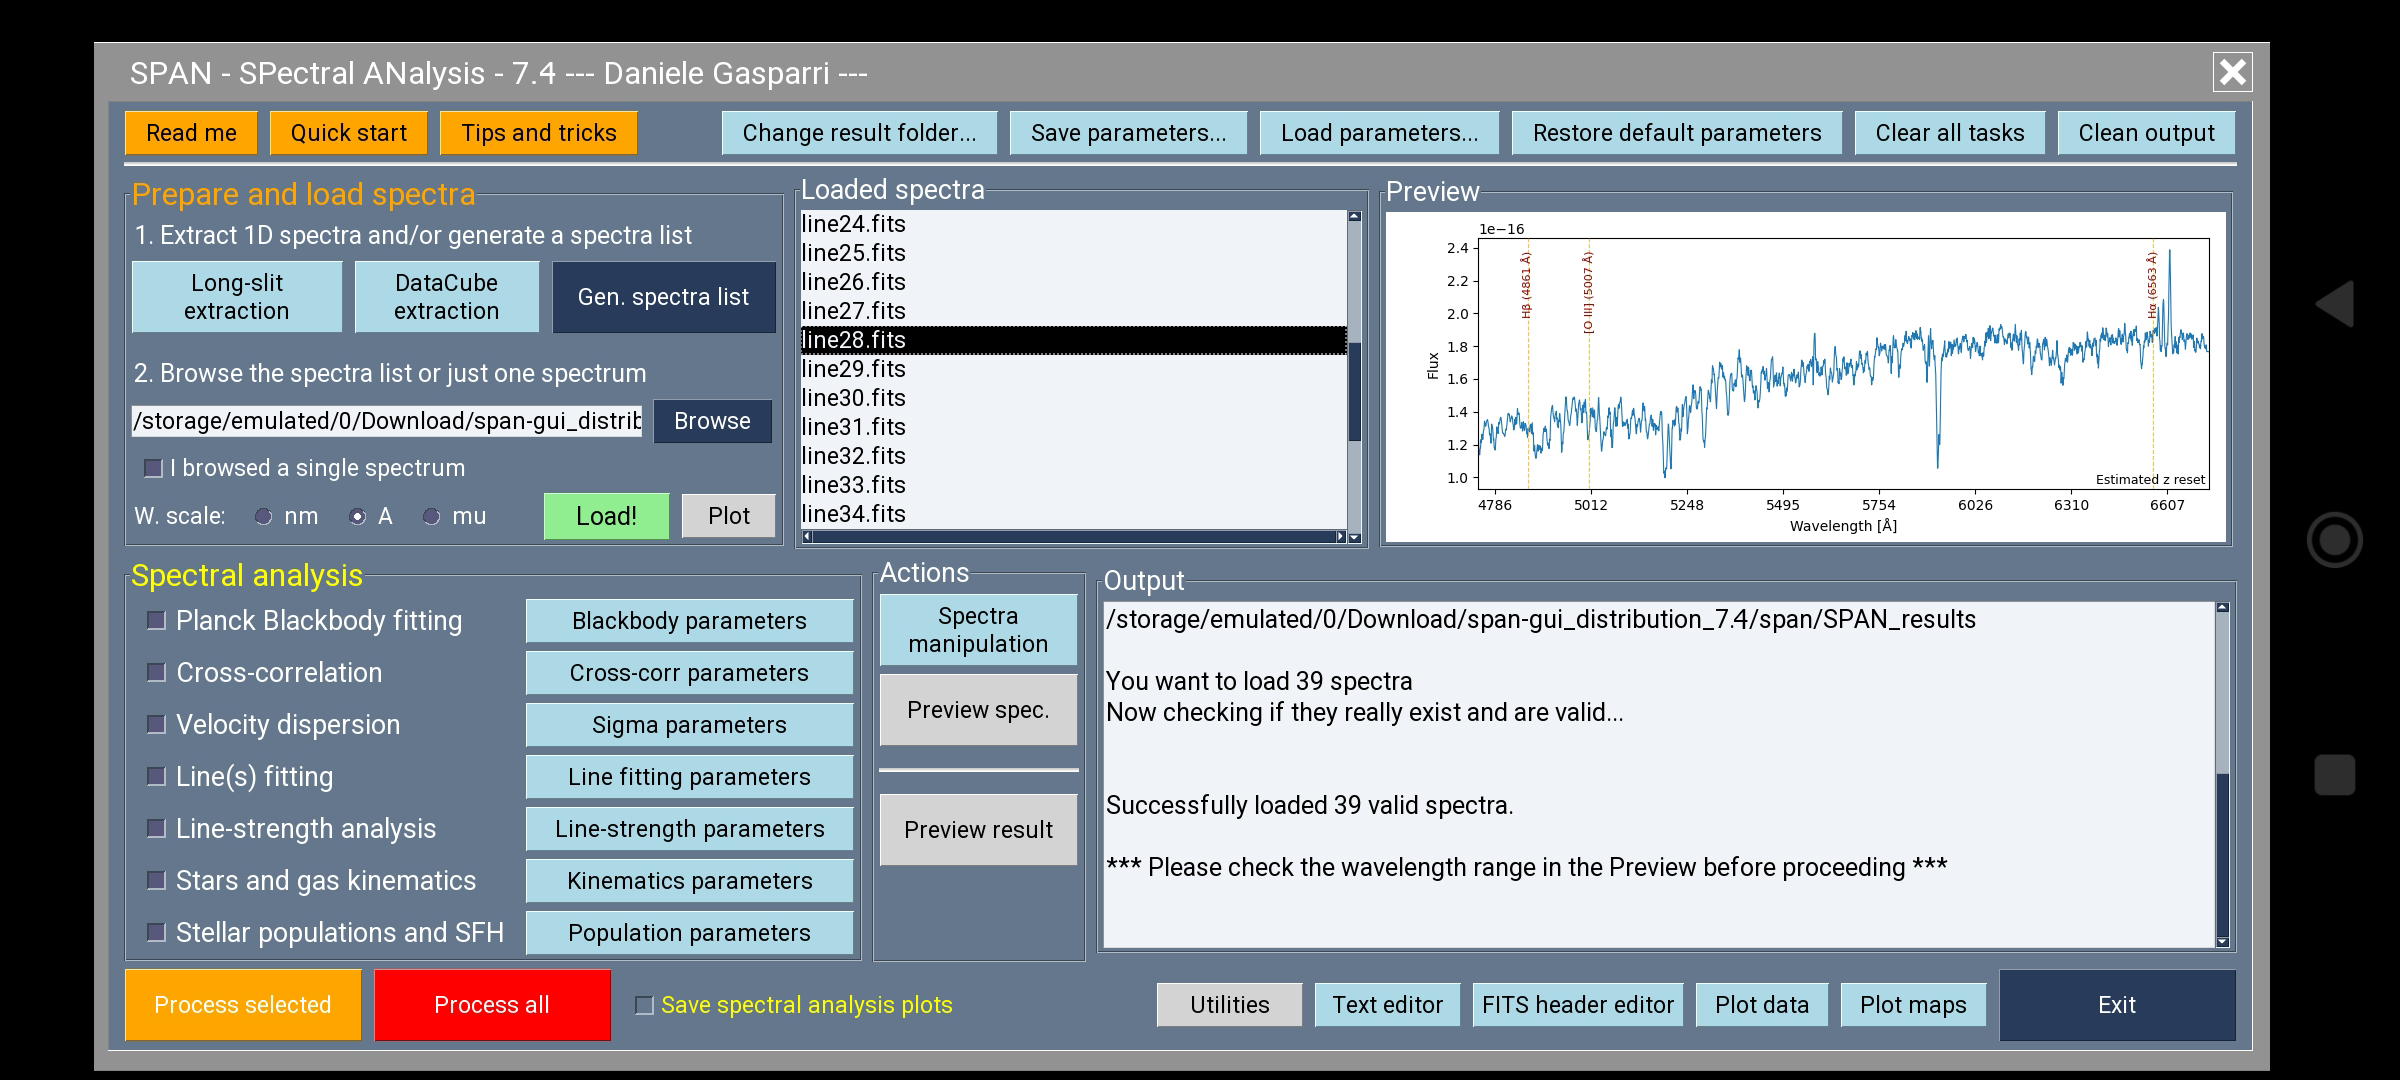
*Main panel of SPAN as it appears on Android devices, here displayed on a smartphone screen.*
## System Requirements
- Python 3.10+
- Screen resolution of at least 1600x900 px. Optimal resolution: 1920X1080.
- The following dependencies will be automatically installed:
numpy, scipy, astropy, matplotlib, pandas, scikit-learn, scikit-image, PyWavelets, joblib, ppxf, vorbin, certifi, emcee
## Installation
You can install **SPAN** using `pip`:
```bash
pip3 install span-gui
```
## Tested Compatibility
SPAN has been tested with the following spectra:
- **IRAF generated 1D spectra**
- **SDSS spectra**
- **IRTF (also extended version) spectra**
- **SAURON spectra**
- **X-Shooter library spectra**
- **JWST spectra**
- **MUSE, CALIFA, WEAVE LIFU, and JWST NIRSpec IFU data cubes**
- **(E)MILES, GALAXEV, FSPS SSP templates**
- **ESO reduced spectra products** for optical and NIR spectra
Generally speaking, the compatible spectra formats are:
- Wavelength units must be in Angstrom, nanometers or micrometers, either linear, log or log10
- 1D fits table with wavelength information stored in the "CRVAL1" and "CDELT1" keywords
- 2D fits table with wavelength and flux values stored in the primary HDU
- Plain text ASCII files (.txt or .dat) with wavelengths in the first column and flux in the second column
## Working with Spectra Lists
SPAN has been optimized to work with a series of n 1D spectra. The spectra are passed to SPAN by creating and loading a spectra list. The spectra list is an ASCII file containing the path of your spectra and can be created with SPAN, using the button **Generate a spectra list containing 1D spectra**. Just select the folder where your spectra are located, confirm the selection, set the wavelength units of your spectra (assuming are the same for all) and then click the **Load!** button.
A spectra list can be created also manually and should include:
- absolute paths of spectra, or relative path if your spectra are located in a subfolder of SPAN
- A commented first line (e.g. # Spectrum)
- It can be stored anywhere in your device
Example file lists are provided in example_files/ folder.
## Quick Start
Run SPAN using:
```bash
span-gui
```
Once launched, select the folder to store the results in your device, then click "Load!" in the main GUI to load the example spectra in the listbox and start playing with the GUI.
## Basic Usage example
- In the "Prepare and load spectra" frame, browse one of the spectra lists contained in the example_files/ folder (e.g. ngc5806_bins.dat). Set the "Wavelength of the spectra is in:" to "A", then click "Load!"
- Visualize Data: Select a spectrum in the list and look at the automatic preview on the right, or click the "Plot" button for zooming and panning. A Matplotlib window will appear showing the spectrum. Take a look at it, then close the Matplotlib window and return to the main GUI panel
- Modify Spectra: Open the "Spectra manipulation" panel located in the "Preview" frame and activate a task, for example the "Add noise". Confirm the selection (button "Confirm") with the default noise value, then in the main GUI click "Preview Spec." to see the processed selected spectrum. If you are satisfied and want to save this noisy spectrum, click to "Process Selected". To apply the task for all the spectra, click "Process all"
- The "Spectra manipulation" button in the main GUI now has an annoying red color, meaning that at least one task is activated. Why this is so important? Because if you want to perform any of the Spectral Analysis tasks you should remember that the activated tasks in the "Spectra manipulation" panel are modifying your original spectra and this modified version is passed to the "Spectral analysis" frame. So, open the "Spectra manipulation" frame, deselect the "Add noise" task and confirm this choice
- In the main panel, activate the "Line-strength analysis" task and open the parameter window by pressing the button "Line-strength parameters". There, make sure the "Lick/IDS indices" option is selected (it is by default). Enter the redshift of the galaxy (0.00449) and confirm the parameters. Now, select the "line28.fits" spectrum in the listbox and preview the results of the analysis by pressing the "Preview result" button. The available Lick/IDS indices will be shown in the Matplotlib window and a second plot will appear showing the position of the galaxy in the index-index grid built from the SSP models of Thomas et al., 2011. In the output window you will see also the luminosity-weighted age, metallicity and alpha-enhancment calculated for this spectrum. If this is cool, apply the task to all the spectra by pressing the "Process all" button. If you also want the plots of the preview mode to be saved, activate the "Save spectral analysis plots" checkbox at the bottom of the GUI. SPAN now will work for you. Grab a coffee and wait for the task to terminate. The results will be stored in ASCII files in the "SPAN_results/line-strength_analysis/" folder. The plots will be saved as PNG images in the "SPAN_results/plots/" folder.
## Troubleshooting & FAQ
1. **I cannot load any spectra because SPAN always complains. What's wrong?**
Well, this is a quite general question. Here I give you some advices:
a) If you want to load just one spectrum, load it directly without generating a spectra list, but activate the "I browsed a single spectrum" option before pressing the "Load!" button
b) If you have a spectra list file which has not been generated by SPAN, check its format. Remember that the first line should contain a comment (#comment), then you need to list the absolute path and the full name of your spectra, unless they are stored in a subfolder of SPAN: in this case also the relative path is good
c) Check the architecture of your spectra. Due to the fact that astronomers rarely agrees with each others, there are plenty of spectra formats out there. SPAN tries to consider all, but it may fail. Try with different spectra to see if the problem persists.
2. **Why do I see a weird wavelength scale in my loaded spectra?**
SPAN will always show the wavelength scale of the plots in Angstrom (A). If the "Plot" button will show you a strange wavelength range of your spectra, you likely selected a wrong wavelength unit scale. In order to be as general as possible and account to the many creative ways that astronomers have to define the wavelength units and keywords in the spectra, SPAN doesn't even try to guess it. You should set manually in the "Wavelength of the spectra is in:" option in the "Prepare and load spectra" frame. Of course, all the spectra in your list should share a common wavelength units (but they can be both logarithmically and linearly binned).
If the problem persists, it is possible that your spectra have "fancier" wavelength units and cannot be properly read by the program. The available wavelength units handled by SPAN are Angstrom (A), nanometers (nm) and micrometers (mu). If your spectra use different wavelength units, SPAN cannot read them.
3. **How do I load just one spectrum?**
If you want to work with just one spectrum, you DO NOT need a spectra list. Simply browse your spectrum and activate the checkbox "I browsed a single spectrum". Set the correct wavelength units and click "Load!".
4. **How do I handle a lot of spectra stored in different folders and within a lot of non spectra files?**
There is a simple answer for that. The "Generate spectra list containing 1D spectra" will scan the selected folder and all the relative sub-folders looking for fits, .txt and .dat files. You just need to put all your spectra in this root folder, which can contain as many subfolders as you want. Then, once you load this spectra list, SPAN will recognize automatically which file is a spectrum and which not and will delete from the listbox all non valid spectra. Anyway, I advice you to create working folder or subfolders as clean as possible from non spectra files.
5. **How do I reset the parameters and the tasks if I played for so long that the entropy of SPAN now tends to infinite?**
Don't panic! Click "Edit → Clear All Tasks" to deactivate all the tasks, or a more aggressive "File → Restore Default Parameters" to restore the default parameters.
6. **Can I save and reload my custom parameters?**
Yes! Use "File → Save Parameters..." and "File → Load Parameters...".
7. **Where do my processed spectra and analysis results are saved?**
Outputs are stored in the:
```bash
SPAN_results/
```
folder, whose location is determined by you the first time you open SPAN. You can, of course, change the location of the SPAN_results folder whenever you want, by "Edit → Change result folder...". If you don't remember the location of the folder, try "Edit → Show result folder".
## License
SPAN-GUI is licensed under the non-commercial License.
See the LICENSE file for details.
## Contact & Contributions
Found a bug? Want to suggest a feature?
Drop me an email!
Contact: Daniele Gasparri – daniele.gasparri@gmail.com
Take a look also at my website, if you are interested in astronomy: https://www.danielegasparri.com/
Raw data
{
"_id": null,
"home_page": null,
"name": "span-gui",
"maintainer": null,
"docs_url": null,
"requires_python": ">=3.10",
"maintainer_email": null,
"keywords": "spectral analysis, galaxies, spectral manipulation, linestrength analysis, astronomy, spectral fitting, spectroscopy, data analysis, kinematics, stellar populations",
"author": null,
"author_email": "Daniele Gasparri <daniele.gasparri@gmail.com>",
"download_url": "https://files.pythonhosted.org/packages/82/ed/9b766d9c3a0e881d64c5c2f94213507167d60383177941e1378d2b8f2214/span_gui-7.1.1.tar.gz",
"platform": null,
"description": "# SPAN: Spectral Analysis Software\r\n\r\n\ud83d\udcd6 **Author:** Daniele Gasparri \r\n\ud83d\udcc5 **Latest Release:** October 2025 \r\n\r\n\r\n\r\n[](./LICENSE)\r\n[](https://span-gui.readthedocs.io/en/latest/)\r\n[](https://arxiv.org/abs/2508.01923)\r\n[](https://doi.org/10.5281/zenodo.17226930)\r\n\r\n\r\n**SPAN is a cross-platform Python GUI software for the extraction, manipulation, and advanced analysis of 1D astronomical spectra in the optical and near-infrared (NIR) ranges, optimized for galaxy studies.**\r\n\r\n\r\n## What\u2019s New in SPAN 7.1\r\n\r\n- Expanded and improved the two component fit of the \"Stellar and gas kinematics\" task, which is now available both for the stellar and gas kinematics, with four presets: old-young components, metal rich-metal poor components, all templates, and two templates mode, with custom selection of age and metallicity following the work of Rubino et al. 2021. \r\n- Added interactive analysis modes to the Preview. You can press the key F, E, S, D, I, L, P to enter the Fitting mode, Equivalent width mode, Signal-to-noise mode, Differential wavelength and velocity mode, Integrated line flux mode, Line-peak finding, snaPshot. Draw a region for the F, E, S, I modes or click on two points in the D mode to see the results in the HUD, in the terminal window and to automatically save them in logging files in the \"SPAN_results\" folder. Press again the respective key to exit the selected analysis mode and return back to idle (not applicable to L and P modes, they exit automatically). Press C to cancel all the overlays. Double click resets also zoom and panning.\r\n- Minor bug fixes\r\n\r\nMore from the version 7.X:\r\n\r\n- Interactive Preview frame that shows the selected spectrum directly in the main GUI. In the preview you can:\r\n - Zoom, pan, and reset with trackpad touches and/or mouse left click/scroll buttons.\r\n - Know in real-time wavelength, flux, and S/N on every point of the spectrum.\r\n - Look at rest-frame reference spectral features (OII, HBeta, OIII, HAlpha, CaT) for immediate comparison with your spectrum.\r\n - Manual Redshift Estimation: shift the selected spectrum with right-click and drag to match the spectral features of your spectrum with the reference lines. Reset the shift with double right-click.\r\n- Consistent Zooming (View menu): unified scaling for fonts, widgets, frames, and Preview to fine-tuning the view on screens with different resolution.\r\n- Extended the preliminary check of the loaded spectra with a quick global S/N evaluation and flagging in the listbox (LOW SNR if S/N <= 5), so you can immediately identify problematic spectra.\r\n- Interactive listbox that allows you to:\r\n - Select multiple spectra with mouse dragging or with crtl or shift + click\r\n - The single spectrum or the selected spectra can be reordered or deleted, via right click menu (delete works also with \"Canc\" button).\r\n - You can undo the latest operation (i.e. if you accidentally deleted the wrong spectra).\r\n - If two spectra are selected in the listbox, you can also compare them, via right click --> compare.\r\n - You can save the modified spectra list in \"Edit --> save current spectra list...\".\r\n - Double click on a single spectrum to open an info window with some basic data: name, wavelength range, sampling, mean/median flux, standard deviation and global S/N.\r\n- Markov chain Monte Carlo (MCMC) simulations mode available for stellar parameters estimated with Lick/IDS line-strength analysis, in addition to the griddata linear interpolation and the supervised machine-learning GPR.\r\n- Elliptical (or circular) binning mode for DataCube extraction, allowing you to extract radial spectral bins following the isophotal profiles of your source.\r\n- SPAN now is also available as a standalone self-installing application for Windows systems (10 and 11), without requiring Python.\r\n\r\n\r\n## Attribution\r\n\r\nIf you use this software for your research, please cite [Gasparri et al. (2025)](https://arxiv.org/pdf/2508.01923). The BibTeX entry for the paper is:\r\n\r\n```bash\r\n@ARTICLE{2025arXiv250801923G,\r\n author = {{Gasparri}, Daniele and {Morelli}, Lorenzo and {Battino}, Umberto and {M{\\'e}ndez Abreu}, Jairo and {de Lorenzo-C{\\'a}ceres}, Adriana},\r\n title = \"{SPAN: A cross-platform Python GUI software for optical and near-infrared spectral analysis}\",\r\n journal = {arXiv e-prints},\r\n keywords = {Instrumentation and Methods for Astrophysics, Astrophysics of Galaxies},\r\n year = 2025,\r\n month = aug,\r\n eid = {arXiv:2508.01923},\r\n pages = {arXiv:2508.01923},\r\n doi = {10.48550/arXiv.2508.01923},\r\narchivePrefix = {arXiv},\r\n eprint = {2508.01923},\r\n primaryClass = {astro-ph.IM},\r\n adsurl = {https://ui.adsabs.harvard.edu/abs/2025arXiv250801923G},\r\n adsnote = {Provided by the SAO/NASA Astrophysics Data System}\r\n}\r\n```\r\n\r\n## Overview\r\n\r\n**SPAN is the first cross-platform graphical user interface (GUI) program designed to extract, manipulate and analyze professional astronomical science spectra.** It is optimized for the study of galaxy spectra from the near UV to near-infrared (NIR) atmospheric windows.\r\n\r\nSPAN has been developed to provide users with a simple and clear GUI that integrates the most commonly used tools for manipulation and analysis of stellar and galaxy spectra.\r\nThe goal of SPAN is to make spectral manipulation and analysis faster and simpler in one GUI program, fully cross-platform and user friendly.\r\n\r\n\r\n**Main panel of SPAN as it appears on Windows and Linux systems.*\r\n\r\n## Features\r\n\r\n- **Fully interactive GUI:** No command line required to perform high-level scientific analysis and spectra manipulation \r\n- **Compatibility:** Automatically recognizes a wide range of **FITS and ASCII** spectral formats \r\n- **Spectra extraction:** From reduced long-slit FITS and datacubes FITS, SPAN allows to extract 1D spectra with automatic (e.g. Voronoi) and manual binning options. Native supports for MUSE, CALIFA, WEAVE LIFU, and JWST IFU datacubes is offered. Users can also write and implement their custom routines to support more instruments \r\n- **Spectral manipulation:** More than 20 tasks to manipulate the spectra (e.g cropping, Doppler/z correction, rebinning, smoothing, continuum modelling...) \r\n- **Spectral analysis:** Using built-in routines and relying on state-of-the-art full spectral fitting code (pPXF), SPAN can perform all the powerful spectral analysis tasks of modern astronomy: kinematics, stellar populations studies, line-strength, cross-correlation, line fitting... \r\n- **Batch processing support** for multiple spectra. Optimized to work with a large amount of 1D spectra (e.g. extracted from data cubes) \r\n- **Plotting:** Generates high quality publication grade plots \r\n- **Customizable:** Many parameters can be set to use SPAN for a wide range of science cases \r\n- **Fully cross-platform:** SPAN is optimized and can run on any device and any operating system, including Android (using for example the Pydroid3 app) \r\n- **Stand-alone app for Windows**: SPAN now can also be installed and used as a standard app for Windows 10 and 11 systems, without requiring Python. \r\n\r\n## Fully cross-platform capabilities\r\n\r\nSPAN has been carefully designed and tested to run across different platforms, making it accessible to a wide range of users. While the core functionality remains consistent, there are some minor differences in layout and interaction depending on the operating system:\r\n\r\n- **Windows and Linux**: The interface and functionality are nearly identical. Both platforms provide the full set of tools, including the integrated output frame where progress messages and logs are displayed directly within the GUI.\r\n- **macOS**: On macOS, the overall layout of SPAN remains consistent with Windows/Linux, but the integrated output frame has been removed. During testing, this component significantly slowed down performance on macOS systems, so messages are instead displayed in the standard system terminal. Apart from this adjustment, all features of SPAN work exactly as on other platforms.\r\n- **Android** (via Pydroid3 app): SPAN can also be used on Android devices through the Pydroid3 environment (see the README_ANDROID.txt for instructions). The GUI has been adapted for smaller screens: the classic menu bar is replaced by practical buttons placed at the top and bottom of the panel. Some interactive functions of the Preview and Listbox frames, such as right/left mouse click actions, are not available on touch devices. However, the rest of the functionality remains identical to the desktop versions, making Android a fully usable platform for basic analysis tasks.\r\n\r\nThe images below show the aspect of SPAN on Android and macOS systems.\r\n\r\n\r\n*Main panel of SPAN as it appears on macOS systems. The output messages are shown in the external terminal aligned below the GUI.* \r\n\r\n\r\n*Main panel of SPAN as it appears on Android devices, here displayed on a smartphone screen.* \r\n\r\n## System Requirements\r\n\r\n- Python 3.10+\r\n- Screen resolution of at least 1600x900 px. Optimal resolution: 1920X1080.\r\n- The following dependencies will be automatically installed:\r\n numpy, scipy, astropy, matplotlib, pandas, scikit-learn, scikit-image, PyWavelets, joblib, ppxf, vorbin, certifi, emcee\r\n\r\n## Installation\r\n\r\nYou can install **SPAN** using `pip`:\r\n\r\n```bash\r\npip3 install span-gui\r\n```\r\n\r\n\r\n## Tested Compatibility\r\n\r\nSPAN has been tested with the following spectra:\r\n\r\n- **IRAF generated 1D spectra**\r\n- **SDSS spectra**\r\n- **IRTF (also extended version) spectra**\r\n- **SAURON spectra**\r\n- **X-Shooter library spectra**\r\n- **JWST spectra**\r\n- **MUSE, CALIFA, WEAVE LIFU, and JWST NIRSpec IFU data cubes**\r\n- **(E)MILES, GALAXEV, FSPS SSP templates**\r\n- **ESO reduced spectra products** for optical and NIR spectra\r\n\r\nGenerally speaking, the compatible spectra formats are:\r\n\r\n- Wavelength units must be in Angstrom, nanometers or micrometers, either linear, log or log10 \r\n- 1D fits table with wavelength information stored in the \"CRVAL1\" and \"CDELT1\" keywords \r\n- 2D fits table with wavelength and flux values stored in the primary HDU \r\n- Plain text ASCII files (.txt or .dat) with wavelengths in the first column and flux in the second column \r\n\r\n## Working with Spectra Lists\r\n\r\nSPAN has been optimized to work with a series of n 1D spectra. The spectra are passed to SPAN by creating and loading a spectra list. The spectra list is an ASCII file containing the path of your spectra and can be created with SPAN, using the button **Generate a spectra list containing 1D spectra**. Just select the folder where your spectra are located, confirm the selection, set the wavelength units of your spectra (assuming are the same for all) and then click the **Load!** button.\r\n\r\nA spectra list can be created also manually and should include:\r\n\r\n- absolute paths of spectra, or relative path if your spectra are located in a subfolder of SPAN\r\n- A commented first line (e.g. # Spectrum)\r\n- It can be stored anywhere in your device\r\n\r\nExample file lists are provided in example_files/ folder.\r\n\r\n## Quick Start\r\n\r\nRun SPAN using:\r\n\r\n```bash\r\nspan-gui\r\n```\r\n\r\nOnce launched, select the folder to store the results in your device, then click \"Load!\" in the main GUI to load the example spectra in the listbox and start playing with the GUI.\r\n\r\n## Basic Usage example\r\n\r\n- In the \"Prepare and load spectra\" frame, browse one of the spectra lists contained in the example_files/ folder (e.g. ngc5806_bins.dat). Set the \"Wavelength of the spectra is in:\" to \"A\", then click \"Load!\" \r\n- Visualize Data: Select a spectrum in the list and look at the automatic preview on the right, or click the \"Plot\" button for zooming and panning. A Matplotlib window will appear showing the spectrum. Take a look at it, then close the Matplotlib window and return to the main GUI panel\r\n- Modify Spectra: Open the \"Spectra manipulation\" panel located in the \"Preview\" frame and activate a task, for example the \"Add noise\". Confirm the selection (button \"Confirm\") with the default noise value, then in the main GUI click \"Preview Spec.\" to see the processed selected spectrum. If you are satisfied and want to save this noisy spectrum, click to \"Process Selected\". To apply the task for all the spectra, click \"Process all\"\r\n- The \"Spectra manipulation\" button in the main GUI now has an annoying red color, meaning that at least one task is activated. Why this is so important? Because if you want to perform any of the Spectral Analysis tasks you should remember that the activated tasks in the \"Spectra manipulation\" panel are modifying your original spectra and this modified version is passed to the \"Spectral analysis\" frame. So, open the \"Spectra manipulation\" frame, deselect the \"Add noise\" task and confirm this choice \r\n- In the main panel, activate the \"Line-strength analysis\" task and open the parameter window by pressing the button \"Line-strength parameters\". There, make sure the \"Lick/IDS indices\" option is selected (it is by default). Enter the redshift of the galaxy (0.00449) and confirm the parameters. Now, select the \"line28.fits\" spectrum in the listbox and preview the results of the analysis by pressing the \"Preview result\" button. The available Lick/IDS indices will be shown in the Matplotlib window and a second plot will appear showing the position of the galaxy in the index-index grid built from the SSP models of Thomas et al., 2011. In the output window you will see also the luminosity-weighted age, metallicity and alpha-enhancment calculated for this spectrum. If this is cool, apply the task to all the spectra by pressing the \"Process all\" button. If you also want the plots of the preview mode to be saved, activate the \"Save spectral analysis plots\" checkbox at the bottom of the GUI. SPAN now will work for you. Grab a coffee and wait for the task to terminate. The results will be stored in ASCII files in the \"SPAN_results/line-strength_analysis/\" folder. The plots will be saved as PNG images in the \"SPAN_results/plots/\" folder.\r\n\r\n## Troubleshooting & FAQ\r\n\r\n1. **I cannot load any spectra because SPAN always complains. What's wrong?** \r\n Well, this is a quite general question. Here I give you some advices: \r\n a) If you want to load just one spectrum, load it directly without generating a spectra list, but activate the \"I browsed a single spectrum\" option before pressing the \"Load!\" button \r\n b) If you have a spectra list file which has not been generated by SPAN, check its format. Remember that the first line should contain a comment (#comment), then you need to list the absolute path and the full name of your spectra, unless they are stored in a subfolder of SPAN: in this case also the relative path is good \r\n c) Check the architecture of your spectra. Due to the fact that astronomers rarely agrees with each others, there are plenty of spectra formats out there. SPAN tries to consider all, but it may fail. Try with different spectra to see if the problem persists.\r\n\r\n2. **Why do I see a weird wavelength scale in my loaded spectra?**\r\n SPAN will always show the wavelength scale of the plots in Angstrom (A). If the \"Plot\" button will show you a strange wavelength range of your spectra, you likely selected a wrong wavelength unit scale. In order to be as general as possible and account to the many creative ways that astronomers have to define the wavelength units and keywords in the spectra, SPAN doesn't even try to guess it. You should set manually in the \"Wavelength of the spectra is in:\" option in the \"Prepare and load spectra\" frame. Of course, all the spectra in your list should share a common wavelength units (but they can be both logarithmically and linearly binned).\r\n If the problem persists, it is possible that your spectra have \"fancier\" wavelength units and cannot be properly read by the program. The available wavelength units handled by SPAN are Angstrom (A), nanometers (nm) and micrometers (mu). If your spectra use different wavelength units, SPAN cannot read them.\r\n\r\n3. **How do I load just one spectrum?**\r\n If you want to work with just one spectrum, you DO NOT need a spectra list. Simply browse your spectrum and activate the checkbox \"I browsed a single spectrum\". Set the correct wavelength units and click \"Load!\".\r\n\r\n4. **How do I handle a lot of spectra stored in different folders and within a lot of non spectra files?**\r\n There is a simple answer for that. The \"Generate spectra list containing 1D spectra\" will scan the selected folder and all the relative sub-folders looking for fits, .txt and .dat files. You just need to put all your spectra in this root folder, which can contain as many subfolders as you want. Then, once you load this spectra list, SPAN will recognize automatically which file is a spectrum and which not and will delete from the listbox all non valid spectra. Anyway, I advice you to create working folder or subfolders as clean as possible from non spectra files.\r\n\r\n5. **How do I reset the parameters and the tasks if I played for so long that the entropy of SPAN now tends to infinite?**\r\n Don't panic! Click \"Edit \u2192 Clear All Tasks\" to deactivate all the tasks, or a more aggressive \"File \u2192 Restore Default Parameters\" to restore the default parameters.\r\n\r\n6. **Can I save and reload my custom parameters?**\r\n Yes! Use \"File \u2192 Save Parameters...\" and \"File \u2192 Load Parameters...\".\r\n\r\n7. **Where do my processed spectra and analysis results are saved?**\r\n Outputs are stored in the:\r\n\r\n```bash\r\nSPAN_results/\r\n```\r\n\r\nfolder, whose location is determined by you the first time you open SPAN. You can, of course, change the location of the SPAN_results folder whenever you want, by \"Edit \u2192 Change result folder...\". If you don't remember the location of the folder, try \"Edit \u2192 Show result folder\".\r\n\r\n## License\r\n\r\nSPAN-GUI is licensed under the non-commercial License.\r\nSee the LICENSE file for details.\r\n\r\n## Contact & Contributions\r\n\r\nFound a bug? Want to suggest a feature? \r\nDrop me an email! \r\nContact: Daniele Gasparri \u2013 daniele.gasparri@gmail.com \r\nTake a look also at my website, if you are interested in astronomy: https://www.danielegasparri.com/ \r\n",
"bugtrack_url": null,
"license": "SPAN License\r\n \r\n 1. This software is licensed for non-commercial, academic and personal use only.\r\n 2. The source code may be used and modified for research and educational purposes, \r\n but any modifications must remain for private use unless explicitly authorized \r\n in writing by the original author.\r\n 3. Redistribution of the software in its original, unmodified form is permitted \r\n for non-commercial purposes, provided that this license notice is always included.\r\n 4. Redistribution or public release of modified versions of the source code \r\n is prohibited without prior written permission from the author.\r\n 5. Any user of this software must properly attribute the original author \r\n in any academic work, research, or derivative project.\r\n 6. Commercial use of this software is strictly prohibited without prior \r\n written permission from the author.\r\n \r\n DISCLAIMER:\r\n THIS SOFTWARE IS PROVIDED \"AS IS\", WITHOUT WARRANTY OF ANY KIND, EXPRESS OR IMPLIED, INCLUDING BUT NOT LIMITED TO THE WARRANTIES OF MERCHANTABILITY, FITNESS FOR A PARTICULAR PURPOSE, AND NON-INFRINGEMENT. IN NO EVENT SHALL THE AUTHORS OR COPYRIGHT HOLDERS BE LIABLE FOR ANY CLAIM, DAMAGES, OR OTHER LIABILITY, WHETHER IN AN ACTION OF CONTRACT, TORT, OR OTHERWISE, ARISING FROM, OUT OF, OR IN CONNECTION WITH THE SOFTWARE OR THE USE OR OTHER DEALINGS IN THE SOFTWARE.\r\n \r\n \u00a9 Daniele Gasparri - 2025\r\n ",
"summary": "GUI program for the manipulation and analysis of astronomical spectra in the optical and NIR wavelength ranges.",
"version": "7.1.1",
"project_urls": {
"Homepage": "https://github.com/danielegasparri/span-gui",
"Issue Tracker": "https://github.com/danielegasparri/span-gui/issues"
},
"split_keywords": [
"spectral analysis",
" galaxies",
" spectral manipulation",
" linestrength analysis",
" astronomy",
" spectral fitting",
" spectroscopy",
" data analysis",
" kinematics",
" stellar populations"
],
"urls": [
{
"comment_text": null,
"digests": {
"blake2b_256": "dd6230d9bd09e3f0b30755d6999ca7f7daf666de024adbf419ca161461db3427",
"md5": "b27a5fbd50de43b500a3ab93b88cb64c",
"sha256": "b176759f974a0a9406884842ff0b9857462fac4124d9d12cc9a759141f77f4f0"
},
"downloads": -1,
"filename": "span_gui-7.1.1-py3-none-any.whl",
"has_sig": false,
"md5_digest": "b27a5fbd50de43b500a3ab93b88cb64c",
"packagetype": "bdist_wheel",
"python_version": "py3",
"requires_python": ">=3.10",
"size": 30884232,
"upload_time": "2025-10-15T18:39:30",
"upload_time_iso_8601": "2025-10-15T18:39:30.017356Z",
"url": "https://files.pythonhosted.org/packages/dd/62/30d9bd09e3f0b30755d6999ca7f7daf666de024adbf419ca161461db3427/span_gui-7.1.1-py3-none-any.whl",
"yanked": false,
"yanked_reason": null
},
{
"comment_text": null,
"digests": {
"blake2b_256": "82ed9b766d9c3a0e881d64c5c2f94213507167d60383177941e1378d2b8f2214",
"md5": "c8e45b653db852e0c372cc28473b176c",
"sha256": "516286684cdf670a2a420ee61c13c868cb86b2c407877f9174fde20e4aafa9e6"
},
"downloads": -1,
"filename": "span_gui-7.1.1.tar.gz",
"has_sig": false,
"md5_digest": "c8e45b653db852e0c372cc28473b176c",
"packagetype": "sdist",
"python_version": "source",
"requires_python": ">=3.10",
"size": 30515947,
"upload_time": "2025-10-15T18:39:54",
"upload_time_iso_8601": "2025-10-15T18:39:54.829923Z",
"url": "https://files.pythonhosted.org/packages/82/ed/9b766d9c3a0e881d64c5c2f94213507167d60383177941e1378d2b8f2214/span_gui-7.1.1.tar.gz",
"yanked": false,
"yanked_reason": null
}
],
"upload_time": "2025-10-15 18:39:54",
"github": true,
"gitlab": false,
"bitbucket": false,
"codeberg": false,
"github_user": "danielegasparri",
"github_project": "span-gui",
"travis_ci": false,
"coveralls": false,
"github_actions": false,
"lcname": "span-gui"
}
