# stackview 🧊👀
[](https://pypi.org/project/stackview)
[](https://anaconda.org/conda-forge/stackview)
[](https://github.com/haesleinhuepf/stackview/graphs/contributors)
[](https://pypistats.org/packages/stackview)
[](https://github.com/haesleinhuepf/stackview/)
[](https://github.com/haesleinhuepf/stackview/)
[](https://github.com/haesleinhuepf/stackview/raw/main/LICENSE)
Interactive image stack viewing in jupyter notebooks based on
[ipycanvas](https://ipycanvas.readthedocs.io/) and
[ipywidgets](https://ipywidgets.readthedocs.io/en/latest/).
TL;DR:
```python
stackview.curtain(image, labels, continuous_update=True)
```
## Installation
stackview can be installed using conda or pip.
```
conda install -c conda-forge stackview
```
OR
```
pip install stackview
```
If you run the installation from within a notebook, you need to restart Jupyter (not just the kernel), before you can use stackview.
## Usage
You can use `stackview` from within jupyter notebooks as shown below.
Also check out the demo in [](https://mybinder.org/v2/gh/haesleinhuepf/stackview/HEAD?filepath=docs%2Fdemo.ipynb)
There is also a notebook demonstrating [how to use stackview in Google Colab](https://colab.research.google.com/github/haesleinhuepf/stackview/blob/master/docs/colab_clesperanto_demo.ipynb).
More example notebooks can be found in [this folder](https://github.com/haesleinhuepf/stackview/tree/main/docs).
Starting point is a 3D image dataset provided as numpy array.
```python
from skimage.io import imread
image = imread('data/Haase_MRT_tfl3d1.tif', plugin='tifffile')
```
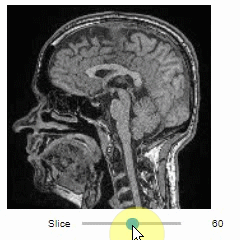
### Slice view
You can then view it slice-by-slice:
```python
import stackview
stackview.slice(image, continuous_update=True)
```
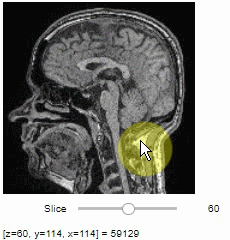
### Pick intensities
To read the intensity of pixels where the mouse is moving, use the picker.
```python
stackview.picker(image)
```
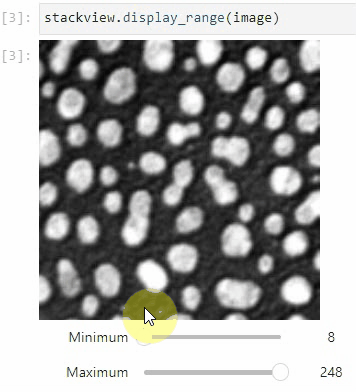
### Display range
To adjust the minimum and maximum intensity shown when displaying an image, use the `display_range` function.
```python
stackview.display_range(image)
```
### Static insight views
The `insight` function turns a numpy-array into a numpy-compatible array that has an image-display in jupyter notebooks.
```python
stackview.insight(image[60])
```
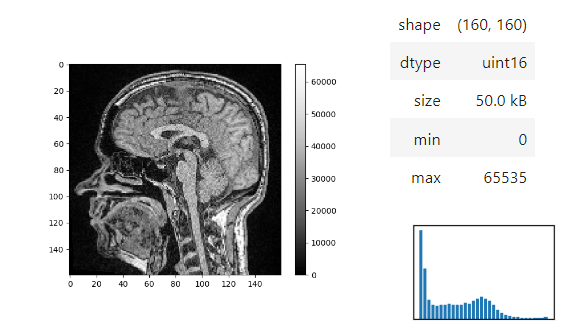
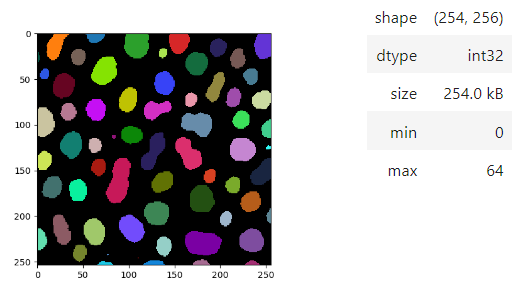
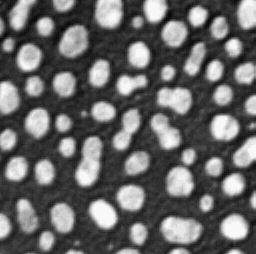
Images of 32-bit and 64-bit type integer are displayed as labels.
```python
blobs = imread('data/blobs.tif')
labels = label(blobs > 120)
stackview.insight(labels)
```
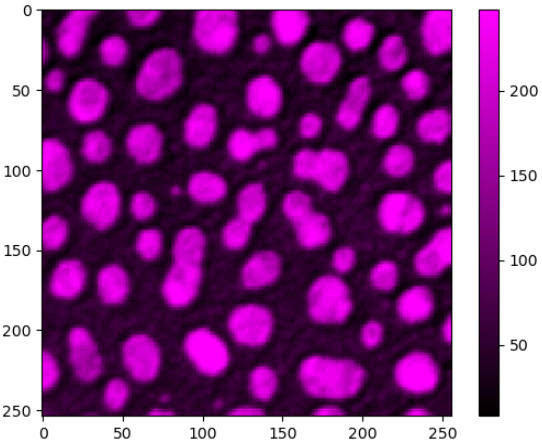
### matplotlib-like imshow
To visualize images with more flexibility, there is `imshow`, which works similar like matplotlib's imshow and yet adds more flexibily, e.g. when it comes to colormaps. It supports `pure...` colormaps introduced in [microfilm](https://github.com/guiwitz/microfilm).
```python
stackview.imshow(image, axes=True, colorbar=True, colormap='pure_magenta')
```
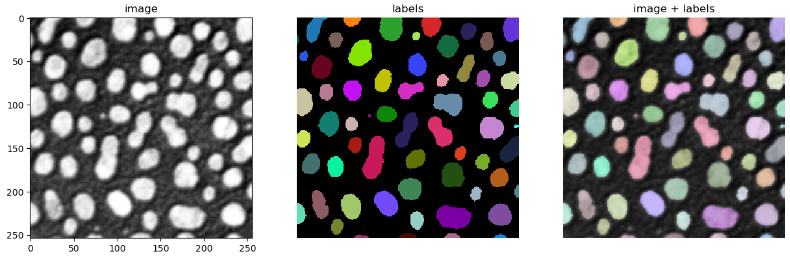
... or drawing label images.
```python
import matplotlib.pyplot as plt
fig, axs = plt.subplots(1, 3, figsize=(15,15))
stackview.imshow(image, plot=axs[0], title='image', axes=True)
stackview.imshow(labels, plot=axs[1], title='labels')
stackview.imshow(image, plot=axs[2], continue_drawing=True)
stackview.imshow(labels, plot=axs[2], alpha=0.4, title='image + labels')
```
### Static animations
The `animate` and `animate_curtain` functions can be used to store animations of image stacks / images blended over each other as gif to disk.
```python
stackview.animate(blobs_images, frame_delay_ms=50)
```
```python
stackview.animate_curtain(blobs, blobs > 128)
```

### Annotate regions
To create label images interactively, e.g. for machine learning training, the `stackview.annotate` function offers basic label drawing tools.
Click and drag for drawing. Hold the `ALT` key for erasing.
Annotations are drawn into a `labels` image you need to create before drawing.
```python
import numpy as np
labels = np.zeros(image.shape).astype(np.uint32)
stackview.annotate(image, labels)
```
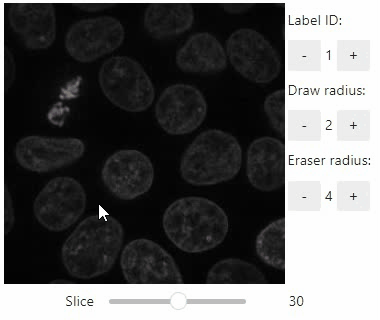
Note: In case the interface is slow, consider using smaller images, e.g. by cropping or resampling.
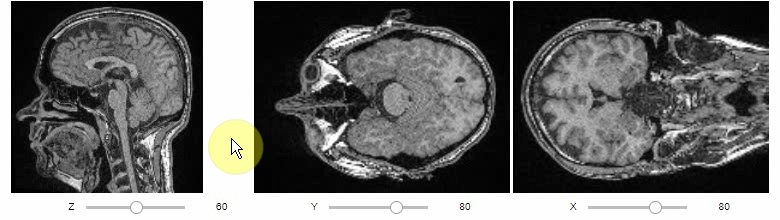
### Orthogonal view
Orthogonal views are also available:
```python
stackview.orthogonal(image)
```
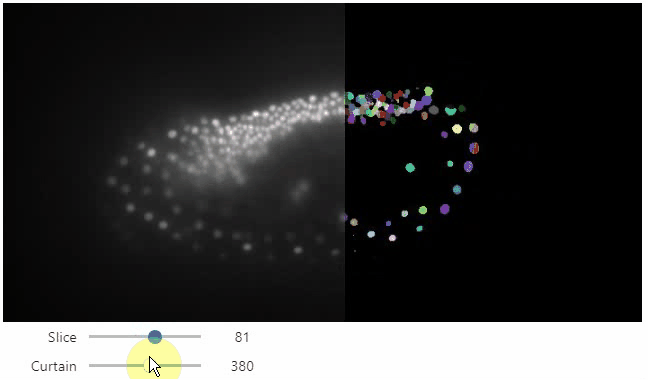
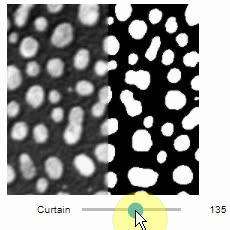
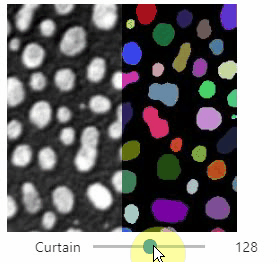
### Curtain
Furthermore, to visualize an original image in combination with a processed version, a curtain view may be helpful:
```python
stackview.curtain(image, modified_image * 65537)
```
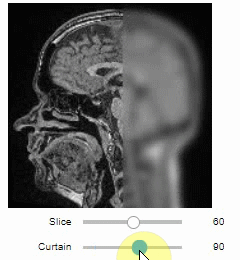
The curtain also works with 2D data.
Btw. to visualize both images properly, you need adjust their grey value range yourself.
For example, multiply a binary image with 255 so that it visualizes nicely side-by-side with the original image in 8-bit range:
```python
binary = (slice_image > threshold_otsu(slice_image)) * 255
stackview.curtain(slice_image, binary)
```
The same also works with label images
```python
from skimage.measure import label
labels = label(binary)
stackview.curtain(slice_image, labels)
```
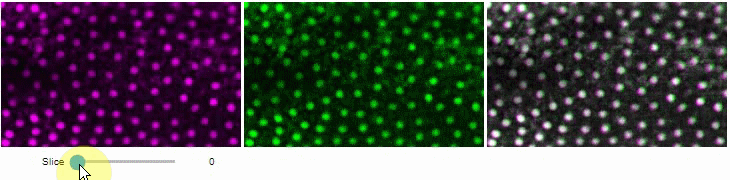
### Side-by-side view
A side-by-side view for colocalization visualization is also available.
If you're working with time-lapse data, you can also use this view for visualizing differences between timepoints:
```python
stackview.side_by_side(image_stack[1:], image_stack[:-1])
```
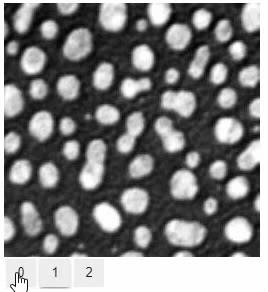
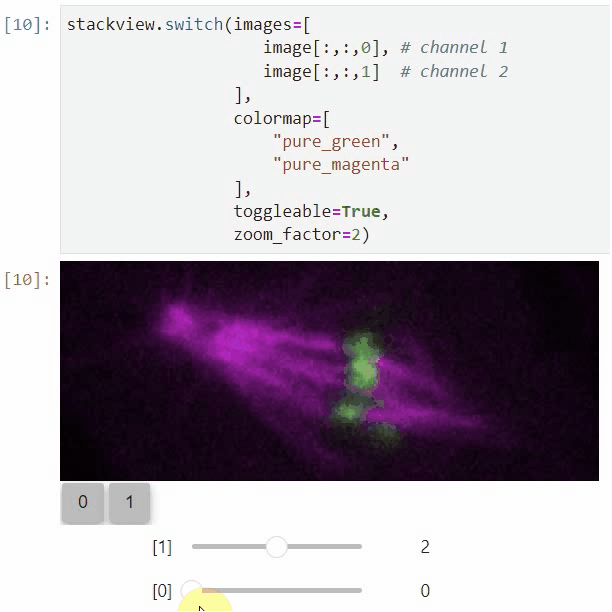
### Switch
The `switch` function allows to switch between a list or dictionary of images.
```
stackview.switch([
slice_image,
binary,
labels
])
```
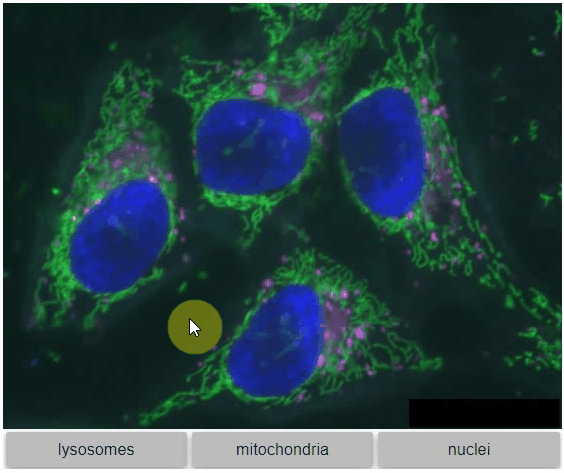
### Switch toggleable
You can also view multiple channels with different colormaps at the same time using the `toggleable` parameter of `switch`.
It is recommended to also pass a list of colormaps. Colormap names can be taken from [Matplotlib](https://matplotlib.org/stable/tutorials/colors/colormaps.html) and stackview aims at compatibility with [microfilm](https://github.com/guiwitz/microfilm).
```
hela_cells = imread("data/hela-cells.tif")
stackview.switch(
{"lysosomes": hela_cells[:,:,0],
"mitochondria":hela_cells[:,:,1],
"nuclei": hela_cells[:,:,2]
},
colormap=["pure_magenta", "pure_green", "pure_blue"],
toggleable=True
)
```
### nD-Viewer
You can also use all functions above with n-dimensional data (since stackview 0.10.0). You will then see multiple sliders for navigating through dimensions such as space and time.
In case you work with multiple channels, using `stackview.switch()` with `toggleable=True` is recommended ([Read more](https://github.com/haesleinhuepf/stackview/blob/main/docs/nd-data.ipynb)).
### Crop
You can crop images interactively:
```python
crop_widget = stackview.crop(image_stack)
crop_widget
```
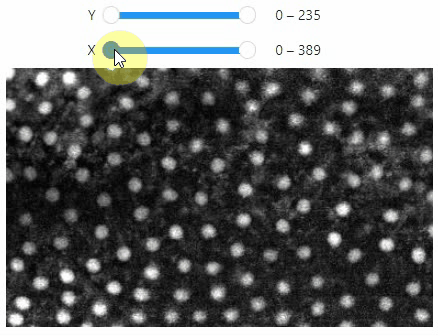
... and retrieve the crop range as a tuple of `slice` objects:
```python
r = crop_widget.range
r
```
Output:
```
(slice(0, 40, 1), slice(40, 80, 1), slice(80, 120, 1))
```
... or you can crop the image directly:
```python
cropped_image = crop_widget.crop()
cropped_image.shape
```
Output:
```
(40, 40, 40)
```
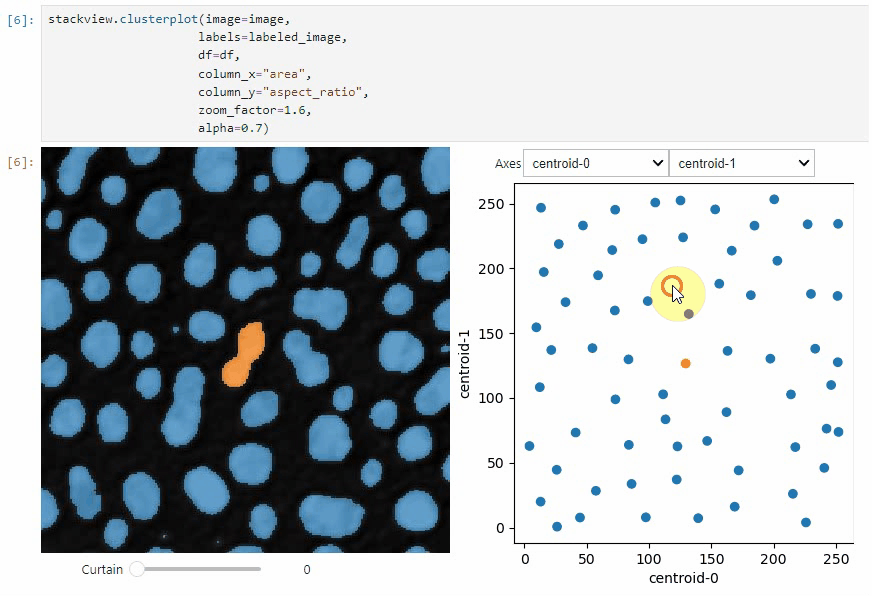
### scatterplot and clusterplot
Using `stackview.scatterplot()` you can create interactive plots for pandas DataFrames ([full example](https://github.com/haesleinhuepf/stackview/blob/main/docs/scatterplot.ipynb)).
```python
stackview.scatterplot(df, 'area', 'feret_diameter_max', "selection", figsize=(5,4))
```
If you want to visualize such a DataFrame side-by-side with the label image its measurements belong to, you can use the
`clusterplot`:
```python
stackview.clusterplot(image=image,
labels=labeled_image,
df=df,
column_x="area",
column_y="aspect_ratio",
zoom_factor=1.6,
alpha=0.7)
```
This functionality is inspired from the [napari-clusters-plotter](https://github.com/BiAPoL/napari-clusters-plotter).
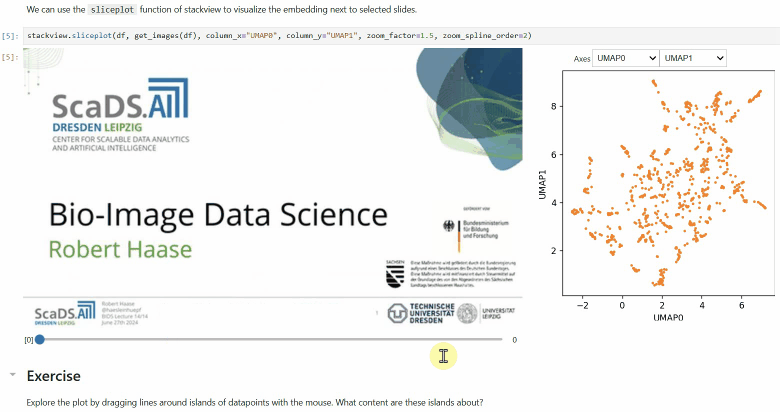
### Sliceplot
Another similar interactive plot is the `sliceplot`: In case you have a pandas DataFrame with a columns representing measurements of slices in an image stack, you can use this function to visualize the slices in a plot.
```python
stackview.sliceplot(df, images, column_x="UMAP0", column_y="UMAP1")
```
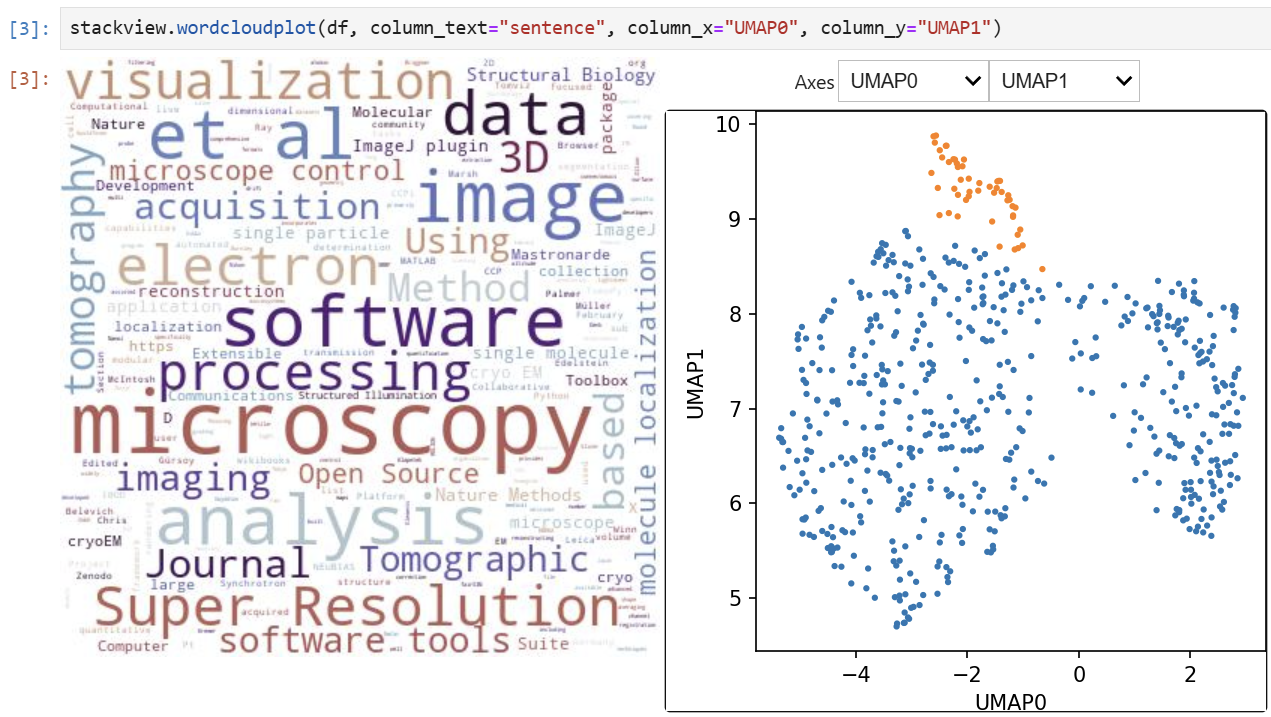
### Wordcloudplot
If you have a pandas DataFrame with a column containing text and additionally numeric columns related to the text, you can use the `wordcloudplot` function to visualize selected texts in a wordcloud.
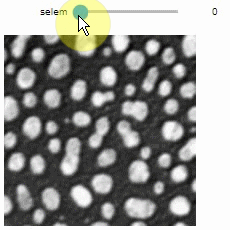
### Interact
Exploration of the parameter space of image processing functions is available using `interact`:
```python
from skimage.filters.rank import maximum
stackview.interact(maximum, slice_image)
```
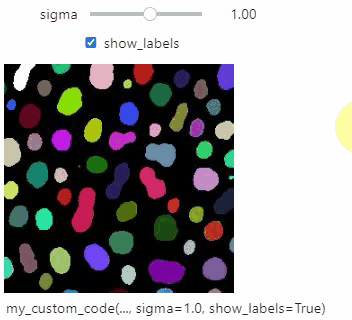
This might be useful for custom functions implementing image processing workflows:
```python
from skimage.filters import gaussian, threshold_otsu, sobel
def my_custom_code(image, sigma:float = 1, show_labels: bool = True):
sigma = abs(sigma)
blurred_image = gaussian(image, sigma=sigma)
binary_image = blurred_image > threshold_otsu(blurred_image)
edge_image = sobel(binary_image)
if show_labels:
return label(binary_image)
else:
return edge_image * 255 + image
stackview.interact(my_custom_code, slice_image)
```
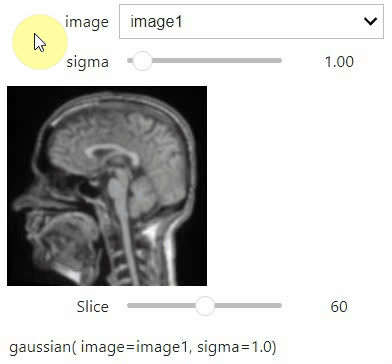
If you want to use a pulldown for selecting input image(s), you need to pass a dictionary of `(name, image)` pairs as `context`, e.g. `context=globals()`:
```python
image1 = imread("data/Haase_MRT_tfl3d1.tif")
image2 = image1[:,:,::-1]
stackview.interact(gaussian, context=globals())
```
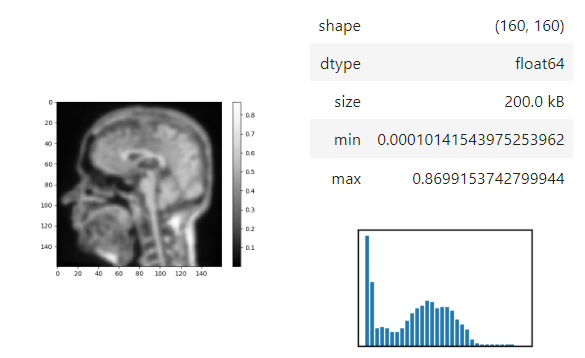
To add an `insight`-view automatically to results of functions, you can add this.
```python
@jupyter_displayable_output
def my_gaussian(image, sigma):
return gaussian(image, sigma)
my_gaussian(image[60], 2)
```
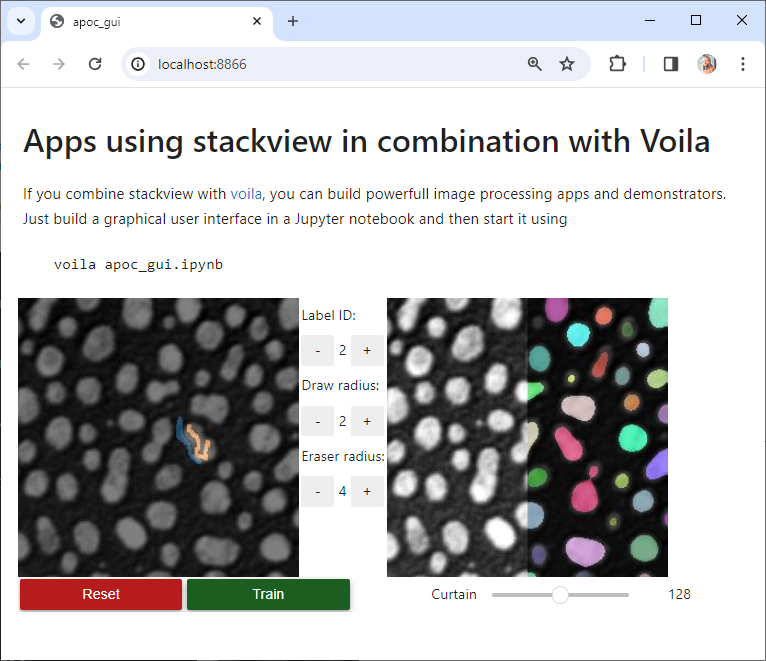
## Voila
If you combine stackview with [voila](https://voila.readthedocs.io/en/stable/), you can build powerful, interactive, browser-based image processing apps and demonstrators. Just build a graphical user interface in a Jupyter notebook and then start it using
## Contributing
Contributions, bug-reports and ideas for further development are very welcome.
## License
Distributed under the terms of the [BSD-3] license,
"stackview" is free and open source software
## Issues
If you encounter any problems, please create a thread on [image.sc] along with a detailed description and tag [@haesleinhuepf].
## See also
There are other libraries doing similar stuff
* [ipyannotations](https://github.com/janfreyberg/ipyannotations)
* [napari](https://github.com/napari/napari)
* [JNI's Volume Viewer based on Matplotlib](https://github.com/jni/mpl-volume-viewer)
* [Holoviz hvPlot](https://hvplot.holoviz.org/user_guide/Gridded_Data.html#n-d-plots)
* [magicgui](https://github.com/napari/magicgui)
* [ipywidgets interact](https://ipywidgets.readthedocs.io/en/latest/examples/Using%20Interact.html)
* [ipyvolume](https://github.com/widgetti/ipyvolume/)
[BSD-3]: http://opensource.org/licenses/BSD-3-Clause
[image.sc]: https://image.sc
[@haesleinhuepf]: https://twitter.com/haesleinhuepf
Raw data
{
"_id": null,
"home_page": "https://github.com/haesleinhuepf/stackview/",
"name": "stackview",
"maintainer": null,
"docs_url": null,
"requires_python": ">=3.6",
"maintainer_email": null,
"keywords": null,
"author": "Robert Haase",
"author_email": "robert.haase@uni-leipzig.de",
"download_url": "https://files.pythonhosted.org/packages/0d/ed/7ea723b0669582e32eee85a4cfe231938ca33f09568b290b27f295b720ac/stackview-0.12.1.tar.gz",
"platform": null,
"description": "# stackview \u00f0\u0178\u00a7\u0160\u00f0\u0178\u2018\u20ac\r\n[](https://pypi.org/project/stackview)\r\n[](https://anaconda.org/conda-forge/stackview)\r\n[](https://github.com/haesleinhuepf/stackview/graphs/contributors)\r\n[](https://pypistats.org/packages/stackview)\r\n[](https://github.com/haesleinhuepf/stackview/)\r\n[](https://github.com/haesleinhuepf/stackview/)\r\n[](https://github.com/haesleinhuepf/stackview/raw/main/LICENSE)\r\n\r\nInteractive image stack viewing in jupyter notebooks based on \r\n[ipycanvas](https://ipycanvas.readthedocs.io/) and \r\n[ipywidgets](https://ipywidgets.readthedocs.io/en/latest/). \r\nTL;DR:\r\n```python\r\nstackview.curtain(image, labels, continuous_update=True)\r\n```\r\n\r\n\r\n## Installation\r\n\r\nstackview can be installed using conda or pip.\r\n\r\n```\r\nconda install -c conda-forge stackview\r\n```\r\n\r\nOR\r\n\r\n```\r\npip install stackview\r\n```\r\n\r\nIf you run the installation from within a notebook, you need to restart Jupyter (not just the kernel), before you can use stackview.\r\n\r\n## Usage\r\nYou can use `stackview` from within jupyter notebooks as shown below.\r\nAlso check out the demo in [](https://mybinder.org/v2/gh/haesleinhuepf/stackview/HEAD?filepath=docs%2Fdemo.ipynb)\r\n\r\nThere is also a notebook demonstrating [how to use stackview in Google Colab](https://colab.research.google.com/github/haesleinhuepf/stackview/blob/master/docs/colab_clesperanto_demo.ipynb).\r\n\r\nMore example notebooks can be found in [this folder](https://github.com/haesleinhuepf/stackview/tree/main/docs).\r\n\r\nStarting point is a 3D image dataset provided as numpy array. \r\n```python\r\nfrom skimage.io import imread\r\nimage = imread('data/Haase_MRT_tfl3d1.tif', plugin='tifffile')\r\n```\r\n\r\n### Slice view\r\n\r\nYou can then view it slice-by-slice:\r\n```python\r\nimport stackview\r\nstackview.slice(image, continuous_update=True)\r\n```\r\n\r\n\r\n### Pick intensities\r\n\r\nTo read the intensity of pixels where the mouse is moving, use the picker.\r\n```python\r\nstackview.picker(image)\r\n```\r\n\r\n\r\n### Display range\r\n\r\nTo adjust the minimum and maximum intensity shown when displaying an image, use the `display_range` function.\r\n```python\r\nstackview.display_range(image)\r\n```\r\n\r\n\r\n\r\n\r\n\r\n### Static insight views\r\n\r\nThe `insight` function turns a numpy-array into a numpy-compatible array that has an image-display in jupyter notebooks.\r\n\r\n```python\r\nstackview.insight(image[60])\r\n```\r\n\r\n\r\n\r\nImages of 32-bit and 64-bit type integer are displayed as labels. \r\n\r\n```python\r\nblobs = imread('data/blobs.tif')\r\nlabels = label(blobs > 120)\r\n\r\nstackview.insight(labels)\r\n```\r\n\r\n\r\n\r\n### matplotlib-like imshow\r\n\r\nTo visualize images with more flexibility, there is `imshow`, which works similar like matplotlib's imshow and yet adds more flexibily, e.g. when it comes to colormaps. It supports `pure...` colormaps introduced in [microfilm](https://github.com/guiwitz/microfilm).\r\n\r\n```python\r\nstackview.imshow(image, axes=True, colorbar=True, colormap='pure_magenta')\r\n```\r\n\r\n\r\n\r\n... or drawing label images. \r\n\r\n```python\r\nimport matplotlib.pyplot as plt\r\nfig, axs = plt.subplots(1, 3, figsize=(15,15))\r\n\r\nstackview.imshow(image, plot=axs[0], title='image', axes=True)\r\nstackview.imshow(labels, plot=axs[1], title='labels')\r\n\r\nstackview.imshow(image, plot=axs[2], continue_drawing=True)\r\nstackview.imshow(labels, plot=axs[2], alpha=0.4, title='image + labels')\r\n```\r\n\r\n\r\n\r\n\r\n### Static animations\r\n\r\nThe `animate` and `animate_curtain` functions can be used to store animations of image stacks / images blended over each other as gif to disk.\r\n\r\n```python\r\nstackview.animate(blobs_images, frame_delay_ms=50)\r\n```\r\n\r\n\r\n\r\n```python\r\nstackview.animate_curtain(blobs, blobs > 128)\r\n```\r\n\r\n\r\n\r\n### Annotate regions\r\n\r\nTo create label images interactively, e.g. for machine learning training, the `stackview.annotate` function offers basic label drawing tools. \r\nClick and drag for drawing. Hold the `ALT` key for erasing.\r\nAnnotations are drawn into a `labels` image you need to create before drawing.\r\n\r\n```python\r\nimport numpy as np\r\nlabels = np.zeros(image.shape).astype(np.uint32)\r\n\r\nstackview.annotate(image, labels)\r\n```\r\n\r\n\r\n\r\nNote: In case the interface is slow, consider using smaller images, e.g. by cropping or resampling.\r\n\r\n\r\n\r\n### Orthogonal view\r\n\r\nOrthogonal views are also available:\r\n```python\r\nstackview.orthogonal(image)\r\n```\r\n\r\n\r\n### Curtain\r\n\r\nFurthermore, to visualize an original image in combination with a processed version, a curtain view may be helpful:\r\n```python\r\nstackview.curtain(image, modified_image * 65537)\r\n```\r\n\r\n\r\nThe curtain also works with 2D data. \r\nBtw. to visualize both images properly, you need adjust their grey value range yourself. \r\nFor example, multiply a binary image with 255 so that it visualizes nicely side-by-side with the original image in 8-bit range:\r\n```python\r\nbinary = (slice_image > threshold_otsu(slice_image)) * 255\r\nstackview.curtain(slice_image, binary)\r\n```\r\n\r\n\r\nThe same also works with label images\r\n```python\r\nfrom skimage.measure import label\r\nlabels = label(binary)\r\nstackview.curtain(slice_image, labels)\r\n```\r\n\r\n\r\n\r\n### Side-by-side view\r\n\r\nA side-by-side view for colocalization visualization is also available.\r\nIf you're working with time-lapse data, you can also use this view for visualizing differences between timepoints:\r\n```python\r\nstackview.side_by_side(image_stack[1:], image_stack[:-1])\r\n```\r\n\r\n\r\n### Switch\r\n\r\nThe `switch` function allows to switch between a list or dictionary of images.\r\n\r\n```\r\nstackview.switch([\r\n slice_image,\r\n binary,\r\n labels\r\n])\r\n```\r\n\r\n\r\n\r\n### Switch toggleable\r\n\r\nYou can also view multiple channels with different colormaps at the same time using the `toggleable` parameter of `switch`. \r\nIt is recommended to also pass a list of colormaps. Colormap names can be taken from [Matplotlib](https://matplotlib.org/stable/tutorials/colors/colormaps.html) and stackview aims at compatibility with [microfilm](https://github.com/guiwitz/microfilm).\r\n\r\n```\r\nhela_cells = imread(\"data/hela-cells.tif\")\r\n\r\nstackview.switch(\r\n {\"lysosomes\": hela_cells[:,:,0],\r\n \"mitochondria\":hela_cells[:,:,1],\r\n \"nuclei\": hela_cells[:,:,2]\r\n },\r\n colormap=[\"pure_magenta\", \"pure_green\", \"pure_blue\"],\r\n toggleable=True\r\n)\r\n```\r\n\r\n\r\n\r\n### nD-Viewer\r\n\r\nYou can also use all functions above with n-dimensional data (since stackview 0.10.0). You will then see multiple sliders for navigating through dimensions such as space and time.\r\nIn case you work with multiple channels, using `stackview.switch()` with `toggleable=True` is recommended ([Read more](https://github.com/haesleinhuepf/stackview/blob/main/docs/nd-data.ipynb)).\r\n\r\n\r\n\r\n\r\n### Crop\r\n\r\nYou can crop images interactively:\r\n```python\r\ncrop_widget = stackview.crop(image_stack)\r\ncrop_widget\r\n```\r\n\r\n\r\n\r\n... and retrieve the crop range as a tuple of `slice` objects:\r\n```python\r\nr = crop_widget.range\r\nr\r\n```\r\nOutput:\r\n```\r\n(slice(0, 40, 1), slice(40, 80, 1), slice(80, 120, 1))\r\n```\r\n... or you can crop the image directly:\r\n```python\r\ncropped_image = crop_widget.crop()\r\ncropped_image.shape\r\n```\r\nOutput:\r\n```\r\n(40, 40, 40)\r\n```\r\n\r\n### scatterplot and clusterplot\r\n\r\nUsing `stackview.scatterplot()` you can create interactive plots for pandas DataFrames ([full example](https://github.com/haesleinhuepf/stackview/blob/main/docs/scatterplot.ipynb)).\r\n\r\n```python\r\nstackview.scatterplot(df, 'area', 'feret_diameter_max', \"selection\", figsize=(5,4))\r\n```\r\n\r\nIf you want to visualize such a DataFrame side-by-side with the label image its measurements belong to, you can use the \r\n`clusterplot`:\r\n\r\n```python\r\nstackview.clusterplot(image=image,\r\n labels=labeled_image,\r\n df=df,\r\n column_x=\"area\",\r\n column_y=\"aspect_ratio\", \r\n zoom_factor=1.6,\r\n alpha=0.7)\r\n``` \r\n\r\nThis functionality is inspired from the [napari-clusters-plotter](https://github.com/BiAPoL/napari-clusters-plotter).\r\n\r\n\r\n\r\n### Sliceplot\r\n\r\nAnother similar interactive plot is the `sliceplot`: In case you have a pandas DataFrame with a columns representing measurements of slices in an image stack, you can use this function to visualize the slices in a plot. \r\n\r\n```python\r\nstackview.sliceplot(df, images, column_x=\"UMAP0\", column_y=\"UMAP1\")\r\n```\r\n\r\n\r\n\r\n\r\n### Wordcloudplot\r\n\r\nIf you have a pandas DataFrame with a column containing text and additionally numeric columns related to the text, you can use the `wordcloudplot` function to visualize selected texts in a wordcloud.\r\n\r\n\r\n\r\n### Interact\r\n\r\nExploration of the parameter space of image processing functions is available using `interact`:\r\n```python\r\nfrom skimage.filters.rank import maximum\r\nstackview.interact(maximum, slice_image)\r\n```\r\n\r\n\r\nThis might be useful for custom functions implementing image processing workflows:\r\n```python\r\nfrom skimage.filters import gaussian, threshold_otsu, sobel\r\ndef my_custom_code(image, sigma:float = 1, show_labels: bool = True):\r\n sigma = abs(sigma)\r\n blurred_image = gaussian(image, sigma=sigma)\r\n binary_image = blurred_image > threshold_otsu(blurred_image)\r\n edge_image = sobel(binary_image)\r\n \r\n if show_labels:\r\n return label(binary_image)\r\n else:\r\n return edge_image * 255 + image \r\n\r\nstackview.interact(my_custom_code, slice_image)\r\n```\r\n\r\n\r\nIf you want to use a pulldown for selecting input image(s), you need to pass a dictionary of `(name, image)` pairs as `context`, e.g. `context=globals()`:\r\n\r\n```python\r\nimage1 = imread(\"data/Haase_MRT_tfl3d1.tif\")\r\nimage2 = image1[:,:,::-1]\r\n\r\nstackview.interact(gaussian, context=globals())\r\n```\r\n\r\n\r\n\r\nTo add an `insight`-view automatically to results of functions, you can add this.\r\n\r\n```python\r\n@jupyter_displayable_output\r\ndef my_gaussian(image, sigma):\r\n return gaussian(image, sigma)\r\n\r\nmy_gaussian(image[60], 2)\r\n```\r\n\r\n\r\n\r\n## Voila\r\n\r\nIf you combine stackview with [voila](https://voila.readthedocs.io/en/stable/), you can build powerful, interactive, browser-based image processing apps and demonstrators. Just build a graphical user interface in a Jupyter notebook and then start it using\r\n\r\n\r\n\r\n## Contributing\r\n\r\nContributions, bug-reports and ideas for further development are very welcome.\r\n\r\n## License\r\n\r\nDistributed under the terms of the [BSD-3] license,\r\n\"stackview\" is free and open source software\r\n\r\n## Issues\r\n\r\nIf you encounter any problems, please create a thread on [image.sc] along with a detailed description and tag [@haesleinhuepf].\r\n\r\n## See also\r\nThere are other libraries doing similar stuff\r\n* [ipyannotations](https://github.com/janfreyberg/ipyannotations)\r\n* [napari](https://github.com/napari/napari)\r\n* [JNI's Volume Viewer based on Matplotlib](https://github.com/jni/mpl-volume-viewer)\r\n* [Holoviz hvPlot](https://hvplot.holoviz.org/user_guide/Gridded_Data.html#n-d-plots)\r\n* [magicgui](https://github.com/napari/magicgui)\r\n* [ipywidgets interact](https://ipywidgets.readthedocs.io/en/latest/examples/Using%20Interact.html)\r\n* [ipyvolume](https://github.com/widgetti/ipyvolume/)\r\n\r\n[BSD-3]: http://opensource.org/licenses/BSD-3-Clause\r\n[image.sc]: https://image.sc\r\n[@haesleinhuepf]: https://twitter.com/haesleinhuepf\r\n\r\n",
"bugtrack_url": null,
"license": null,
"summary": "Interactive image stack viewing in jupyter notebooks",
"version": "0.12.1",
"project_urls": {
"Homepage": "https://github.com/haesleinhuepf/stackview/"
},
"split_keywords": [],
"urls": [
{
"comment_text": "",
"digests": {
"blake2b_256": "965cdca40677bef124ff6ec32142c04659b00e00496494d2e1017f20c890dda6",
"md5": "7086be2926efdc8d2a95a5ca8c5e5151",
"sha256": "54f84c873a95854df5518ba775ac917219440081d7f42b8c87cf97c8a52ec8dd"
},
"downloads": -1,
"filename": "stackview-0.12.1-py3-none-any.whl",
"has_sig": false,
"md5_digest": "7086be2926efdc8d2a95a5ca8c5e5151",
"packagetype": "bdist_wheel",
"python_version": "py3",
"requires_python": ">=3.6",
"size": 45211,
"upload_time": "2024-12-05T09:13:44",
"upload_time_iso_8601": "2024-12-05T09:13:44.104906Z",
"url": "https://files.pythonhosted.org/packages/96/5c/dca40677bef124ff6ec32142c04659b00e00496494d2e1017f20c890dda6/stackview-0.12.1-py3-none-any.whl",
"yanked": false,
"yanked_reason": null
},
{
"comment_text": "",
"digests": {
"blake2b_256": "0ded7ea723b0669582e32eee85a4cfe231938ca33f09568b290b27f295b720ac",
"md5": "02e41176401ff21dd8c4011d17f2052d",
"sha256": "9cf3302da38057d2b2f73cb5f1170cf430ee26fcbf0e385a354212c25f4abb4d"
},
"downloads": -1,
"filename": "stackview-0.12.1.tar.gz",
"has_sig": false,
"md5_digest": "02e41176401ff21dd8c4011d17f2052d",
"packagetype": "sdist",
"python_version": "source",
"requires_python": ">=3.6",
"size": 37060,
"upload_time": "2024-12-05T09:13:45",
"upload_time_iso_8601": "2024-12-05T09:13:45.921930Z",
"url": "https://files.pythonhosted.org/packages/0d/ed/7ea723b0669582e32eee85a4cfe231938ca33f09568b290b27f295b720ac/stackview-0.12.1.tar.gz",
"yanked": false,
"yanked_reason": null
}
],
"upload_time": "2024-12-05 09:13:45",
"github": true,
"gitlab": false,
"bitbucket": false,
"codeberg": false,
"github_user": "haesleinhuepf",
"github_project": "stackview",
"travis_ci": false,
"coveralls": false,
"github_actions": true,
"lcname": "stackview"
}

