# STIF
[](https://pypi.org/project/stif/)
[](https://johannes.kopton.org/stif/_static/reports/junit/report.html)
[](https://johannes.kopton.org/stif/_static/reports/htmlcov/index.html)
[](https://johannes.kopton.org/stif/_static/reports/flake8)
"Space-time interpolation and forecasting"
Package for predicting spatio-temporally distributed variables via *space-time regression Kriging*, using numpy and numba.
## Resources
* [Introduction Notebook](https://github.com/johanneskopton/stif/blob/main/docs/introduction.ipynb) <a target="_blank" href="https://colab.research.google.com/github/johanneskopton/stif/blob/main/docs/introduction.ipynb"><img src="https://colab.research.google.com/assets/colab-badge.svg" alt="Open In Colab"/></a>
* [Documentation and API reference](https://johannes.kopton.org/stif)
* [Issue tracker](https://github.com/johanneskopton/stif/issues)
What you can do with this package:
* create space-time variograms (even on very large datasets)
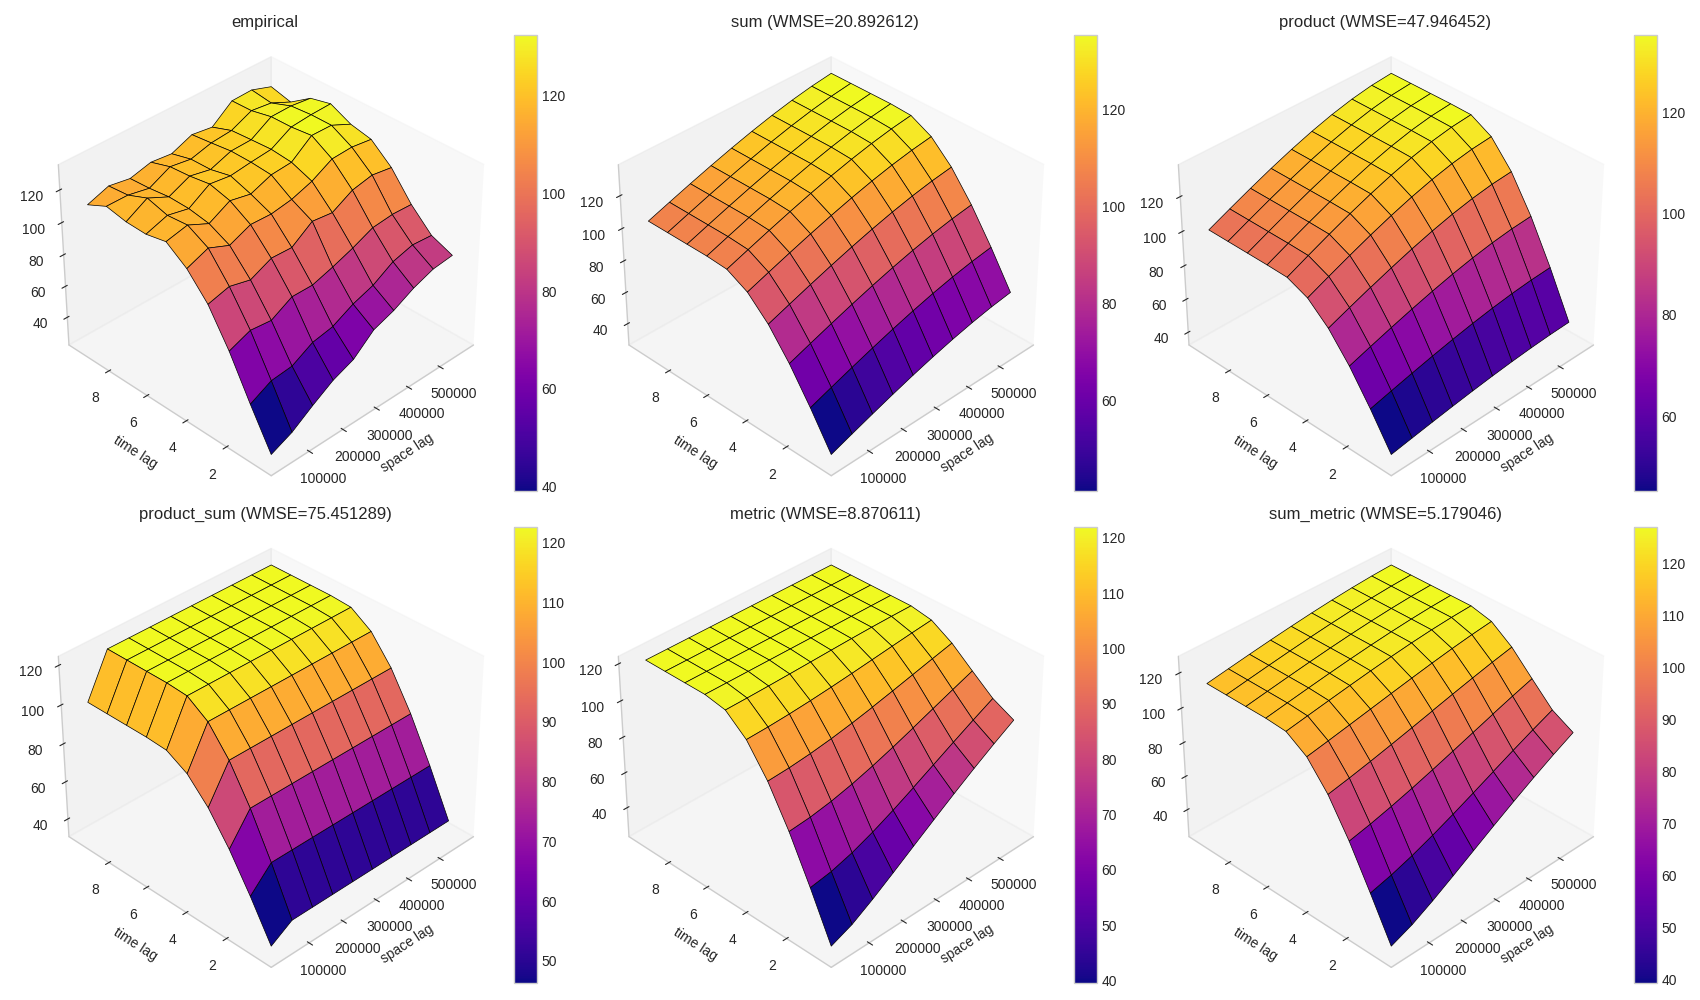
* fit space-time variogram models (e.g. using `product_sum` or `sum_metric` models)
* fit regression models on covariates
* perform space-time variogram Kriging to interpolate/extrapolate from the input data
* do all this with binary (presence/absence) indicators, e.g. for dynamic species distribution modeling
## Examples


## Space-time regression Kriging
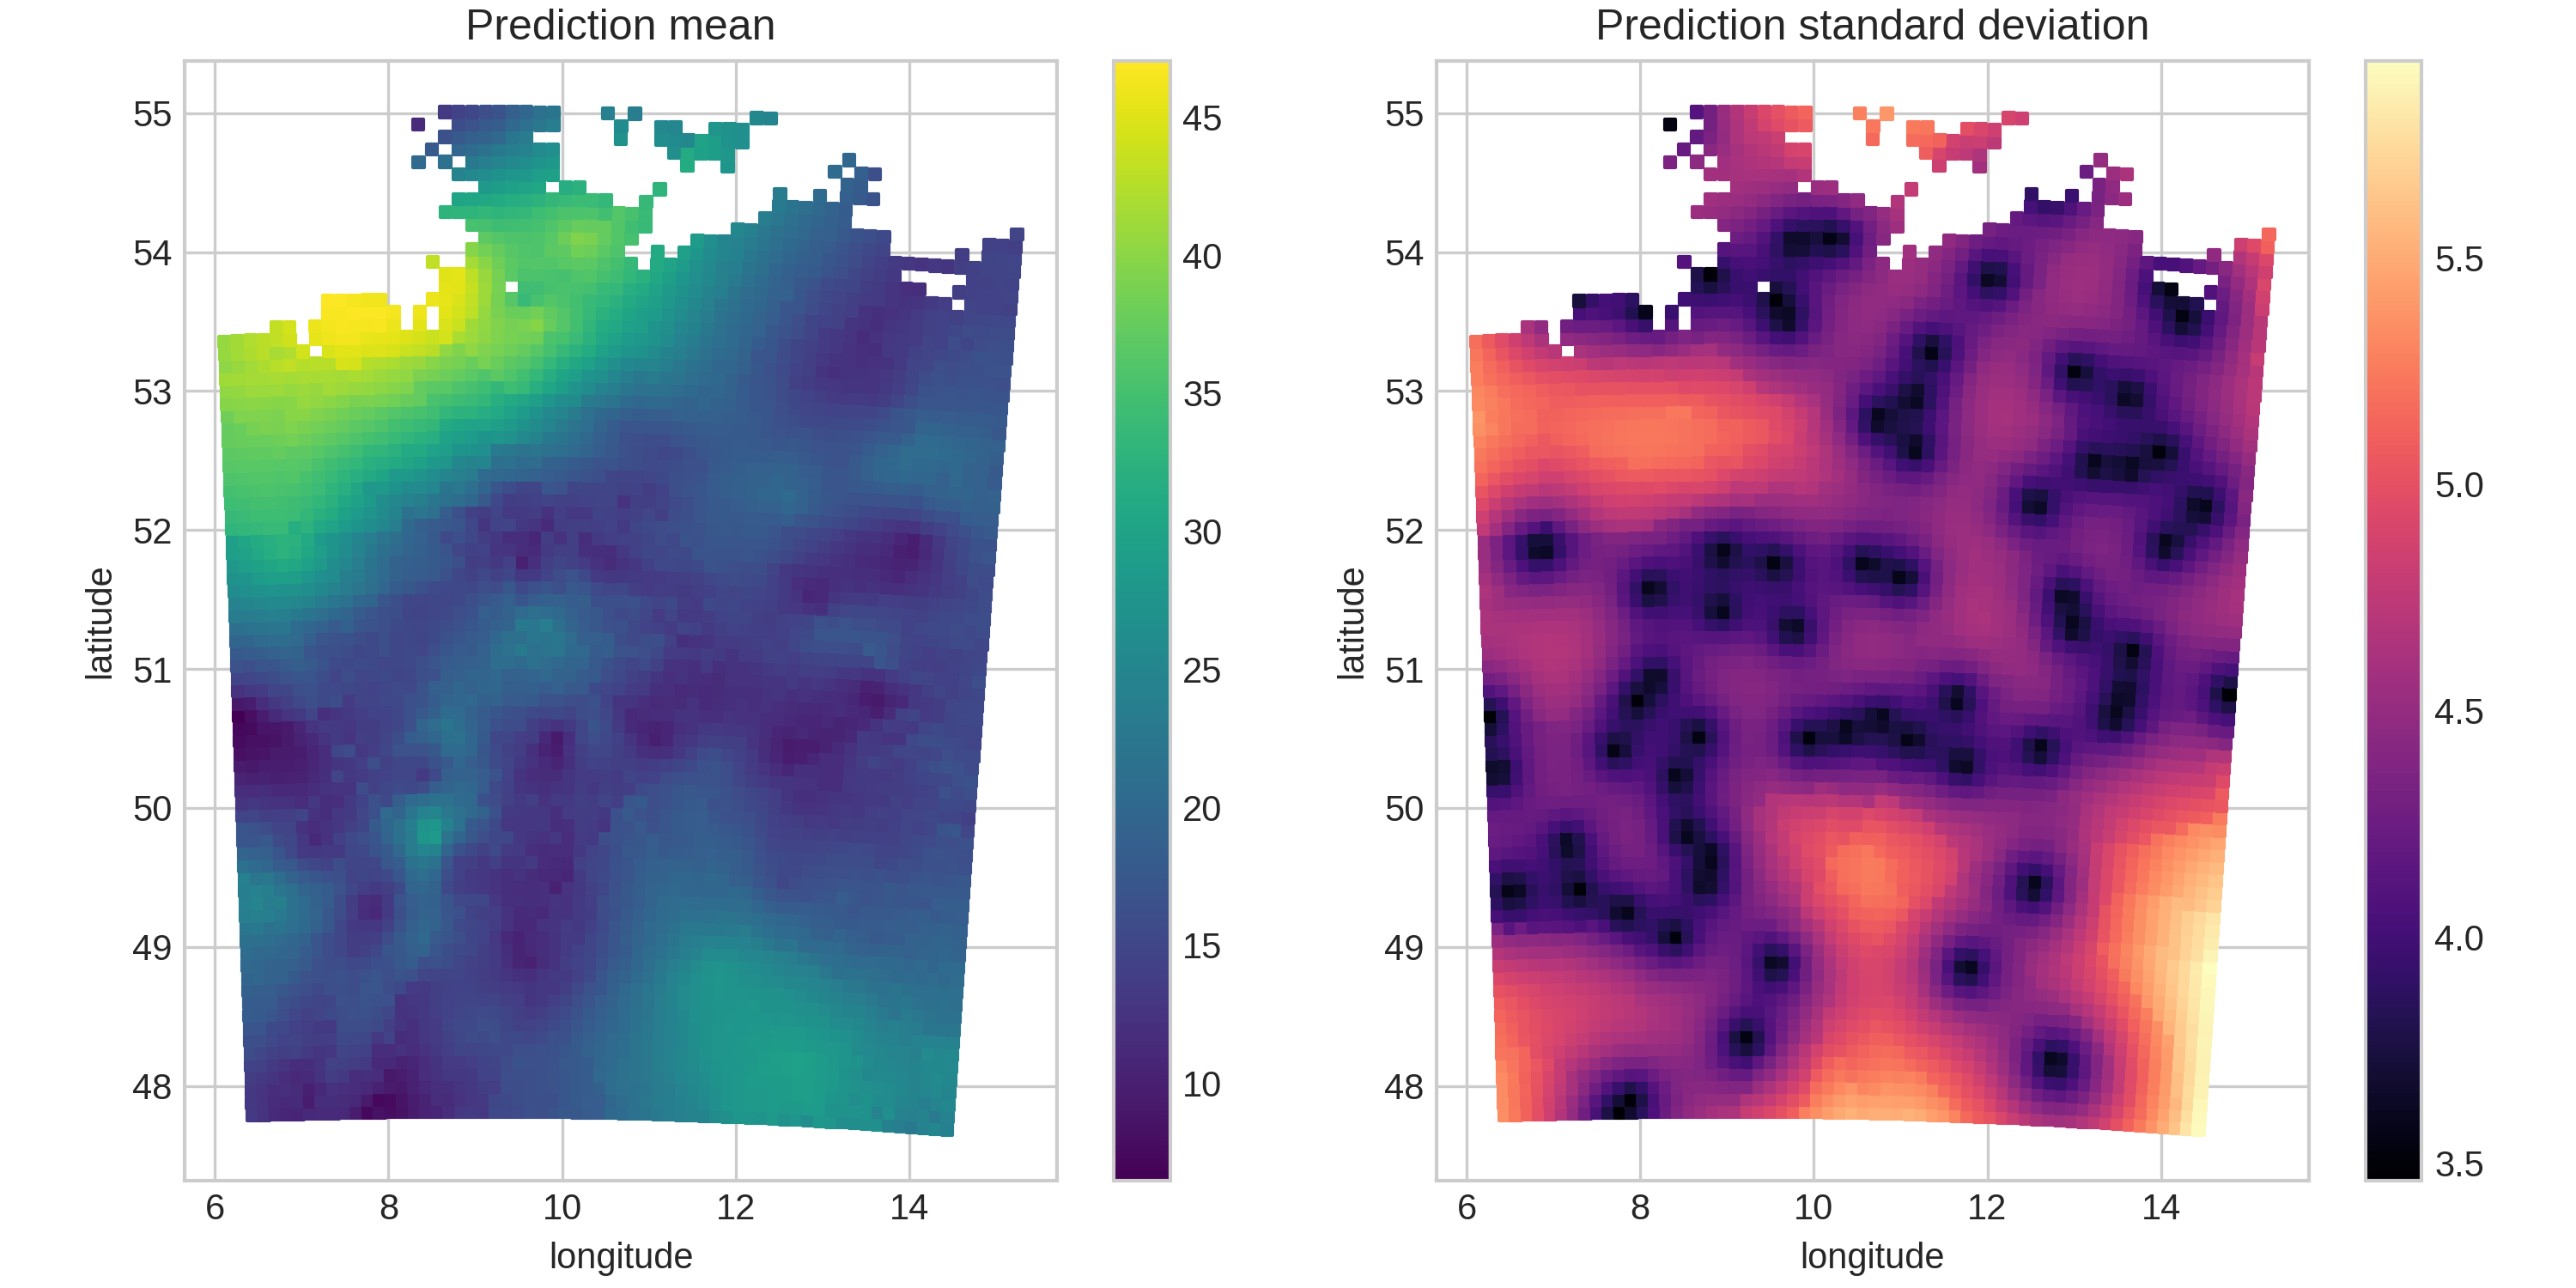
Using this package, you can do _space-time regression Kriging_. But what is it exactly? Imagine you have measurements on different days and distributed over a geographical region (basically a table with latitude, longitude, time and the measured variable of interest). And now you want to estimate the value of this variable at locations and dates, at which you didn't measure. This can be the future (forecasting) or just some day in between, where no measurement was taken (interpolation). You may have some other variables (external covariates), that can explain some of the variation of you variable of interest via some form of regression. In this case, it makes sense to do the Kriging only on the residuals of this regression (i.e. *regression Kriging*). All of this, you can do using this package (and hopefully as simple as possible).
## Why this package?
To my knowledge, there is no other Python package for space-time variogram Kriging on unstructured spatio-temporal data. While the R package [gstat](http://r-spatial.github.io/gstat/) [^1] can do space-time Kriging, there can be problems with large datasets. Furthermore, the R package obviously doesn't play well with the Python ecosystem, e.g. using Keras/tensorflow for the regression part of regression Kriging.
There is the excellent [scikit-gstat](https://github.com/mmaelicke/scikit-gstat) [^2], but as for now it can not create variograms for unstructured spatio-temporal data and I didn't have the time yet to dive into it and add this feature. So perhaps for now, you may find this package useful.
You can also do something like space-time regression Kriging using one of the more mature Gaussian process libraries out there (since Kriging is actually just Gaussian process regression), but they won't provide you with nice variograms and all the other geostats stuff.
<!--
<center><img src="https://raw.githubusercontent.com/johanneskopton/stif/main/docs/source/_static/demo1.gif" alt="Example: PM10 values in Germany" width="500"/></center>
-->
## Installation
Via pip:
```sh
pip install . # for the core package
pip install .[tensorflow] # for using tensorflow/keras models for covariate regression
pip install .[geo] # for using coordinate transformations and geo I/O
pip install .[interactive] # for running the example jupyter notebooks
pip install .[dev] # for all the development tools used in this project
```
## Development
Installing via pip for development:
```sh
pip install -e .[dev]
```
Testing:
```sh
pytest --cov=stif --junitxml=docs/source/_static/reports/junit/junit.xml --html=docs/source/_static/reports/junit/report.html
```
Reports and badges:
```sh
coverage html -d docs/source/_static/reports/htmlcov
coverage xml -o docs/source/_static/reports/coverage.xml
flake8 --statistics --tee --output-file docs/source/_static/reports/flake8stats.txt
flake8 --format=html --htmldir=docs/source/_static/reports/flake8
genbadge tests -i docs/source/_static/reports/junit/junit.xml -o docs/source/_static/tests-badge.svg
genbadge coverage -i docs/source/_static/reports/coverage.xml -o docs/source/_static/coverage-badge.svg
genbadge flake8 -i docs/source/_static/reports/flake8stats.txt -o docs/source/_static/flake8-badge.svg
```
Check dependencies:
```sh
tox
```
Build sphinx documentation:
```sh
sphinx-build -M html docs/source/ docs/build/
```
Build package:
```sh
python -m build
```
Publish package on PyPI:
```sh
twine upload dist/*
```
## Acknowledgements
Heavily inspired by [^3] and the space-time variogram implementation in the R package [gstat](http://r-spatial.github.io/gstat/). Thanks a lot to Sytze de Bruin from Wageningen University for a lot of help with the geostatistics.
[^1]: B. Graeler, E. Pebesma, and G. Heuvelink, “Spatio-Temporal Interpolation using gstat,” The R Journal, vol. 8, pp. 204–218, Jan. 2016, doi: 10.32614/RJ-2016-014.
[^2]: M. Mälicke, “SciKit-GStat 1.0: a SciPy-flavored geostatistical variogram estimation toolbox written in Python,” Geoscientific Model Development, vol. 15, no. 6, pp. 2505–2532, Mar. 2022, doi: 10.5194/gmd-15-2505-2022.
[^3]: G. B. M. Heuvelink, E. Pebesma, and B. Gräler, “Space-Time Geostatistics,” in Encyclopedia of GIS, S. Shekhar, H. Xiong, and X. Zhou, Eds., Cham: Springer International Publishing, 2017, pp. 1919–1926. doi: 10.1007/978-3-319-17885-1_1647.
Raw data
{
"_id": null,
"home_page": "https://github.com/johanneskopton/stif",
"name": "stif",
"maintainer": null,
"docs_url": null,
"requires_python": ">=3.9",
"maintainer_email": null,
"keywords": "geostatistics kriging variogram spatio-temporal",
"author": "Johannes Kopton",
"author_email": "johannes@kopton.org",
"download_url": "https://files.pythonhosted.org/packages/34/e3/f2460e77baeda87a90c7135f54e452aba4afde542c245f62602edac67d39/stif-1.0.1.tar.gz",
"platform": null,
"description": "# STIF\n\n[](https://pypi.org/project/stif/)\n[](https://johannes.kopton.org/stif/_static/reports/junit/report.html)\n[](https://johannes.kopton.org/stif/_static/reports/htmlcov/index.html)\n[](https://johannes.kopton.org/stif/_static/reports/flake8)\n\n\"Space-time interpolation and forecasting\"\n\nPackage for predicting spatio-temporally distributed variables via *space-time regression Kriging*, using numpy and numba.\n\n## Resources\n\n* [Introduction Notebook](https://github.com/johanneskopton/stif/blob/main/docs/introduction.ipynb) <a target=\"_blank\" href=\"https://colab.research.google.com/github/johanneskopton/stif/blob/main/docs/introduction.ipynb\"><img src=\"https://colab.research.google.com/assets/colab-badge.svg\" alt=\"Open In Colab\"/></a>\n* [Documentation and API reference](https://johannes.kopton.org/stif)\n* [Issue tracker](https://github.com/johanneskopton/stif/issues)\n\nWhat you can do with this package:\n\n* create space-time variograms (even on very large datasets)\n* fit space-time variogram models (e.g. using `product_sum` or `sum_metric` models)\n* fit regression models on covariates\n* perform space-time variogram Kriging to interpolate/extrapolate from the input data\n* do all this with binary (presence/absence) indicators, e.g. for dynamic species distribution modeling\n\n## Examples\n\n\n\n\n\n## Space-time regression Kriging\nUsing this package, you can do _space-time regression Kriging_. But what is it exactly? Imagine you have measurements on different days and distributed over a geographical region (basically a table with latitude, longitude, time and the measured variable of interest). And now you want to estimate the value of this variable at locations and dates, at which you didn't measure. This can be the future (forecasting) or just some day in between, where no measurement was taken (interpolation). You may have some other variables (external covariates), that can explain some of the variation of you variable of interest via some form of regression. In this case, it makes sense to do the Kriging only on the residuals of this regression (i.e. *regression Kriging*). All of this, you can do using this package (and hopefully as simple as possible).\n\n\n## Why this package?\nTo my knowledge, there is no other Python package for space-time variogram Kriging on unstructured spatio-temporal data. While the R package [gstat](http://r-spatial.github.io/gstat/) [^1] can do space-time Kriging, there can be problems with large datasets. Furthermore, the R package obviously doesn't play well with the Python ecosystem, e.g. using Keras/tensorflow for the regression part of regression Kriging.\n\nThere is the excellent [scikit-gstat](https://github.com/mmaelicke/scikit-gstat) [^2], but as for now it can not create variograms for unstructured spatio-temporal data and I didn't have the time yet to dive into it and add this feature. So perhaps for now, you may find this package useful.\n\nYou can also do something like space-time regression Kriging using one of the more mature Gaussian process libraries out there (since Kriging is actually just Gaussian process regression), but they won't provide you with nice variograms and all the other geostats stuff.\n\n<!--\n<center><img src=\"https://raw.githubusercontent.com/johanneskopton/stif/main/docs/source/_static/demo1.gif\" alt=\"Example: PM10 values in Germany\" width=\"500\"/></center>\n-->\n## Installation\n\nVia pip:\n\n```sh\npip install . # for the core package\npip install .[tensorflow] # for using tensorflow/keras models for covariate regression\npip install .[geo] # for using coordinate transformations and geo I/O\npip install .[interactive] # for running the example jupyter notebooks\npip install .[dev] # for all the development tools used in this project\n```\n\n## Development\n\nInstalling via pip for development:\n\n```sh\npip install -e .[dev]\n```\n\nTesting:\n\n```sh\npytest --cov=stif --junitxml=docs/source/_static/reports/junit/junit.xml --html=docs/source/_static/reports/junit/report.html\n```\n\nReports and badges:\n```sh\ncoverage html -d docs/source/_static/reports/htmlcov\ncoverage xml -o docs/source/_static/reports/coverage.xml\nflake8 --statistics --tee --output-file docs/source/_static/reports/flake8stats.txt\nflake8 --format=html --htmldir=docs/source/_static/reports/flake8\ngenbadge tests -i docs/source/_static/reports/junit/junit.xml -o docs/source/_static/tests-badge.svg\ngenbadge coverage -i docs/source/_static/reports/coverage.xml -o docs/source/_static/coverage-badge.svg\ngenbadge flake8 -i docs/source/_static/reports/flake8stats.txt -o docs/source/_static/flake8-badge.svg\n```\n\nCheck dependencies:\n```sh\ntox\n```\n\nBuild sphinx documentation:\n```sh\nsphinx-build -M html docs/source/ docs/build/\n```\n\nBuild package:\n```sh\npython -m build\n```\n\nPublish package on PyPI:\n```sh\ntwine upload dist/*\n```\n\n## Acknowledgements\nHeavily inspired by [^3] and the space-time variogram implementation in the R package [gstat](http://r-spatial.github.io/gstat/). Thanks a lot to Sytze de Bruin from Wageningen University for a lot of help with the geostatistics.\n\n[^1]: B. Graeler, E. Pebesma, and G. Heuvelink, \u201cSpatio-Temporal Interpolation using gstat,\u201d The R Journal, vol. 8, pp. 204\u2013218, Jan. 2016, doi: 10.32614/RJ-2016-014.\n\n[^2]: M. M\u00e4licke, \u201cSciKit-GStat 1.0: a SciPy-flavored geostatistical variogram estimation toolbox written in Python,\u201d Geoscientific Model Development, vol. 15, no. 6, pp. 2505\u20132532, Mar. 2022, doi: 10.5194/gmd-15-2505-2022.\n\n[^3]: G. B. M. Heuvelink, E. Pebesma, and B. Gr\u00e4ler, \u201cSpace-Time Geostatistics,\u201d in Encyclopedia of GIS, S. Shekhar, H. Xiong, and X. Zhou, Eds., Cham: Springer International Publishing, 2017, pp. 1919\u20131926. doi: 10.1007/978-3-319-17885-1_1647.\n",
"bugtrack_url": null,
"license": "MIT",
"summary": "Space-time interpolation and forecasting",
"version": "1.0.1",
"project_urls": {
"Homepage": "https://github.com/johanneskopton/stif"
},
"split_keywords": [
"geostatistics",
"kriging",
"variogram",
"spatio-temporal"
],
"urls": [
{
"comment_text": "",
"digests": {
"blake2b_256": "f039fbee0c5854ff8a9312c2a4bf37f7bd05952ce8ac0d48b2339254f3196635",
"md5": "7b61fc3e80d1807174c1f2bb4be25964",
"sha256": "a66d35da04fba1d40c8a838cf9a38bdf49f74dbf6fcfcad23cfebc6ca9e8c7b1"
},
"downloads": -1,
"filename": "stif-1.0.1-py3-none-any.whl",
"has_sig": false,
"md5_digest": "7b61fc3e80d1807174c1f2bb4be25964",
"packagetype": "bdist_wheel",
"python_version": "py3",
"requires_python": ">=3.9",
"size": 19675,
"upload_time": "2024-08-08T14:55:01",
"upload_time_iso_8601": "2024-08-08T14:55:01.053927Z",
"url": "https://files.pythonhosted.org/packages/f0/39/fbee0c5854ff8a9312c2a4bf37f7bd05952ce8ac0d48b2339254f3196635/stif-1.0.1-py3-none-any.whl",
"yanked": false,
"yanked_reason": null
},
{
"comment_text": "",
"digests": {
"blake2b_256": "34e3f2460e77baeda87a90c7135f54e452aba4afde542c245f62602edac67d39",
"md5": "6b94cfed8fe935c70eafc1fb2839c7fd",
"sha256": "dd5e6de879cb2765be9691f80bf5ea7b01ad6172f40fa50b8754e930e92e1ba3"
},
"downloads": -1,
"filename": "stif-1.0.1.tar.gz",
"has_sig": false,
"md5_digest": "6b94cfed8fe935c70eafc1fb2839c7fd",
"packagetype": "sdist",
"python_version": "source",
"requires_python": ">=3.9",
"size": 23929,
"upload_time": "2024-08-08T14:55:03",
"upload_time_iso_8601": "2024-08-08T14:55:03.174019Z",
"url": "https://files.pythonhosted.org/packages/34/e3/f2460e77baeda87a90c7135f54e452aba4afde542c245f62602edac67d39/stif-1.0.1.tar.gz",
"yanked": false,
"yanked_reason": null
}
],
"upload_time": "2024-08-08 14:55:03",
"github": true,
"gitlab": false,
"bitbucket": false,
"codeberg": false,
"github_user": "johanneskopton",
"github_project": "stif",
"travis_ci": false,
"coveralls": false,
"github_actions": false,
"tox": true,
"lcname": "stif"
}
