<div align="center">
# synloc: An Algorithm to Create Synthetic Tabular Data
<img src="https://raw.githubusercontent.com/alfurka/synloc/main/assets/logo_white_bc.png" alt = 'synloc'>
[Overview](#overview) | [Installation](#installation) | [A Quick Example](#a-quick-example) | [Documentation](https://alfurka.github.io/synloc/) | [How to cite?](#how-to-cite)
[](https://pypi.org/project/synloc) [](https://pepy.tech/project/synloc)
</div>
## Overview
`synloc` is an algorithm to sequentially and locally estimate distributions to create synthetic versions of a tabular data. The proposed methodology can be combined with parametric and nonparametric distributions.
## Installation
`synloc` can be installed through [PyPI](https://pypi.org/):
```
pip install synloc
```
## A Quick Example
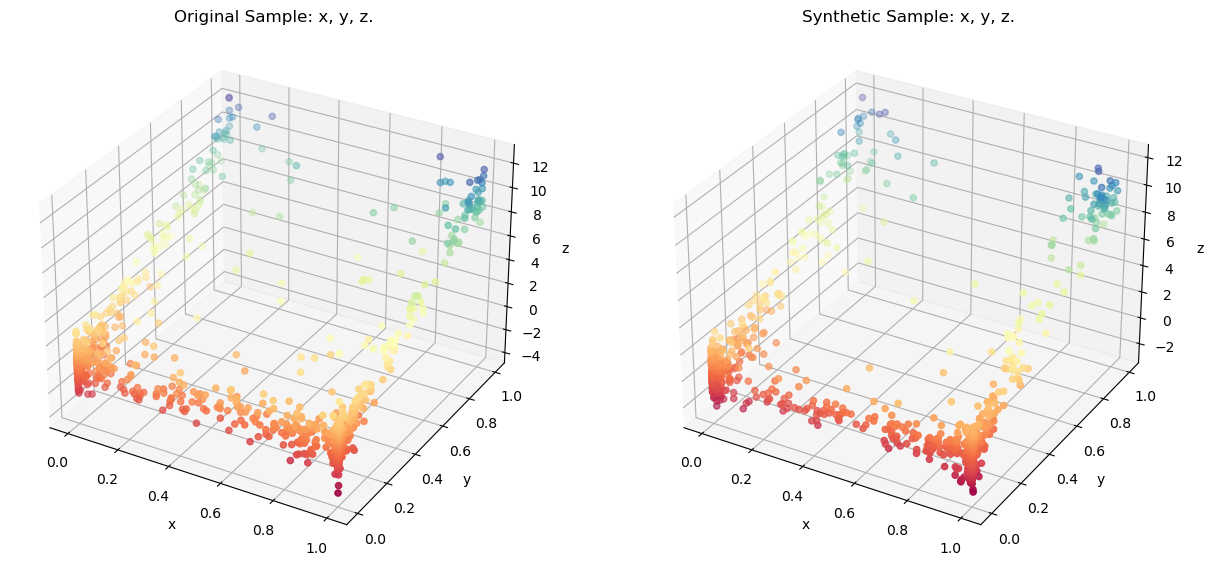
Assume that we have a sample with three variables with the following distributions:
$$x \sim Beta(0.1,\,0.1)$$
$$y \sim Beta(0.1,\, 0.5)$$
$$z \sim 10 y + Normal(0,\,1)$$
The distribution can be generated by `tools` module in `synloc`:
```python
from synloc.tools import sample_trivariate_xyz
data = sample_trivariate_xyz() # Generates a sample with size 1000 by default.
```
Initializing the resampler:
```python
from synloc import LocalCov
resampler = LocalCov(data = data, K = 30)
```
**Subsample** size is defined as `K=30`. Now, we locally estimate the multivariate normal distribution and from each estimated distributions we draw "synthetic values."
```python
syn_data = resampler.fit()
```
100%|██████████| 1000/1000 [00:01<00:00, 687.53it/s]
`syn_data` is a [pandas.DataFrame](https://pandas.pydata.org/docs/reference/api/pandas.DataFrame.html) where all variables are synthesized. Comparing the original sample using a 3-D Scatter:
```python
resampler.comparePlots(['x','y','z'])
```
## How to cite?
If you use `synloc` in your research, please cite the following paper:
```bibtex
@misc{kalay2025generatingsyntheticdatalocally,
title={Generating Synthetic Data with Locally Estimated Distributions for Disclosure Control},
author={Ali Furkan Kalay},
year={2025},
eprint={2210.00884},
archivePrefix={arXiv},
primaryClass={stat.CO},
url={https://arxiv.org/abs/2210.00884},
}
```
Raw data
{
"_id": null,
"home_page": "https://github.com/alfurka/synloc",
"name": "synloc",
"maintainer": null,
"docs_url": null,
"requires_python": ">=3.8",
"maintainer_email": null,
"keywords": "copulas, distributions, sampling, synthetic-data, oversampling, nonparametric-distributions, semiparametric, nonparametric, knn, clustering, k-means, multivariate-distributions",
"author": "Ali Furkan Kalay",
"author_email": "Ali Furkan Kalay <alfurka@gmail.com>",
"download_url": "https://files.pythonhosted.org/packages/6a/9d/c1d487662c52bd7fd3b1c2dd20d1942aa2caa9d487d0d28fb90947053405/synloc-0.2.4.tar.gz",
"platform": null,
"description": "<div align=\"center\">\r\n\r\n# synloc: An Algorithm to Create Synthetic Tabular Data\r\n\r\n<img src=\"https://raw.githubusercontent.com/alfurka/synloc/main/assets/logo_white_bc.png\" alt = 'synloc'>\r\n\r\n[Overview](#overview) | [Installation](#installation) | [A Quick Example](#a-quick-example) | [Documentation](https://alfurka.github.io/synloc/) | [How to cite?](#how-to-cite)\r\n\r\n[](https://pypi.org/project/synloc) [](https://pepy.tech/project/synloc)\r\n\r\n</div>\r\n\r\n## Overview\r\n\r\n`synloc` is an algorithm to sequentially and locally estimate distributions to create synthetic versions of a tabular data. The proposed methodology can be combined with parametric and nonparametric distributions. \r\n\r\n## Installation\r\n\r\n`synloc` can be installed through [PyPI](https://pypi.org/):\r\n\r\n```\r\npip install synloc\r\n```\r\n\r\n## A Quick Example\r\n\r\nAssume that we have a sample with three variables with the following distributions:\r\n\r\n$$x \\sim Beta(0.1,\\,0.1)$$\r\n\r\n$$y \\sim Beta(0.1,\\, 0.5)$$\r\n\r\n$$z \\sim 10 y + Normal(0,\\,1)$$\r\n\r\nThe distribution can be generated by `tools` module in `synloc`:\r\n\r\n\r\n```python\r\nfrom synloc.tools import sample_trivariate_xyz\r\ndata = sample_trivariate_xyz() # Generates a sample with size 1000 by default. \r\n```\r\n\r\nInitializing the resampler:\r\n\r\n\r\n```python\r\nfrom synloc import LocalCov\r\nresampler = LocalCov(data = data, K = 30)\r\n```\r\n\r\n**Subsample** size is defined as `K=30`. Now, we locally estimate the multivariate normal distribution and from each estimated distributions we draw \"synthetic values.\"\r\n\r\n\r\n```python\r\nsyn_data = resampler.fit() \r\n```\r\n\r\n 100%|\u2588\u2588\u2588\u2588\u2588\u2588\u2588\u2588\u2588\u2588| 1000/1000 [00:01<00:00, 687.53it/s]\r\n \r\n\r\n`syn_data` is a [pandas.DataFrame](https://pandas.pydata.org/docs/reference/api/pandas.DataFrame.html) where all variables are synthesized. Comparing the original sample using a 3-D Scatter:\r\n\r\n\r\n```python\r\nresampler.comparePlots(['x','y','z'])\r\n``` \r\n\r\n\r\n## How to cite?\r\n\r\nIf you use `synloc` in your research, please cite the following paper:\r\n\r\n```bibtex\r\n@misc{kalay2025generatingsyntheticdatalocally,\r\n title={Generating Synthetic Data with Locally Estimated Distributions for Disclosure Control}, \r\n author={Ali Furkan Kalay},\r\n year={2025},\r\n eprint={2210.00884},\r\n archivePrefix={arXiv},\r\n primaryClass={stat.CO},\r\n url={https://arxiv.org/abs/2210.00884}, \r\n}\r\n```\r\n",
"bugtrack_url": null,
"license": "MIT",
"summary": "A Python package to create synthetic data from locally estimated distributions",
"version": "0.2.4",
"project_urls": {
"Documentation": "https://alfurka.github.io/synloc/",
"Homepage": "https://github.com/alfurka/synloc"
},
"split_keywords": [
"copulas",
" distributions",
" sampling",
" synthetic-data",
" oversampling",
" nonparametric-distributions",
" semiparametric",
" nonparametric",
" knn",
" clustering",
" k-means",
" multivariate-distributions"
],
"urls": [
{
"comment_text": null,
"digests": {
"blake2b_256": "b0aec10f00ee49cb0f925354c08438504de97173b1fcec955ce24da0def5d066",
"md5": "2ca22b191e84823000d506e313372517",
"sha256": "8994f91f8168f0611c299e4b5a49dfb3313cf22eee826d4108f18c60dcc1e10e"
},
"downloads": -1,
"filename": "synloc-0.2.4-py3-none-any.whl",
"has_sig": false,
"md5_digest": "2ca22b191e84823000d506e313372517",
"packagetype": "bdist_wheel",
"python_version": "py3",
"requires_python": ">=3.8",
"size": 12592,
"upload_time": "2025-10-07T00:40:55",
"upload_time_iso_8601": "2025-10-07T00:40:55.381915Z",
"url": "https://files.pythonhosted.org/packages/b0/ae/c10f00ee49cb0f925354c08438504de97173b1fcec955ce24da0def5d066/synloc-0.2.4-py3-none-any.whl",
"yanked": false,
"yanked_reason": null
},
{
"comment_text": null,
"digests": {
"blake2b_256": "6a9dc1d487662c52bd7fd3b1c2dd20d1942aa2caa9d487d0d28fb90947053405",
"md5": "9b46fc439bc59e4989722f7848e2d2e7",
"sha256": "7166f2301d6fe05aee6b8b6f59c79651656cc4df0753f0003148f48413fdc82a"
},
"downloads": -1,
"filename": "synloc-0.2.4.tar.gz",
"has_sig": false,
"md5_digest": "9b46fc439bc59e4989722f7848e2d2e7",
"packagetype": "sdist",
"python_version": "source",
"requires_python": ">=3.8",
"size": 12628,
"upload_time": "2025-10-07T00:40:56",
"upload_time_iso_8601": "2025-10-07T00:40:56.438226Z",
"url": "https://files.pythonhosted.org/packages/6a/9d/c1d487662c52bd7fd3b1c2dd20d1942aa2caa9d487d0d28fb90947053405/synloc-0.2.4.tar.gz",
"yanked": false,
"yanked_reason": null
}
],
"upload_time": "2025-10-07 00:40:56",
"github": true,
"gitlab": false,
"bitbucket": false,
"codeberg": false,
"github_user": "alfurka",
"github_project": "synloc",
"travis_ci": false,
"coveralls": false,
"github_actions": false,
"requirements": [
{
"name": "pandas",
"specs": []
},
{
"name": "numpy",
"specs": []
},
{
"name": "scipy",
"specs": []
},
{
"name": "matplotlib",
"specs": []
},
{
"name": "scikit-learn",
"specs": []
},
{
"name": "tqdm",
"specs": []
}
],
"lcname": "synloc"
}

