# Terminal-plot for Tensorboard and CSV
[](https://pypi.org/project/terminal-plot/)
[](https://pypi.org/project/terminal-plot/)
[](https://github.com/soraxas/terminal-plot/commits/master)
[](https://github.com/psf/black)
[](https://github.com/soraxas/terminal-plot/blob/master/LICENSE)
A plotter for multiple different data source (e.g. tensorboard, csv), directly within your terminal. This is useful when you are training your neural network on a remote server, and you just want to quickly peek at the training curve without launching a tensorboard instance and mess with forwarding ports.
## Install
You can install the package published in PyPI with
```sh
$ pip install terminal-plot
# or install with matplotlib backend dependency
$ pip install terminal-plot[matplotlib-backend]
# or install with an isolated environment
# $ pipx install terminal-plot[matplotlib-backend]
```
## Autocomplete
You can use [`argcomplete`](https://kislyuk.github.io/argcomplete) to enable autocomplete for this script. For example, you can use the following for the fish shell:
```sh
register-python-argcomplete --shell fish termplot > ~/.config/fish/completions/termplot.fish
```
## Usage
```sh
$ termplot FOLDER/FILE
```
For example,
```sh
$ termplot ~/my_amazing_nn/runs
```
where `runs` is the folder that tensorboard had created.
Or, using csv as a data source:
```sh
$ termplot ~/my_stats/output.csv --csv
# use the -x flag to select which stat will be used as x-axis
# $ termplot ~/my_stats/output.csv --csv -x time
```
Or, using matplotlib as a plotting backend:
```sh
$ termplot ~/my_stats/output.csv --csv -m
```
# Example
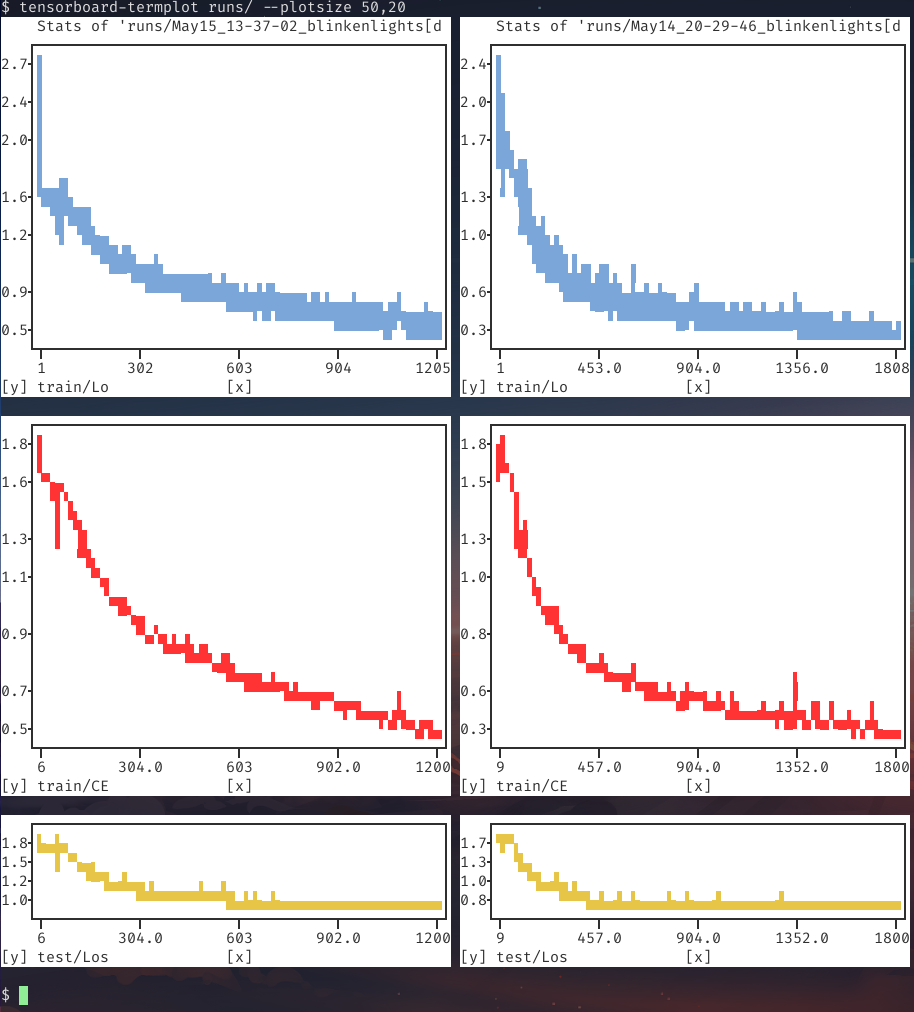
Running the executable on a tensorboard output folder:
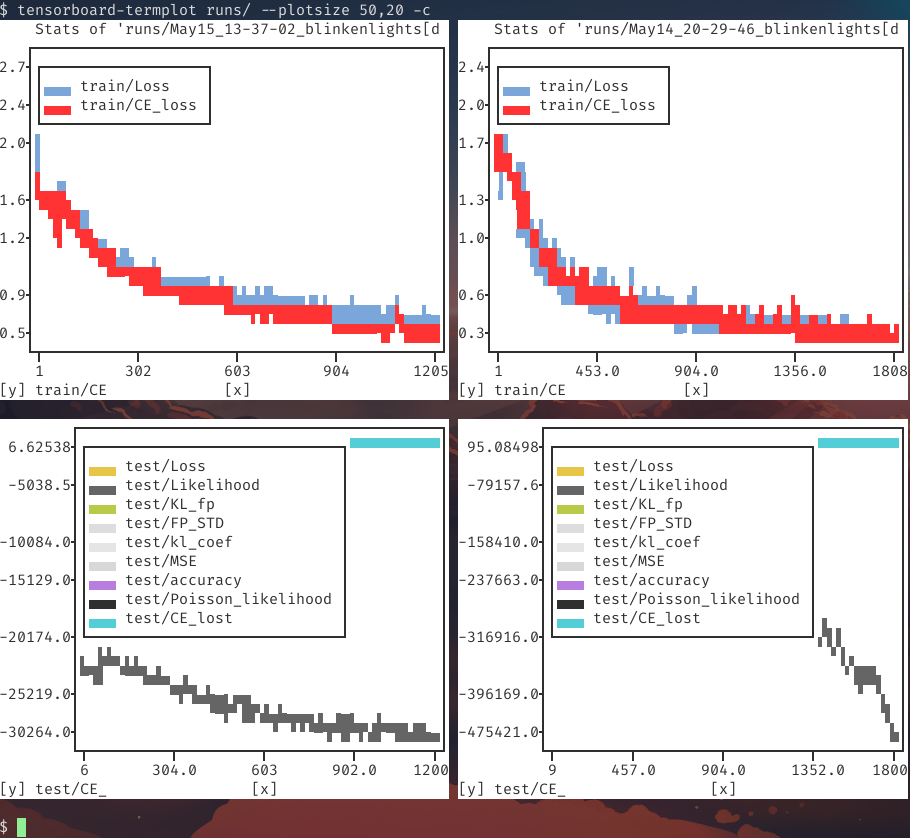
Or with the consolidated flag `-c/--consolidate` to combine multiple stats with a common prefix (most stats in the bottom figure had empty values):
# Help
```
$ termplot --help
usage: termplot [-h] [--version] [--debug]
[--backend {plotext,matplotlib,matplotlib-terminal}]
[--data-source {tensorboard,csv}] [-m] [--csv] [--latest]
[--plotsize WIDTH,HEIGHT] [-c] [--as-scatter]
[--canvas-color CANVAS_COLOR] [--axes-color AXES_COLOR]
[--ticks-color TICKS_COLOR] [--grid] [--colorless] [-d]
[--no-iter-color] [--force-label] [-f] [-n secs]
[-w keyword [keyword ...]] [-b keyword [keyword ...]]
[-x XAXIS_TYPE] [--xlog [row,col ...]] [--ylog [row,col ...]]
[--xsymlog [row,col ...]] [--ysymlog [row,col ...]]
[--xlim row,col=min,max [row,col=min,max ...]]
[--ylim row,col=min,max [row,col=min,max ...]]
[--as-raw-bytes] [-s [0-1]] [--smooth-poly-order poly-order]
[--terminal-width TERMINAL_WIDTH]
[--terminal-height TERMINAL_HEIGHT]
FOLDER
positional arguments:
FOLDER Source folder or file
optional arguments:
-h, --help show this help message and exit
--version show program's version number and exit
--debug
--backend {plotext,matplotlib,matplotlib-terminal}
Set the plotting backend
--data-source {tensorboard,csv}
Set the plotting data source
-m, --matplotlib Alias of --backend matplotlib
--csv Alias of --data-source csv
--latest, -l Monitor the given folder, and always plot the latest
modified. The given argument must be a folder if this
flag is set.
--plotsize WIDTH,HEIGHT
Manually set the size of each subplot, e.g., 50,20.
-c, --consolidate Consolidate based on prefix. If -cc is given,
everything will consolidated regardless of prefix
--as-scatter Plot as scatter (instead of line plot)
--canvas-color CANVAS_COLOR
set the color of the plot canvas (the area where the
data is plotted)
--axes-color AXES_COLOR
sets the background color of all the labels
surrounding the actual plot, i.e. the axes, axes
labels and ticks, title and legend, if present
--ticks-color TICKS_COLOR
sets the (full-ground) color of the axes ticks and of
the grid lines.
--grid Show grid.
--colorless Remove color.
-d, --dark-theme A collection of flags. If set, it is equivalent to
setting canvas-color and axes-color to black, and
setting ticks-color to red. Can be overwritten
individually.
--no-iter-color Stop iterating through different colors per plot.
--force-label Force showing label even for plot with one series.
-f, --follow Run in a loop to update display periodic.
-n secs, --interval secs
seconds to wait between updates
-w keyword [keyword ...], --whitelist keyword [keyword ...]
Keyword that the stat must contain for it to be
plotted, case sensitive.
-b keyword [keyword ...], --blacklist keyword [keyword ...]
Keyword that the stat must not contain for it to be
plotted, case sensitive.
-x XAXIS_TYPE, --xaxis-type XAXIS_TYPE
Set value type to be used for x-axis. Tensorboard only
supports 'step' or 'time' as x-axis.
--xlog [row,col ...] Set the list of subplots to use log scale in x-axis
--ylog [row,col ...] Set the list of subplots to use log scale in y-axis
--xsymlog [row,col ...]
Set the list of subplots to use symlog scale in x-axis
--ysymlog [row,col ...]
Set the list of subplots to use symlog scale in y-axis
--xlim row,col=min,max [row,col=min,max ...]
Set the list of xlim for the specified subplot.
--ylim row,col=min,max [row,col=min,max ...]
Set the list of ylim for the specified subplot.
--as-raw-bytes Writes the raw image bytes to stdout.
-s [0-1], --smooth [0-1]
A value from 0 to 1 as a smoothing factor.
--smooth-poly-order poly-order
Polynomial order for the savgol smoothing algorithm.
--terminal-width TERMINAL_WIDTH
Manually set the terminal width.
--terminal-height TERMINAL_HEIGHT
Manually set the terminal height.
```
Raw data
{
"_id": null,
"home_page": "https://github.com/soraxas/termplot",
"name": "terminal-plot",
"maintainer": null,
"docs_url": null,
"requires_python": ">=3.6",
"maintainer_email": null,
"keywords": "tui termplot stats tensorboard csv",
"author": "Tin Lai (@soraxas)",
"author_email": "oscar@tinyiu.com",
"download_url": "https://files.pythonhosted.org/packages/4f/fc/4785ca61de383b22b4f06191fe6eca1f57c1827ce1372e69acfa139a211b/terminal_plot-2.2.2.tar.gz",
"platform": null,
"description": "# Terminal-plot for Tensorboard and CSV\n\n[](https://pypi.org/project/terminal-plot/)\n[](https://pypi.org/project/terminal-plot/)\n[](https://github.com/soraxas/terminal-plot/commits/master)\n[](https://github.com/psf/black)\n[](https://github.com/soraxas/terminal-plot/blob/master/LICENSE)\n\nA plotter for multiple different data source (e.g. tensorboard, csv), directly within your terminal. This is useful when you are training your neural network on a remote server, and you just want to quickly peek at the training curve without launching a tensorboard instance and mess with forwarding ports.\n\n## Install\n\nYou can install the package published in PyPI with\n```sh\n$ pip install terminal-plot\n# or install with matplotlib backend dependency\n$ pip install terminal-plot[matplotlib-backend]\n\n# or install with an isolated environment\n# $ pipx install terminal-plot[matplotlib-backend]\n```\n\n## Autocomplete\n\nYou can use [`argcomplete`](https://kislyuk.github.io/argcomplete) to enable autocomplete for this script. For example, you can use the following for the fish shell:\n```sh\nregister-python-argcomplete --shell fish termplot > ~/.config/fish/completions/termplot.fish\n```\n\n## Usage\n\n```sh\n$ termplot FOLDER/FILE\n```\nFor example,\n```sh\n$ termplot ~/my_amazing_nn/runs\n```\nwhere `runs` is the folder that tensorboard had created.\n\nOr, using csv as a data source:\n```sh\n$ termplot ~/my_stats/output.csv --csv\n# use the -x flag to select which stat will be used as x-axis\n# $ termplot ~/my_stats/output.csv --csv -x time\n```\n\nOr, using matplotlib as a plotting backend:\n```sh\n$ termplot ~/my_stats/output.csv --csv -m\n```\n\n# Example\n\nRunning the executable on a tensorboard output folder:\n\n\n\nOr with the consolidated flag `-c/--consolidate` to combine multiple stats with a common prefix (most stats in the bottom figure had empty values):\n\n\n\n\n# Help\n\n```\n$ termplot --help\nusage: termplot [-h] [--version] [--debug]\n [--backend {plotext,matplotlib,matplotlib-terminal}]\n [--data-source {tensorboard,csv}] [-m] [--csv] [--latest]\n [--plotsize WIDTH,HEIGHT] [-c] [--as-scatter]\n [--canvas-color CANVAS_COLOR] [--axes-color AXES_COLOR]\n [--ticks-color TICKS_COLOR] [--grid] [--colorless] [-d]\n [--no-iter-color] [--force-label] [-f] [-n secs]\n [-w keyword [keyword ...]] [-b keyword [keyword ...]]\n [-x XAXIS_TYPE] [--xlog [row,col ...]] [--ylog [row,col ...]]\n [--xsymlog [row,col ...]] [--ysymlog [row,col ...]]\n [--xlim row,col=min,max [row,col=min,max ...]]\n [--ylim row,col=min,max [row,col=min,max ...]]\n [--as-raw-bytes] [-s [0-1]] [--smooth-poly-order poly-order]\n [--terminal-width TERMINAL_WIDTH]\n [--terminal-height TERMINAL_HEIGHT]\n FOLDER\n\npositional arguments:\n FOLDER Source folder or file\n\noptional arguments:\n -h, --help show this help message and exit\n --version show program's version number and exit\n --debug\n --backend {plotext,matplotlib,matplotlib-terminal}\n Set the plotting backend\n --data-source {tensorboard,csv}\n Set the plotting data source\n -m, --matplotlib Alias of --backend matplotlib\n --csv Alias of --data-source csv\n --latest, -l Monitor the given folder, and always plot the latest\n modified. The given argument must be a folder if this\n flag is set.\n --plotsize WIDTH,HEIGHT\n Manually set the size of each subplot, e.g., 50,20.\n -c, --consolidate Consolidate based on prefix. If -cc is given,\n everything will consolidated regardless of prefix\n --as-scatter Plot as scatter (instead of line plot)\n --canvas-color CANVAS_COLOR\n set the color of the plot canvas (the area where the\n data is plotted)\n --axes-color AXES_COLOR\n sets the background color of all the labels\n surrounding the actual plot, i.e. the axes, axes\n labels and ticks, title and legend, if present\n --ticks-color TICKS_COLOR\n sets the (full-ground) color of the axes ticks and of\n the grid lines.\n --grid Show grid.\n --colorless Remove color.\n -d, --dark-theme A collection of flags. If set, it is equivalent to\n setting canvas-color and axes-color to black, and\n setting ticks-color to red. Can be overwritten\n individually.\n --no-iter-color Stop iterating through different colors per plot.\n --force-label Force showing label even for plot with one series.\n -f, --follow Run in a loop to update display periodic.\n -n secs, --interval secs\n seconds to wait between updates\n -w keyword [keyword ...], --whitelist keyword [keyword ...]\n Keyword that the stat must contain for it to be\n plotted, case sensitive.\n -b keyword [keyword ...], --blacklist keyword [keyword ...]\n Keyword that the stat must not contain for it to be\n plotted, case sensitive.\n -x XAXIS_TYPE, --xaxis-type XAXIS_TYPE\n Set value type to be used for x-axis. Tensorboard only\n supports 'step' or 'time' as x-axis.\n --xlog [row,col ...] Set the list of subplots to use log scale in x-axis\n --ylog [row,col ...] Set the list of subplots to use log scale in y-axis\n --xsymlog [row,col ...]\n Set the list of subplots to use symlog scale in x-axis\n --ysymlog [row,col ...]\n Set the list of subplots to use symlog scale in y-axis\n --xlim row,col=min,max [row,col=min,max ...]\n Set the list of xlim for the specified subplot.\n --ylim row,col=min,max [row,col=min,max ...]\n Set the list of ylim for the specified subplot.\n --as-raw-bytes Writes the raw image bytes to stdout.\n -s [0-1], --smooth [0-1]\n A value from 0 to 1 as a smoothing factor.\n --smooth-poly-order poly-order\n Polynomial order for the savgol smoothing algorithm.\n --terminal-width TERMINAL_WIDTH\n Manually set the terminal width.\n --terminal-height TERMINAL_HEIGHT\n Manually set the terminal height.\n\n```\n",
"bugtrack_url": null,
"license": "MIT",
"summary": "View plotted stats directly inside terminal.",
"version": "2.2.2",
"project_urls": {
"Homepage": "https://github.com/soraxas/termplot"
},
"split_keywords": [
"tui",
"termplot",
"stats",
"tensorboard",
"csv"
],
"urls": [
{
"comment_text": "",
"digests": {
"blake2b_256": "8f21b2fdd24744f14308ec6718345ea187ded4cdc9f92f103f15821811059ca9",
"md5": "b12a0c4c7768b5bcb58cb71b502b1569",
"sha256": "e7c2fbabeb338bb3bfcbfd0c197c785c2d9b1b48da3d272a2a0491cd82396aa6"
},
"downloads": -1,
"filename": "terminal_plot-2.2.2-py3-none-any.whl",
"has_sig": false,
"md5_digest": "b12a0c4c7768b5bcb58cb71b502b1569",
"packagetype": "bdist_wheel",
"python_version": "py3",
"requires_python": ">=3.6",
"size": 22916,
"upload_time": "2024-07-20T14:57:50",
"upload_time_iso_8601": "2024-07-20T14:57:50.931479Z",
"url": "https://files.pythonhosted.org/packages/8f/21/b2fdd24744f14308ec6718345ea187ded4cdc9f92f103f15821811059ca9/terminal_plot-2.2.2-py3-none-any.whl",
"yanked": false,
"yanked_reason": null
},
{
"comment_text": "",
"digests": {
"blake2b_256": "4ffc4785ca61de383b22b4f06191fe6eca1f57c1827ce1372e69acfa139a211b",
"md5": "116a945cc9410f7fd0b35207e69aeab3",
"sha256": "a0402842231ecf6990f5063f9729782fc768cd12893bb662cca99bd243cf110c"
},
"downloads": -1,
"filename": "terminal_plot-2.2.2.tar.gz",
"has_sig": false,
"md5_digest": "116a945cc9410f7fd0b35207e69aeab3",
"packagetype": "sdist",
"python_version": "source",
"requires_python": ">=3.6",
"size": 17563,
"upload_time": "2024-07-20T14:57:52",
"upload_time_iso_8601": "2024-07-20T14:57:52.711697Z",
"url": "https://files.pythonhosted.org/packages/4f/fc/4785ca61de383b22b4f06191fe6eca1f57c1827ce1372e69acfa139a211b/terminal_plot-2.2.2.tar.gz",
"yanked": false,
"yanked_reason": null
}
],
"upload_time": "2024-07-20 14:57:52",
"github": true,
"gitlab": false,
"bitbucket": false,
"codeberg": false,
"github_user": "soraxas",
"github_project": "termplot",
"travis_ci": false,
"coveralls": false,
"github_actions": false,
"lcname": "terminal-plot"
}

")