| Name | tikzplotlib JSON |
| Version |
0.10.1
 JSON
JSON |
| download |
| home_page | |
| Summary | Convert matplotlib figures into TikZ/PGFPlots |
| upload_time | 2022-01-31 13:43:33 |
| maintainer | |
| docs_url | None |
| author | |
| requires_python | >=3.7 |
| license | |
| keywords |
latex
tikz
matplotlib
graphics
|
| VCS |
 |
| bugtrack_url |
|
| requirements |
No requirements were recorded.
|
| Travis-CI |
No Travis.
|
| coveralls test coverage |
No coveralls.
|
<p align="center">
<a href="https://github.com/nschloe/tikzplotlib"><img alt="tikzplotlib" src="https://nschloe.github.io/tikzplotlib/logo-tikzplotlib.svg" width="60%"></a>
<p align="center">The artist formerly known as <em>matplotlib2tikz.</em></p>
</p>
[](https://pypi.org/project/tikzplotlib)
[](https://repology.org/project/python:tikzplotlib/versions)
[](https://pypi.org/pypi/tikzplotlib/)
[](https://doi.org/10.5281/zenodo.1173089)
[](https://github.com/nschloe/tikzplotlib)
[](https://pepy.tech/project/tikzplotlib)
<!--[](https://pypistats.org/packages/tikzplotlib)-->
[](https://readthedocs.org/projects/tikzplotlib/?badge=latest)
[](https://github.com/nschloe/tikzplotlib)
[](https://github.com/nschloe/tikzplotlib/actions?query=workflow%3Aci)
[](https://codecov.io/gh/nschloe/tikzplotlib)
[](https://lgtm.com/projects/g/nschloe/tikzplotlib)
[](https://github.com/psf/black)
This is tikzplotlib, a Python tool for converting matplotlib figures into
[PGFPlots](https://www.ctan.org/pkg/pgfplots) ([PGF/TikZ](https://www.ctan.org/pkg/pgf))
figures like
for native inclusion into LaTeX or ConTeXt documents.
The output of tikzplotlib is in [PGFPlots](https://github.com/pgf-tikz/pgfplots/), a TeX
library that sits on top of [PGF/TikZ](https://en.wikipedia.org/wiki/PGF/TikZ) and
describes graphs in terms of axes, data etc. Consequently, the output of tikzplotlib
- retains more information,
- can be more easily understood, and
- is more easily editable
than [raw TikZ output](https://matplotlib.org/users/whats_new.html#pgf-tikz-backend).
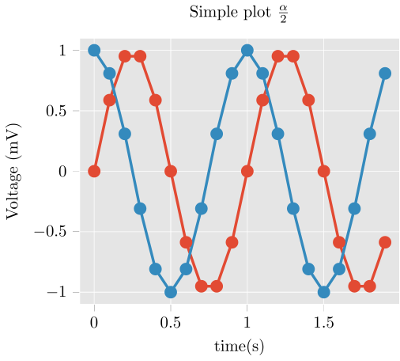
For example, the matplotlib figure
```python
import matplotlib.pyplot as plt
import numpy as np
plt.style.use("ggplot")
t = np.arange(0.0, 2.0, 0.1)
s = np.sin(2 * np.pi * t)
s2 = np.cos(2 * np.pi * t)
plt.plot(t, s, "o-", lw=4.1)
plt.plot(t, s2, "o-", lw=4.1)
plt.xlabel("time (s)")
plt.ylabel("Voltage (mV)")
plt.title("Simple plot $\\frac{\\alpha}{2}$")
plt.grid(True)
import tikzplotlib
tikzplotlib.save("test.tex")
```
<!--close the figure and reset defaults
<!--pytest-codeblocks:cont-->
```python
import matplotlib as mpl
plt.close()
mpl.rcParams.update(mpl.rcParamsDefault)
```
-->
(see above) gives
```latex
\begin{tikzpicture}
\definecolor{color0}{rgb}{0.886274509803922,0.290196078431373,0.2}
\definecolor{color1}{rgb}{0.203921568627451,0.541176470588235,0.741176470588235}
\begin{axis}[
axis background/.style={fill=white!89.8039215686275!black},
axis line style={white},
tick align=outside,
tick pos=left,
title={Simple plot \(\displaystyle \frac{\alpha}{2}\)},
x grid style={white},
xlabel={time (s)},
xmajorgrids,
xmin=-0.095, xmax=1.995,
xtick style={color=white!33.3333333333333!black},
y grid style={white},
ylabel={Voltage (mV)},
ymajorgrids,
ymin=-1.1, ymax=1.1,
ytick style={color=white!33.3333333333333!black}
]
\addplot [line width=1.64pt, color0, mark=*, mark size=3, mark options={solid}]
table {%
0 0
0.1 0.587785252292473
% [...]
1.9 -0.587785252292473
};
\addplot [line width=1.64pt, color1, mark=*, mark size=3, mark options={solid}]
table {%
0 1
0.1 0.809016994374947
% [...]
1.9 0.809016994374947
};
\end{axis}
\end{tikzpicture}
```
(Use `get_tikz_code()` instead of `save()` if you want the code as a string.)
Tweaking the plot is straightforward and can be done as part of your TeX work flow.
[The fantastic PGFPlots manual](http://pgfplots.sourceforge.net/pgfplots.pdf) contains
great examples of how to make your plot look even better.
Of course, not all figures produced by matplotlib can be converted without error.
Notably, [3D plots don't work](https://github.com/matplotlib/matplotlib/issues/7243).
### Installation
tikzplotlib is [available from the Python Package
Index](https://pypi.org/project/tikzplotlib/), so simply do
```
pip install tikzplotlib
```
to install.
### Usage
1. Generate your matplotlib plot as usual.
2. Instead of `pyplot.show()`, invoke tikzplotlib by
```python
import tikzplotlib
tikzplotlib.save("mytikz.tex")
# or
tikzplotlib.save("mytikz.tex", flavor="context")
```
to store the TikZ file as `mytikz.tex`.
3. Add the contents of `mytikz.tex` into your TeX source code. A convenient way of doing
so is via
```latex
\input{/path/to/mytikz.tex}
```
Also make sure that the packages for PGFPlots and proper Unicode support and are
included in the header of your document:
```latex
\usepackage[utf8]{inputenc}
\usepackage{pgfplots}
\DeclareUnicodeCharacter{2212}{−}
\usepgfplotslibrary{groupplots,dateplot}
\usetikzlibrary{patterns,shapes.arrows}
\pgfplotsset{compat=newest}
```
or:
```latex
\setupcolors[state=start]
\usemodule[tikz]
\usemodule[pgfplots]
\usepgfplotslibrary[groupplots,dateplot]
\usetikzlibrary[patterns,shapes.arrows]
\pgfplotsset{compat=newest}
\unexpanded\def\startgroupplot{\groupplot}
\unexpanded\def\stopgroupplot{\endgroupplot}
```
You can also get the code via:
```python
import tikzplotlib
tikzplotlib.Flavors.latex.preamble()
# or
tikzplotlib.Flavors.context.preamble()
```
4. [Optional] Clean up the figure before exporting to tikz using the `clean_figure`
command.
```python
import matplotlib.pyplot as plt
import numpy as np
# ... do your plotting
import tikzplotlib
tikzplotlib.clean_figure()
tikzplotlib.save("test.tex")
```
The command will remove points that are outside the axes limits, simplify curves and
reduce point density for the specified target resolution.
The feature originated from the
[matlab2tikz](https://github.com/matlab2tikz/matlab2tikz) project and is adapted to
matplotlib.
### Contributing
If you experience bugs, would like to contribute, have nice examples of what tikzplotlib
can do, or if you are just looking for more information, then please visit
[tikzplotlib's GitHub page](https://github.com/nschloe/tikzplotlib).
### Testing
tikzplotlib has automatic unit testing to make sure that the software doesn't
accidentally get worse over time. In `test/`, a number of test cases are specified.
Those run through tikzplotlib and compare the output with a previously stored reference
TeX file.
To run the tests, just check out this repository and type
```
pytest
```
### License
tikzplotlib is published under the [MIT
license](https://en.wikipedia.org/wiki/MIT_License).
Raw data
{
"_id": null,
"home_page": "",
"name": "tikzplotlib",
"maintainer": "",
"docs_url": null,
"requires_python": ">=3.7",
"maintainer_email": "",
"keywords": "latex,tikz,matplotlib,graphics",
"author": "",
"author_email": "Nico Schl\u00f6mer <nico.schloemer@gmail.com>",
"download_url": "https://files.pythonhosted.org/packages/98/22/3ed358885b75c222f39221d0cc2793f4059c02788b669363a0e7df03241f/tikzplotlib-0.10.1.tar.gz",
"platform": "",
"description": "<p align=\"center\">\n <a href=\"https://github.com/nschloe/tikzplotlib\"><img alt=\"tikzplotlib\" src=\"https://nschloe.github.io/tikzplotlib/logo-tikzplotlib.svg\" width=\"60%\"></a>\n <p align=\"center\">The artist formerly known as <em>matplotlib2tikz.</em></p>\n</p>\n\n[](https://pypi.org/project/tikzplotlib)\n[](https://repology.org/project/python:tikzplotlib/versions)\n[](https://pypi.org/pypi/tikzplotlib/)\n[](https://doi.org/10.5281/zenodo.1173089)\n[](https://github.com/nschloe/tikzplotlib)\n[](https://pepy.tech/project/tikzplotlib)\n\n<!--[](https://pypistats.org/packages/tikzplotlib)-->\n\n[](https://readthedocs.org/projects/tikzplotlib/?badge=latest)\n[](https://github.com/nschloe/tikzplotlib)\n\n[](https://github.com/nschloe/tikzplotlib/actions?query=workflow%3Aci)\n[](https://codecov.io/gh/nschloe/tikzplotlib)\n[](https://lgtm.com/projects/g/nschloe/tikzplotlib)\n[](https://github.com/psf/black)\n\nThis is tikzplotlib, a Python tool for converting matplotlib figures into\n[PGFPlots](https://www.ctan.org/pkg/pgfplots) ([PGF/TikZ](https://www.ctan.org/pkg/pgf))\nfigures like\n\n\n\nfor native inclusion into LaTeX or ConTeXt documents.\n\nThe output of tikzplotlib is in [PGFPlots](https://github.com/pgf-tikz/pgfplots/), a TeX\nlibrary that sits on top of [PGF/TikZ](https://en.wikipedia.org/wiki/PGF/TikZ) and\ndescribes graphs in terms of axes, data etc. Consequently, the output of tikzplotlib\n\n- retains more information,\n- can be more easily understood, and\n- is more easily editable\n\nthan [raw TikZ output](https://matplotlib.org/users/whats_new.html#pgf-tikz-backend).\nFor example, the matplotlib figure\n\n```python\nimport matplotlib.pyplot as plt\nimport numpy as np\n\nplt.style.use(\"ggplot\")\n\nt = np.arange(0.0, 2.0, 0.1)\ns = np.sin(2 * np.pi * t)\ns2 = np.cos(2 * np.pi * t)\nplt.plot(t, s, \"o-\", lw=4.1)\nplt.plot(t, s2, \"o-\", lw=4.1)\nplt.xlabel(\"time (s)\")\nplt.ylabel(\"Voltage (mV)\")\nplt.title(\"Simple plot $\\\\frac{\\\\alpha}{2}$\")\nplt.grid(True)\n\nimport tikzplotlib\n\ntikzplotlib.save(\"test.tex\")\n```\n\n<!--close the figure and reset defaults\n<!--pytest-codeblocks:cont-->\n\n```python\nimport matplotlib as mpl\n\nplt.close()\nmpl.rcParams.update(mpl.rcParamsDefault)\n```\n\n-->\n(see above) gives\n\n```latex\n\\begin{tikzpicture}\n\n\\definecolor{color0}{rgb}{0.886274509803922,0.290196078431373,0.2}\n\\definecolor{color1}{rgb}{0.203921568627451,0.541176470588235,0.741176470588235}\n\n\\begin{axis}[\naxis background/.style={fill=white!89.8039215686275!black},\naxis line style={white},\ntick align=outside,\ntick pos=left,\ntitle={Simple plot \\(\\displaystyle \\frac{\\alpha}{2}\\)},\nx grid style={white},\nxlabel={time (s)},\nxmajorgrids,\nxmin=-0.095, xmax=1.995,\nxtick style={color=white!33.3333333333333!black},\ny grid style={white},\nylabel={Voltage (mV)},\nymajorgrids,\nymin=-1.1, ymax=1.1,\nytick style={color=white!33.3333333333333!black}\n]\n\\addplot [line width=1.64pt, color0, mark=*, mark size=3, mark options={solid}]\ntable {%\n0 0\n0.1 0.587785252292473\n% [...]\n1.9 -0.587785252292473\n};\n\\addplot [line width=1.64pt, color1, mark=*, mark size=3, mark options={solid}]\ntable {%\n0 1\n0.1 0.809016994374947\n% [...]\n1.9 0.809016994374947\n};\n\\end{axis}\n\n\\end{tikzpicture}\n```\n\n(Use `get_tikz_code()` instead of `save()` if you want the code as a string.)\n\nTweaking the plot is straightforward and can be done as part of your TeX work flow.\n[The fantastic PGFPlots manual](http://pgfplots.sourceforge.net/pgfplots.pdf) contains\ngreat examples of how to make your plot look even better.\n\nOf course, not all figures produced by matplotlib can be converted without error.\nNotably, [3D plots don't work](https://github.com/matplotlib/matplotlib/issues/7243).\n\n### Installation\n\ntikzplotlib is [available from the Python Package\nIndex](https://pypi.org/project/tikzplotlib/), so simply do\n\n```\npip install tikzplotlib\n```\n\nto install.\n\n### Usage\n\n1. Generate your matplotlib plot as usual.\n\n2. Instead of `pyplot.show()`, invoke tikzplotlib by\n\n ```python\n import tikzplotlib\n\n tikzplotlib.save(\"mytikz.tex\")\n # or\n tikzplotlib.save(\"mytikz.tex\", flavor=\"context\")\n ```\n\n to store the TikZ file as `mytikz.tex`.\n\n3. Add the contents of `mytikz.tex` into your TeX source code. A convenient way of doing\n so is via\n\n ```latex\n \\input{/path/to/mytikz.tex}\n ```\n\n Also make sure that the packages for PGFPlots and proper Unicode support and are\n included in the header of your document:\n\n ```latex\n \\usepackage[utf8]{inputenc}\n \\usepackage{pgfplots}\n \\DeclareUnicodeCharacter{2212}{\u2212}\n \\usepgfplotslibrary{groupplots,dateplot}\n \\usetikzlibrary{patterns,shapes.arrows}\n \\pgfplotsset{compat=newest}\n ```\n\n or:\n\n ```latex\n \\setupcolors[state=start]\n \\usemodule[tikz]\n \\usemodule[pgfplots]\n \\usepgfplotslibrary[groupplots,dateplot]\n \\usetikzlibrary[patterns,shapes.arrows]\n \\pgfplotsset{compat=newest}\n \\unexpanded\\def\\startgroupplot{\\groupplot}\n \\unexpanded\\def\\stopgroupplot{\\endgroupplot}\n ```\n\n You can also get the code via:\n\n ```python\n import tikzplotlib\n\n tikzplotlib.Flavors.latex.preamble()\n # or\n tikzplotlib.Flavors.context.preamble()\n ```\n\n4. [Optional] Clean up the figure before exporting to tikz using the `clean_figure`\n command.\n\n ```python\n import matplotlib.pyplot as plt\n import numpy as np\n\n # ... do your plotting\n\n import tikzplotlib\n\n tikzplotlib.clean_figure()\n tikzplotlib.save(\"test.tex\")\n ```\n\n The command will remove points that are outside the axes limits, simplify curves and\n reduce point density for the specified target resolution.\n\n The feature originated from the\n [matlab2tikz](https://github.com/matlab2tikz/matlab2tikz) project and is adapted to\n matplotlib.\n\n### Contributing\n\nIf you experience bugs, would like to contribute, have nice examples of what tikzplotlib\ncan do, or if you are just looking for more information, then please visit\n[tikzplotlib's GitHub page](https://github.com/nschloe/tikzplotlib).\n\n### Testing\n\ntikzplotlib has automatic unit testing to make sure that the software doesn't\naccidentally get worse over time. In `test/`, a number of test cases are specified.\nThose run through tikzplotlib and compare the output with a previously stored reference\nTeX file.\n\nTo run the tests, just check out this repository and type\n\n```\npytest\n```\n\n### License\n\ntikzplotlib is published under the [MIT\nlicense](https://en.wikipedia.org/wiki/MIT_License).\n",
"bugtrack_url": null,
"license": "",
"summary": "Convert matplotlib figures into TikZ/PGFPlots",
"version": "0.10.1",
"project_urls": {
"Code": "https://github.com/nschloe/tikzplotlib",
"Funding": "https://github.com/sponsors/nschloe",
"Issues": "https://github.com/nschloe/tikzplotlib/issues"
},
"split_keywords": [
"latex",
"tikz",
"matplotlib",
"graphics"
],
"urls": [
{
"comment_text": "",
"digests": {
"blake2b_256": "673e24d1c41cbe520d17cfb887e1d527937ad3b6a1c3dc42c12cd48fa60d2dc7",
"md5": "e745f0a5fedc468e34f05ea04071b4b8",
"sha256": "bf0451b86fe4db40aa742f7e5a180dfaaadf57c746ddb2ab7e58a5163d8be75f"
},
"downloads": -1,
"filename": "tikzplotlib-0.10.1-py3-none-any.whl",
"has_sig": false,
"md5_digest": "e745f0a5fedc468e34f05ea04071b4b8",
"packagetype": "bdist_wheel",
"python_version": "py3",
"requires_python": ">=3.7",
"size": 54151,
"upload_time": "2022-01-31T13:43:31",
"upload_time_iso_8601": "2022-01-31T13:43:31.014609Z",
"url": "https://files.pythonhosted.org/packages/67/3e/24d1c41cbe520d17cfb887e1d527937ad3b6a1c3dc42c12cd48fa60d2dc7/tikzplotlib-0.10.1-py3-none-any.whl",
"yanked": false,
"yanked_reason": null
},
{
"comment_text": "",
"digests": {
"blake2b_256": "98223ed358885b75c222f39221d0cc2793f4059c02788b669363a0e7df03241f",
"md5": "2bc4eee1ff3477df513466376ac2e392",
"sha256": "93d141342d143804fc1dfabe03e6d4e38e547cf72803bdf124615affdd56f59d"
},
"downloads": -1,
"filename": "tikzplotlib-0.10.1.tar.gz",
"has_sig": false,
"md5_digest": "2bc4eee1ff3477df513466376ac2e392",
"packagetype": "sdist",
"python_version": "source",
"requires_python": ">=3.7",
"size": 104475,
"upload_time": "2022-01-31T13:43:33",
"upload_time_iso_8601": "2022-01-31T13:43:33.402207Z",
"url": "https://files.pythonhosted.org/packages/98/22/3ed358885b75c222f39221d0cc2793f4059c02788b669363a0e7df03241f/tikzplotlib-0.10.1.tar.gz",
"yanked": false,
"yanked_reason": null
}
],
"upload_time": "2022-01-31 13:43:33",
"github": true,
"gitlab": false,
"bitbucket": false,
"codeberg": false,
"github_user": "nschloe",
"github_project": "tikzplotlib",
"travis_ci": false,
"coveralls": false,
"github_actions": true,
"tox": true,
"lcname": "tikzplotlib"
}
