| Name | tmplot JSON |
| Version |
0.1.3
 JSON
JSON |
| download |
| home_page | None |
| Summary | Visualization of Topic Modeling Results |
| upload_time | 2024-09-19 13:29:48 |
| maintainer | None |
| docs_url | None |
| author | None |
| requires_python | >=3.8 |
| license | MIT License Copyright (c) 2021 Maksim Terpilowski Permission is hereby granted, free of charge, to any person obtaining a copy of this software and associated documentation files (the "Software"), to deal in the Software without restriction, including without limitation the rights to use, copy, modify, merge, publish, distribute, sublicense, and/or sell copies of the Software, and to permit persons to whom the Software is furnished to do so, subject to the following conditions: The above copyright notice and this permission notice shall be included in all copies or substantial portions of the Software. THE SOFTWARE IS PROVIDED "AS IS", WITHOUT WARRANTY OF ANY KIND, EXPRESS OR IMPLIED, INCLUDING BUT NOT LIMITED TO THE WARRANTIES OF MERCHANTABILITY, FITNESS FOR A PARTICULAR PURPOSE AND NONINFRINGEMENT. IN NO EVENT SHALL THE AUTHORS OR COPYRIGHT HOLDERS BE LIABLE FOR ANY CLAIM, DAMAGES OR OTHER LIABILITY, WHETHER IN AN ACTION OF CONTRACT, TORT OR OTHERWISE, ARISING FROM, OUT OF OR IN CONNECTION WITH THE SOFTWARE OR THE USE OR OTHER DEALINGS IN THE SOFTWARE. |
| keywords |
data science
data analytics
|
| VCS |
 |
| bugtrack_url |
|
| requirements |
No requirements were recorded.
|
| Travis-CI |
No Travis.
|
| coveralls test coverage |
No coveralls.
|
# tmplot
[](https://app.codacy.com/gh/maximtrp/tmplot/coverage)
[](https://app.codacy.com/gh/maximtrp/tmplot)
[](https://github.com/maximtrp/tmplot/actions/workflows/python-package.yml)
[](https://tmplot.readthedocs.io/en/latest/?badge=latest)
[](https://pepy.tech/project/tmplot)
[](https://pypi.org/project/tmplot)
[](https://github.com/maximtrp/tmplot/issues)
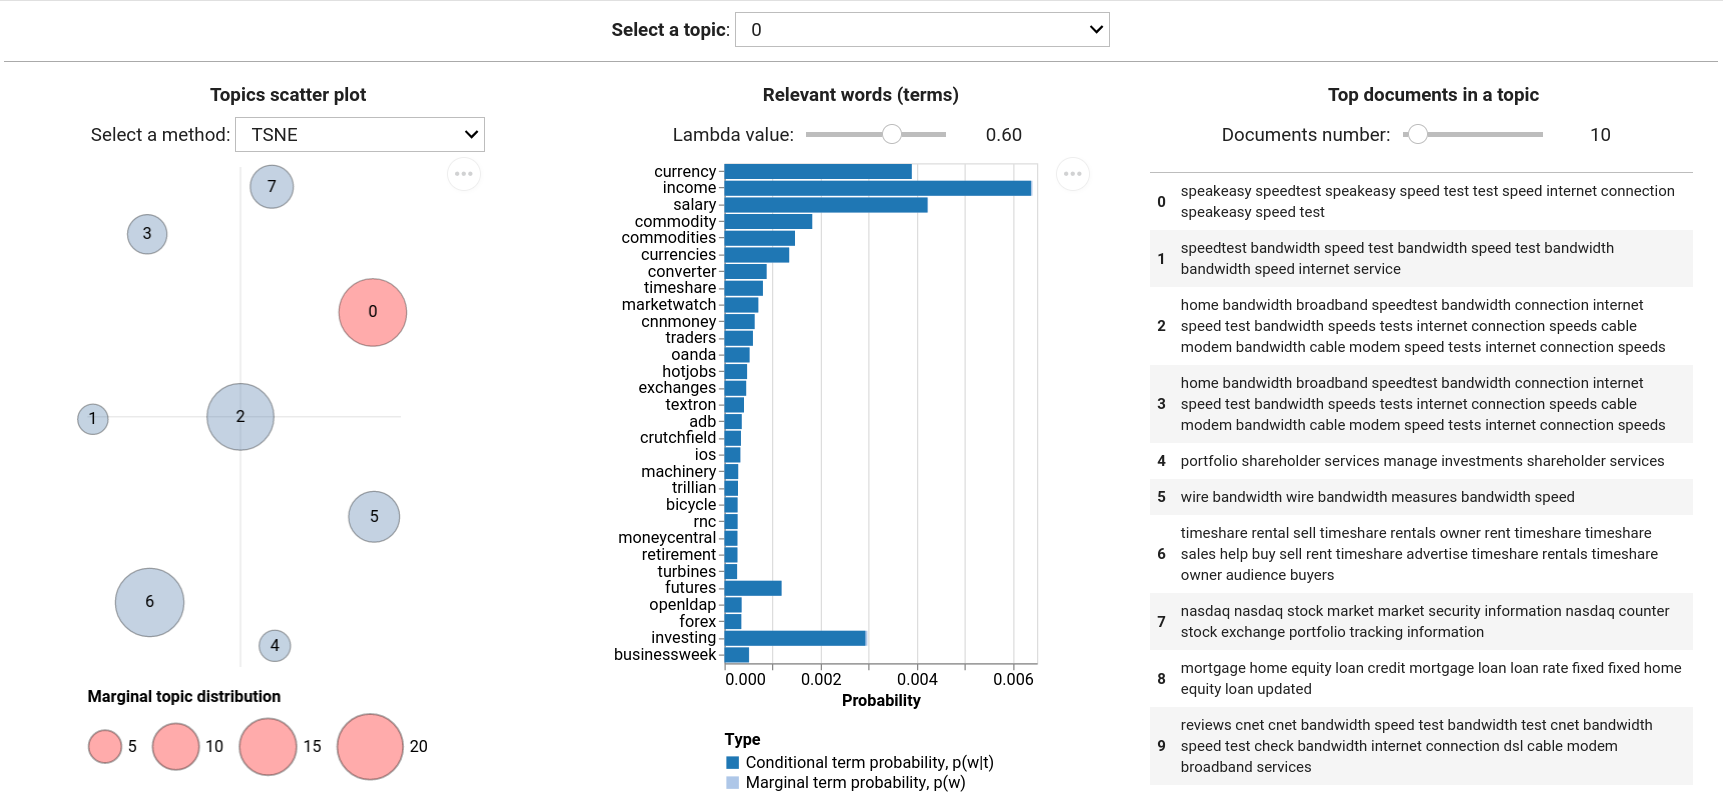
**tmplot** is a Python package for analysis and visualization of topic modeling results. It provides the interactive report interface that borrows much from LDAvis/pyLDAvis and builds upon it offering a number of metrics for calculating topic distances and a number of algorithms for calculating scatter coordinates of topics. It can be used to select closest and stable topics across multiple models.
## Features
- Supported models:
- [tomotopy](https://bab2min.github.io/tomotopy/): `LDAModel`, `LLDAModel`, `CTModel`, `DMRModel`, `HDPModel`, `PTModel`, `SLDAModel`, `GDMRModel`
- [gensim](https://radimrehurek.com/gensim/): `LdaModel`, `LdaMulticore`
- [bitermplus](https://github.com/maximtrp/bitermplus): `BTM`
- Supported distance metrics:
- Kullback-Leibler (symmetric and non-symmetric) divergence
- Jenson-Shannon divergence
- Jeffrey's divergence
- Hellinger distance
- Bhattacharyya distance
- Total variation distance
- Jaccard inversed index
- Supported [algorithms](https://scikit-learn.org/stable/modules/classes.html#module-sklearn.manifold) for calculating topics scatter coordinates:
- t-SNE
- SpectralEmbedding
- MDS
- LocallyLinearEmbedding
- Isomap
## Donate
If you find this package useful, please consider donating any amount of money. This will help me spend more time on supporting open-source software.
<a href="https://www.buymeacoffee.com/maximtrp" target="_blank"><img src="https://cdn.buymeacoffee.com/buttons/v2/default-yellow.png" alt="Buy Me A Coffee" style="height: 60px !important;width: 217px !important;" ></a>
## Installation
The package can be installed from PyPi:
```bash
pip install tmplot
```
Or directly from this repository:
```bash
pip install git+https://github.com/maximtrp/tmplot.git
```
## Dependencies
- `numpy`
- `scipy`
- `scikit-learn`
- `pandas`
- `altair`
- `ipywidgets`
- `tomotopy`, `gensim`, and `bitermplus` (optional)
## Quick example
```python
# Importing packages
import tmplot as tmp
import pickle as pkl
import pandas as pd
# Reading a model from a file
with open('data/model.pkl', 'rb') as file:
model = pkl.load(file)
# Reading documents from a file
docs = pd.read_csv('data/docs.txt.gz', header=None).values.ravel()
# Plotting topics as a scatter plot
topics_coords = tmp.prepare_coords(model)
tmp.plot_scatter_topics(topics_coords, size_col='size', label_col='label')
# Plotting terms probabilities
terms_probs = tmp.calc_terms_probs_ratio(phi, topic=0, lambda_=1)
tmp.plot_terms(terms_probs)
# Running report interface
tmp.report(model, docs=docs, width=250)
```
You can find more examples in the [tutorial](https://tmplot.readthedocs.io/en/latest/tutorial.html).
Raw data
{
"_id": null,
"home_page": null,
"name": "tmplot",
"maintainer": null,
"docs_url": null,
"requires_python": ">=3.8",
"maintainer_email": null,
"keywords": "data science, data analytics",
"author": null,
"author_email": "Maksim Terpilovskii <maximtrp@gmail.com>",
"download_url": "https://files.pythonhosted.org/packages/25/ce/d04e481a516a347b2248bfd985b2dda578771afcf80e079ce17b001c7d75/tmplot-0.1.3.tar.gz",
"platform": null,
"description": "# tmplot\n\n[](https://app.codacy.com/gh/maximtrp/tmplot/coverage)\n[](https://app.codacy.com/gh/maximtrp/tmplot)\n[](https://github.com/maximtrp/tmplot/actions/workflows/python-package.yml)\n[](https://tmplot.readthedocs.io/en/latest/?badge=latest)\n[](https://pepy.tech/project/tmplot)\n[](https://pypi.org/project/tmplot)\n[](https://github.com/maximtrp/tmplot/issues)\n\n**tmplot** is a Python package for analysis and visualization of topic modeling results. It provides the interactive report interface that borrows much from LDAvis/pyLDAvis and builds upon it offering a number of metrics for calculating topic distances and a number of algorithms for calculating scatter coordinates of topics. It can be used to select closest and stable topics across multiple models.\n\n\n\n## Features\n\n- Supported models:\n\n - [tomotopy](https://bab2min.github.io/tomotopy/): `LDAModel`, `LLDAModel`, `CTModel`, `DMRModel`, `HDPModel`, `PTModel`, `SLDAModel`, `GDMRModel`\n - [gensim](https://radimrehurek.com/gensim/): `LdaModel`, `LdaMulticore`\n - [bitermplus](https://github.com/maximtrp/bitermplus): `BTM`\n\n- Supported distance metrics:\n\n - Kullback-Leibler (symmetric and non-symmetric) divergence\n - Jenson-Shannon divergence\n - Jeffrey's divergence\n - Hellinger distance\n - Bhattacharyya distance\n - Total variation distance\n - Jaccard inversed index\n\n- Supported [algorithms](https://scikit-learn.org/stable/modules/classes.html#module-sklearn.manifold) for calculating topics scatter coordinates:\n\n - t-SNE\n - SpectralEmbedding\n - MDS\n - LocallyLinearEmbedding\n - Isomap\n\n## Donate\n\nIf you find this package useful, please consider donating any amount of money. This will help me spend more time on supporting open-source software.\n\n<a href=\"https://www.buymeacoffee.com/maximtrp\" target=\"_blank\"><img src=\"https://cdn.buymeacoffee.com/buttons/v2/default-yellow.png\" alt=\"Buy Me A Coffee\" style=\"height: 60px !important;width: 217px !important;\" ></a>\n\n## Installation\n\nThe package can be installed from PyPi:\n\n```bash\npip install tmplot\n```\n\nOr directly from this repository:\n\n```bash\npip install git+https://github.com/maximtrp/tmplot.git\n```\n\n## Dependencies\n\n- `numpy`\n- `scipy`\n- `scikit-learn`\n- `pandas`\n- `altair`\n- `ipywidgets`\n- `tomotopy`, `gensim`, and `bitermplus` (optional)\n\n## Quick example\n\n```python\n# Importing packages\nimport tmplot as tmp\nimport pickle as pkl\nimport pandas as pd\n\n# Reading a model from a file\nwith open('data/model.pkl', 'rb') as file:\n model = pkl.load(file)\n\n# Reading documents from a file\ndocs = pd.read_csv('data/docs.txt.gz', header=None).values.ravel()\n\n# Plotting topics as a scatter plot\ntopics_coords = tmp.prepare_coords(model)\ntmp.plot_scatter_topics(topics_coords, size_col='size', label_col='label')\n\n# Plotting terms probabilities\nterms_probs = tmp.calc_terms_probs_ratio(phi, topic=0, lambda_=1)\ntmp.plot_terms(terms_probs)\n\n# Running report interface\ntmp.report(model, docs=docs, width=250)\n```\n\nYou can find more examples in the [tutorial](https://tmplot.readthedocs.io/en/latest/tutorial.html).\n",
"bugtrack_url": null,
"license": "MIT License Copyright (c) 2021 Maksim Terpilowski Permission is hereby granted, free of charge, to any person obtaining a copy of this software and associated documentation files (the \"Software\"), to deal in the Software without restriction, including without limitation the rights to use, copy, modify, merge, publish, distribute, sublicense, and/or sell copies of the Software, and to permit persons to whom the Software is furnished to do so, subject to the following conditions: The above copyright notice and this permission notice shall be included in all copies or substantial portions of the Software. THE SOFTWARE IS PROVIDED \"AS IS\", WITHOUT WARRANTY OF ANY KIND, EXPRESS OR IMPLIED, INCLUDING BUT NOT LIMITED TO THE WARRANTIES OF MERCHANTABILITY, FITNESS FOR A PARTICULAR PURPOSE AND NONINFRINGEMENT. IN NO EVENT SHALL THE AUTHORS OR COPYRIGHT HOLDERS BE LIABLE FOR ANY CLAIM, DAMAGES OR OTHER LIABILITY, WHETHER IN AN ACTION OF CONTRACT, TORT OR OTHERWISE, ARISING FROM, OUT OF OR IN CONNECTION WITH THE SOFTWARE OR THE USE OR OTHER DEALINGS IN THE SOFTWARE. ",
"summary": "Visualization of Topic Modeling Results",
"version": "0.1.3",
"project_urls": {
"documentation": "https://tmplot.readthedocs.io/",
"homepage": "https://github.com/maximtrp/tmplot"
},
"split_keywords": [
"data science",
" data analytics"
],
"urls": [
{
"comment_text": "",
"digests": {
"blake2b_256": "14524e14694a66ec2d0f082801262172cbc70c29b025d6264c94c9ec49d57775",
"md5": "e0d218eb0675a86b0e3c73803af73981",
"sha256": "384bfbbaa3078e56fe77f6a9704cd7acff120ebea552947aa25a09cc54b8c067"
},
"downloads": -1,
"filename": "tmplot-0.1.3-py3-none-any.whl",
"has_sig": false,
"md5_digest": "e0d218eb0675a86b0e3c73803af73981",
"packagetype": "bdist_wheel",
"python_version": "py3",
"requires_python": ">=3.8",
"size": 18587,
"upload_time": "2024-09-19T13:29:47",
"upload_time_iso_8601": "2024-09-19T13:29:47.558502Z",
"url": "https://files.pythonhosted.org/packages/14/52/4e14694a66ec2d0f082801262172cbc70c29b025d6264c94c9ec49d57775/tmplot-0.1.3-py3-none-any.whl",
"yanked": false,
"yanked_reason": null
},
{
"comment_text": "",
"digests": {
"blake2b_256": "25ced04e481a516a347b2248bfd985b2dda578771afcf80e079ce17b001c7d75",
"md5": "9a5b31e1f0aa947ea3e066e4d5a209c4",
"sha256": "9adc686251ff24a687d7852eeb034d458fcb6177271af9627b27539b915c7180"
},
"downloads": -1,
"filename": "tmplot-0.1.3.tar.gz",
"has_sig": false,
"md5_digest": "9a5b31e1f0aa947ea3e066e4d5a209c4",
"packagetype": "sdist",
"python_version": "source",
"requires_python": ">=3.8",
"size": 18791,
"upload_time": "2024-09-19T13:29:48",
"upload_time_iso_8601": "2024-09-19T13:29:48.910437Z",
"url": "https://files.pythonhosted.org/packages/25/ce/d04e481a516a347b2248bfd985b2dda578771afcf80e079ce17b001c7d75/tmplot-0.1.3.tar.gz",
"yanked": false,
"yanked_reason": null
}
],
"upload_time": "2024-09-19 13:29:48",
"github": true,
"gitlab": false,
"bitbucket": false,
"codeberg": false,
"github_user": "maximtrp",
"github_project": "tmplot",
"travis_ci": false,
"coveralls": false,
"github_actions": true,
"lcname": "tmplot"
}
