## Install
### PyPI
```sh
pip install utilsforecast
```
### Conda
```sh
conda install -c conda-forge utilsforecast
```
---
## How to use
### Generate synthetic data
```python
from utilsforecast.data import generate_series
series = generate_series(3, with_trend=True, static_as_categorical=False)
series
```
```
| | unique_id | ds | y |
|-----|-----------|------------|------------|
| 0 | 0 | 2000-01-01 | 0.422133 |
| 1 | 0 | 2000-01-02 | 1.501407 |
| 2 | 0 | 2000-01-03 | 2.568495 |
| 3 | 0 | 2000-01-04 | 3.529085 |
| 4 | 0 | 2000-01-05 | 4.481929 |
| ... | ... | ... | ... |
| 481 | 2 | 2000-06-11 | 163.914625 |
| 482 | 2 | 2000-06-12 | 166.018479 |
| 483 | 2 | 2000-06-13 | 160.839176 |
| 484 | 2 | 2000-06-14 | 162.679603 |
| 485 | 2 | 2000-06-15 | 165.089288 |
```
---
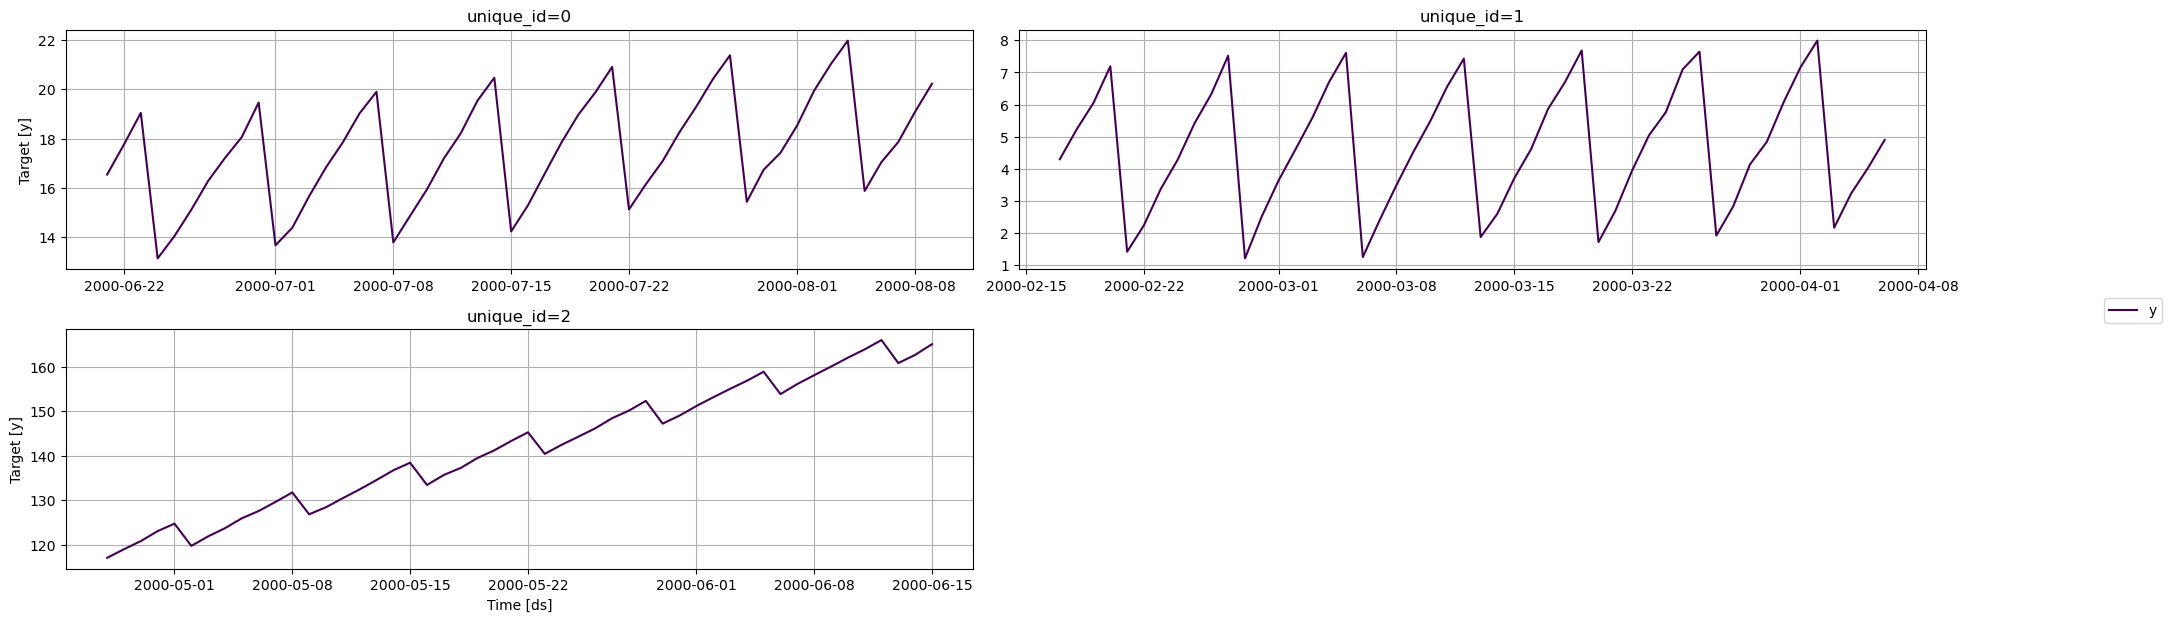
### Plotting
```python
from utilsforecast.plotting import plot_series
fig = plot_series(series, plot_random=False, max_insample_length=50, engine='matplotlib')
fig.savefig('imgs/index.png', bbox_inches='tight')
```

---
### Preprocessing
```python
from utilsforecast.preprocessing import fill_gaps
serie = series[series['unique_id'].eq(0)].tail(10)
# drop some points
with_gaps = serie.sample(frac=0.5, random_state=0).sort_values('ds')
with_gaps
```
Example output with missing dates:
```
| | unique_id | ds | y |
|-----|-----------|------------|-----------|
| 213 | 0 | 2000-08-01 | 18.543147 |
| 214 | 0 | 2000-08-02 | 19.941764 |
| 216 | 0 | 2000-08-04 | 21.968733 |
| 220 | 0 | 2000-08-08 | 19.091509 |
| 221 | 0 | 2000-08-09 | 20.220739 |
```
```python
fill_gaps(with_gaps, freq='D')
```
Returns:
```
| | unique_id | ds | y |
|-----|-----------|------------|-----------|
| 0 | 0 | 2000-08-01 | 18.543147 |
| 1 | 0 | 2000-08-02 | 19.941764 |
| 2 | 0 | 2000-08-03 | NaN |
| 3 | 0 | 2000-08-04 | 21.968733 |
| 4 | 0 | 2000-08-05 | NaN |
| 5 | 0 | 2000-08-06 | NaN |
| 6 | 0 | 2000-08-07 | NaN |
| 7 | 0 | 2000-08-08 | 19.091509 |
| 8 | 0 | 2000-08-09 | 20.220739 |
```
---
### Evaluating
```python
from functools import partial
import numpy as np
from utilsforecast.evaluation import evaluate
from utilsforecast.losses import mape, mase
```
```python
valid = series.groupby('unique_id').tail(7).copy()
train = series.drop(valid.index)
rng = np.random.RandomState(0)
valid['seas_naive'] = train.groupby('unique_id')['y'].tail(7).values
valid['rand_model'] = valid['y'] * rng.rand(valid['y'].shape[0])
daily_mase = partial(mase, seasonality=7)
evaluate(valid, metrics=[mape, daily_mase], train_df=train)
```
```
| | unique_id | metric | seas_naive | rand_model |
|-----|-----------|--------|------------|------------|
| 0 | 0 | mape | 0.024139 | 0.440173 |
| 1 | 1 | mape | 0.054259 | 0.278123 |
| 2 | 2 | mape | 0.042642 | 0.480316 |
| 3 | 0 | mase | 0.907149 | 16.418014 |
| 4 | 1 | mase | 0.991635 | 6.404254 |
| 5 | 2 | mase | 1.013596 | 11.365040 |
```
---
Raw data
{
"_id": null,
"home_page": null,
"name": "utilsforecast",
"maintainer": null,
"docs_url": null,
"requires_python": ">=3.9",
"maintainer_email": null,
"keywords": "time-series, analysis, forecasting",
"author": null,
"author_email": "Nixtla <business@nixtla.io>",
"download_url": "https://files.pythonhosted.org/packages/a8/f7/a7f20b367ca68d92c5a604a18d80662646154a154968f3bd1a7346bbed08/utilsforecast-0.2.14.tar.gz",
"platform": null,
"description": "## Install\n\n### PyPI\n\n```sh\npip install utilsforecast\n```\n\n### Conda\n\n```sh\nconda install -c conda-forge utilsforecast\n```\n\n---\n\n## How to use\n\n### Generate synthetic data\n\n```python\nfrom utilsforecast.data import generate_series\n\nseries = generate_series(3, with_trend=True, static_as_categorical=False)\nseries\n```\n\n```\n| | unique_id | ds | y |\n|-----|-----------|------------|------------|\n| 0 | 0 | 2000-01-01 | 0.422133 |\n| 1 | 0 | 2000-01-02 | 1.501407 |\n| 2 | 0 | 2000-01-03 | 2.568495 |\n| 3 | 0 | 2000-01-04 | 3.529085 |\n| 4 | 0 | 2000-01-05 | 4.481929 |\n| ... | ... | ... | ... |\n| 481 | 2 | 2000-06-11 | 163.914625 |\n| 482 | 2 | 2000-06-12 | 166.018479 |\n| 483 | 2 | 2000-06-13 | 160.839176 |\n| 484 | 2 | 2000-06-14 | 162.679603 |\n| 485 | 2 | 2000-06-15 | 165.089288 |\n```\n\n---\n\n### Plotting\n\n```python\nfrom utilsforecast.plotting import plot_series\n\nfig = plot_series(series, plot_random=False, max_insample_length=50, engine='matplotlib')\nfig.savefig('imgs/index.png', bbox_inches='tight')\n```\n\n\n\n\n---\n\n### Preprocessing\n\n```python\nfrom utilsforecast.preprocessing import fill_gaps\n\nserie = series[series['unique_id'].eq(0)].tail(10)\n# drop some points\nwith_gaps = serie.sample(frac=0.5, random_state=0).sort_values('ds')\nwith_gaps\n```\n\nExample output with missing dates:\n\n```\n| | unique_id | ds | y |\n|-----|-----------|------------|-----------|\n| 213 | 0 | 2000-08-01 | 18.543147 |\n| 214 | 0 | 2000-08-02 | 19.941764 |\n| 216 | 0 | 2000-08-04 | 21.968733 |\n| 220 | 0 | 2000-08-08 | 19.091509 |\n| 221 | 0 | 2000-08-09 | 20.220739 |\n```\n\n```python\nfill_gaps(with_gaps, freq='D')\n```\n\nReturns:\n\n```\n| | unique_id | ds | y |\n|-----|-----------|------------|-----------|\n| 0 | 0 | 2000-08-01 | 18.543147 |\n| 1 | 0 | 2000-08-02 | 19.941764 |\n| 2 | 0 | 2000-08-03 | NaN |\n| 3 | 0 | 2000-08-04 | 21.968733 |\n| 4 | 0 | 2000-08-05 | NaN |\n| 5 | 0 | 2000-08-06 | NaN |\n| 6 | 0 | 2000-08-07 | NaN |\n| 7 | 0 | 2000-08-08 | 19.091509 |\n| 8 | 0 | 2000-08-09 | 20.220739 |\n```\n\n---\n\n### Evaluating\n\n```python\nfrom functools import partial\nimport numpy as np\n\nfrom utilsforecast.evaluation import evaluate\nfrom utilsforecast.losses import mape, mase\n```\n\n```python\nvalid = series.groupby('unique_id').tail(7).copy()\ntrain = series.drop(valid.index)\n\nrng = np.random.RandomState(0)\nvalid['seas_naive'] = train.groupby('unique_id')['y'].tail(7).values\nvalid['rand_model'] = valid['y'] * rng.rand(valid['y'].shape[0])\n\ndaily_mase = partial(mase, seasonality=7)\n\nevaluate(valid, metrics=[mape, daily_mase], train_df=train)\n```\n\n\n```\n| | unique_id | metric | seas_naive | rand_model |\n|-----|-----------|--------|------------|------------|\n| 0 | 0 | mape | 0.024139 | 0.440173 |\n| 1 | 1 | mape | 0.054259 | 0.278123 |\n| 2 | 2 | mape | 0.042642 | 0.480316 |\n| 3 | 0 | mase | 0.907149 | 16.418014 |\n| 4 | 1 | mase | 0.991635 | 6.404254 |\n| 5 | 2 | mase | 1.013596 | 11.365040 |\n```\n\n---\n",
"bugtrack_url": null,
"license": "Apache Software License 2.0",
"summary": "Forecasting utilities",
"version": "0.2.14",
"project_urls": {
"Documentation": "https://nixtlaverse.verse.io/utilsforecast",
"Homepage": "https://github.com/Nixtla/utilsforecast",
"Repository": "https://github.com/Nixtla/utilsforecast"
},
"split_keywords": [
"time-series",
" analysis",
" forecasting"
],
"urls": [
{
"comment_text": null,
"digests": {
"blake2b_256": "0f9dd43985c0bfa722bfef1cb709cb4797165bdb98c082193bd702f78137d49b",
"md5": "ce8a973b2ae06396814924cbaf1c9af9",
"sha256": "5e53be3b88675f14f52b8983896e55946dd7eccbdff786066ac3bb4a22c130b9"
},
"downloads": -1,
"filename": "utilsforecast-0.2.14-py3-none-any.whl",
"has_sig": false,
"md5_digest": "ce8a973b2ae06396814924cbaf1c9af9",
"packagetype": "bdist_wheel",
"python_version": "py3",
"requires_python": ">=3.9",
"size": 41022,
"upload_time": "2025-10-06T20:48:54",
"upload_time_iso_8601": "2025-10-06T20:48:54.846296Z",
"url": "https://files.pythonhosted.org/packages/0f/9d/d43985c0bfa722bfef1cb709cb4797165bdb98c082193bd702f78137d49b/utilsforecast-0.2.14-py3-none-any.whl",
"yanked": false,
"yanked_reason": null
},
{
"comment_text": null,
"digests": {
"blake2b_256": "a8f7a7f20b367ca68d92c5a604a18d80662646154a154968f3bd1a7346bbed08",
"md5": "8d035de3abb1b09970b11b6357f19e0e",
"sha256": "7411957b1e4c7b0681704091a8e142e65cb03014699ccd949b9cec2f926d86ee"
},
"downloads": -1,
"filename": "utilsforecast-0.2.14.tar.gz",
"has_sig": false,
"md5_digest": "8d035de3abb1b09970b11b6357f19e0e",
"packagetype": "sdist",
"python_version": "source",
"requires_python": ">=3.9",
"size": 54782,
"upload_time": "2025-10-06T20:48:56",
"upload_time_iso_8601": "2025-10-06T20:48:56.360516Z",
"url": "https://files.pythonhosted.org/packages/a8/f7/a7f20b367ca68d92c5a604a18d80662646154a154968f3bd1a7346bbed08/utilsforecast-0.2.14.tar.gz",
"yanked": false,
"yanked_reason": null
}
],
"upload_time": "2025-10-06 20:48:56",
"github": true,
"gitlab": false,
"bitbucket": false,
"codeberg": false,
"github_user": "Nixtla",
"github_project": "utilsforecast",
"travis_ci": false,
"coveralls": false,
"github_actions": true,
"lcname": "utilsforecast"
}

