---
# batch-map-plotter
**batch-map-plotter** is a powerful and flexible Python tool designed for **batch plotting** of thematic maps, mainly using GeoPandas and Matplotlib.
It supports both **numeric** and **categorical** variables, **automatic binning**, **customized color maps**, **text labeling**, and **base map integration** — with full support for both **point** and **polygon geometries**. Ideal for data analysts, geospatial researchers, and anyone seeking a production-ready geographic visualization workflow.
---
---
## 🚀 Key Features Summary
* **Batch plotting multiple variables:** Plot several numeric or categorical variables at once, saving time and effort.
* **Flexible grouping:** Automatically split maps by categorical groups (e.g., regions), supporting both global and group-wise binning.
* **Smart binning strategies:** Support for natural breaks, quantiles, equal intervals, with automatic bin edge calculation.
* **Full color control:** Custom color palettes with optional reversing of colormap and legend order, alpha transparency adjustment.
* **Support for mixed data types:** Automatic detection or manual setting of variable type (numeric, categorical, mixed).
* **Labeling with overlap avoidance:** Place text labels with configurable minimum spacing to avoid clutter.
* **Geometry type adaptable:** Handles both polygon and point GeoDataFrames.
* **Basemap integration:** Add background tiles via contextily for richer geographic context.
* **High quality output:** Configurable figure size, resolution, and file saving.
* **Return updated GeoDataFrame:** Optionally get back the data with added binning columns for further analysis.
---
## 🛠 Detailed Parameters and Options
| Parameter | Type | Default | Description |
| ------------------------ | --------------- | ------------------ | --------------------------------------------------------------------------------------------------- |
| **gdf** | GeoDataFrame | — | Input GeoDataFrame containing geometry and attribute data. |
| **vars** | list of str | — | List of variable names (columns in gdf) to plot maps for. |
| **var\_config** | dict | None | Dict specifying per-variable config: type (`'numeric'`/`'categorical'`), bins, palette, order, etc. |
| **group\_by** | str | None | Column name to group data for separate map outputs (e.g., region, category). |
| **bin\_by\_group** | bool | True | Whether to bin numeric variables separately per group or use global binning across groups. |
| **data\_type** | str | `'mixed'` | Default variable type if not specified: `'numeric'`, `'categorical'`, or `'mixed'`. |
| **geometry\_type** | str | `'polygon'` | Geometry type of data, `'polygon'` or `'point'`. |
| **point\_size** | int | 30 | Marker size when plotting points. |
| **basemap** | contextily tile | None | Basemap tile provider, e.g. `contextily.providers.CartoDB.Positron`. 高德底图:`contextily.providers.Gaode.Normal ` OpenStreetMap/OSM: `contextily.providers.OpenStreetMap.Mapnik` |
| **layer\_alpha** | float (0–1) | 1.0 | Alpha transparency for the geometry fill layer. |
| **bins** | int | 5 | Number of bins for numeric variable binning. |
| **binning\_strategy** | str | `'natural_breaks'` | Binning method: `'natural_breaks'`, `'quantiles'`, or `'equal_interval'`. |
| **palette** | str or list | `'RdYlBu'` | Colormap name or list of colors for filling polygons or points. |
| **reverse\_colormap** | bool | False | Reverse the order of colors in the colormap. |
| **reverse\_legend** | bool | False | Reverse the order of items in the map legend. |
| **alpha** | float (0–1) | 0.7 | Transparency of fill colors. |
| **show\_labels** | bool | True | Whether to draw text labels on the map. |
| **label\_col** | str | `'name'` | Column used for label text. |
| **label\_min\_dist** | int | 3000 | Minimum spacing (in meters) between labels to avoid overlap. |
| **label\_fontsize** | int | 8 | Font size of the labels. |
| **fontfamily** | str | `'Arial'` | Font family used for labels, title, and legend. 中文仿宋: `'FangSong'` |
| **output\_dir** | str | `'.'` | Directory path to save output map images. |
| **dpi** | int | 300 | Resolution (dots per inch) for saved images. |
| **figsize** | tuple(int,int) | (10, 10) | Size of the output figure in inches (width, height). |
| **return\_updated\_gdf** | bool | False | Return the GeoDataFrame with added binning columns after plotting. |
---
## 🔧 Function Overview
```python
def plot_batch_maps(
gdf,
vars,
# === Variable Configuration ===
var_config=None,
group_by=None,
bin_by_group=True,
# === Geometry Settings ===
data_type='mixed',
geometry_type='polygon',
point_size=30,
basemap=None,
layer_alpha=0.5,
# === Binning & Colors ===
bins=5,
binning_strategy='natural_breaks',
palette='RdYlBu',
reverse_colormap=False,
reverse_legend=False,
alpha=0.7,
# === Labeling Options ===
show_labels=True,
label_col='name',
label_min_dist=3000,
label_fontsize=8,
fontfamily='Arial',
# === Output Settings ===
output_dir='.',
dpi=300,
figsize=(10, 10),
return_updated_gdf=False
)
```
---
## 📦 Installation
```bash
pip install batch-map-plotter
```
---
## 🌍 Example Dataset
We use the official U.S. state population projections (2020–2024) combined with geographic boundaries to demonstrate plotting features. Sample file: `assets/US_population_plot.geojson`
```markdown
| | id | name | state | pop_estimat_2020 | pop_estimat_2021 | pop_estimat_2022 | pop_estimat_2023 | pop_estimat_2024 | Change, July 1, 2023 to July 1,2024 | Change, April 1, 2020 to July 1,2024 | region | Attraction_Level |
|---:|:-----|:-----------|:-----------|-------------------:|-------------------:|-------------------:|-------------------:|-------------------:|--------------------------------------:|---------------------------------------:|:---------|:-------------------|
| 0 | AL | Alabama | Alabama | 5033094 | 5049196 | 5076181 | 5117673 | 5157699 | 40026 | 132330 | South | Moderate |
| 2 | AZ | Arizona | Arizona | 7187135 | 7274078 | 7377566 | 7473027 | 7582384 | 109357 | 424274 | West | Moderate+ |
| 3 | AR | Arkansas | Arkansas | 3014546 | 3026870 | 3047704 | 3069463 | 3088354 | 18891 | 76801 | South | Moderate- |
| 4 | CA | California | California | 39521958 | 39142565 | 39142414 | 39198693 | 39431263 | 232570 | -124411 | West | Weak |
| 5 | CO | Colorado | Colorado | 5787129 | 5814036 | 5850935 | 5901339 | 5957493 | 56154 | 182169 | West | Moderate |
```
## 🧪 Usage Examples
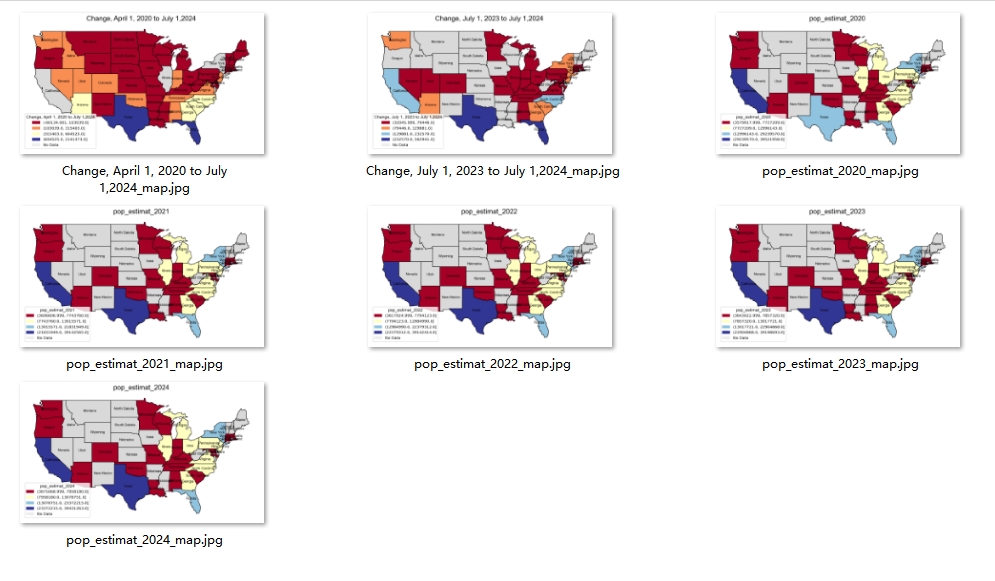
### 1. Basic: Plot multiple numeric variables
```python
#read file:
import geopandas as gpd
from batch_map_plotter import plot_batch_maps
US_pop = gpd.read_file('assets/US_population_plot.geojson')
plot_batch_maps(
gdf=US_pop,
vars=['pop_estimat_2020', 'pop_estimat_2021',
'pop_estimat_2022', 'pop_estimat_2023', 'pop_estimat_2024',
'Change, July 1, 2023 to July 1,2024',
'Change, April 1, 2020 to July 1,2024'],
bins=5,
binning_strategy='natural_breaks',
palette='RdYlBu',
show_labels=True,
label_col='name',
dpi=300,
figsize=(10, 10),
return_updated_gdf=False,
output_dir="."
)
```
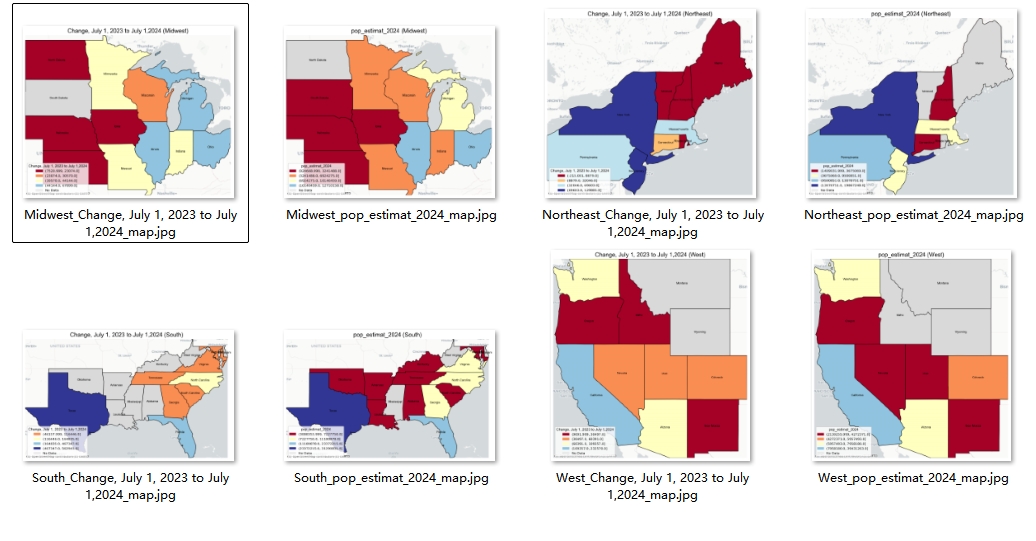
### 2. Grouped Maps with Basemap ( !! group-wise binning by default !! )
```python
import contextily
plot_batch_maps(
gdf=US_pop,
vars=["pop_estimat_2024", 'Change, July 1, 2023 to July 1,2024'],
group_by="region",
basemap=contextily.providers.CartoDB.Positron,
output_dir="."
)
```
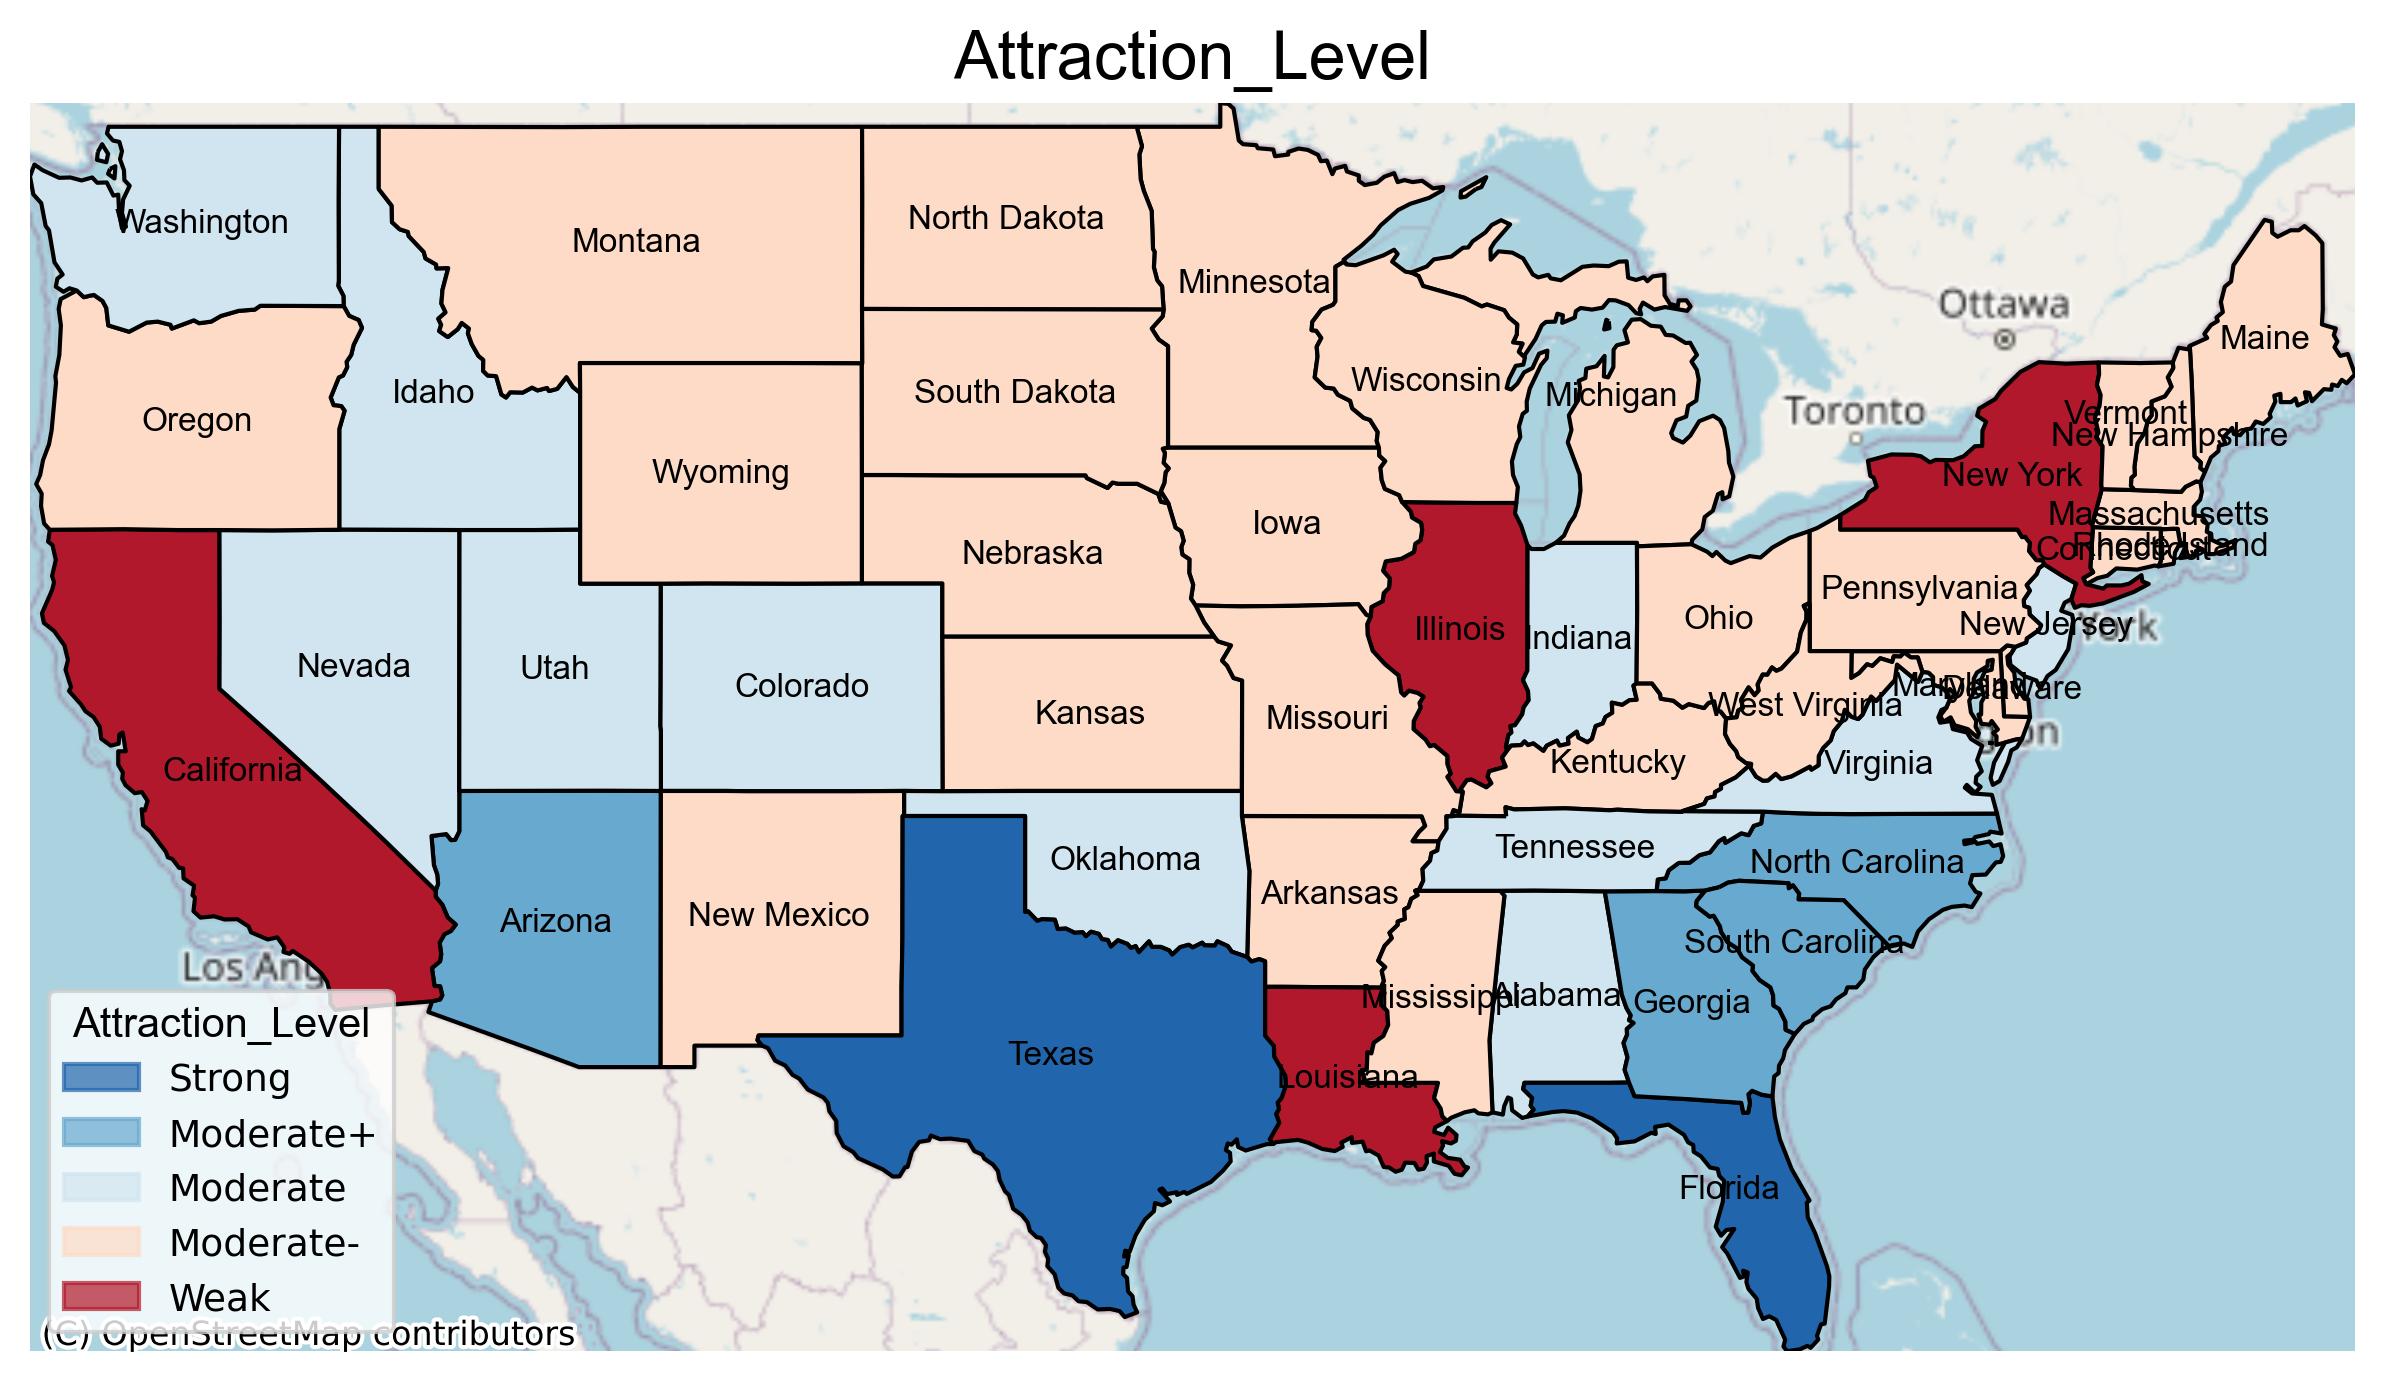
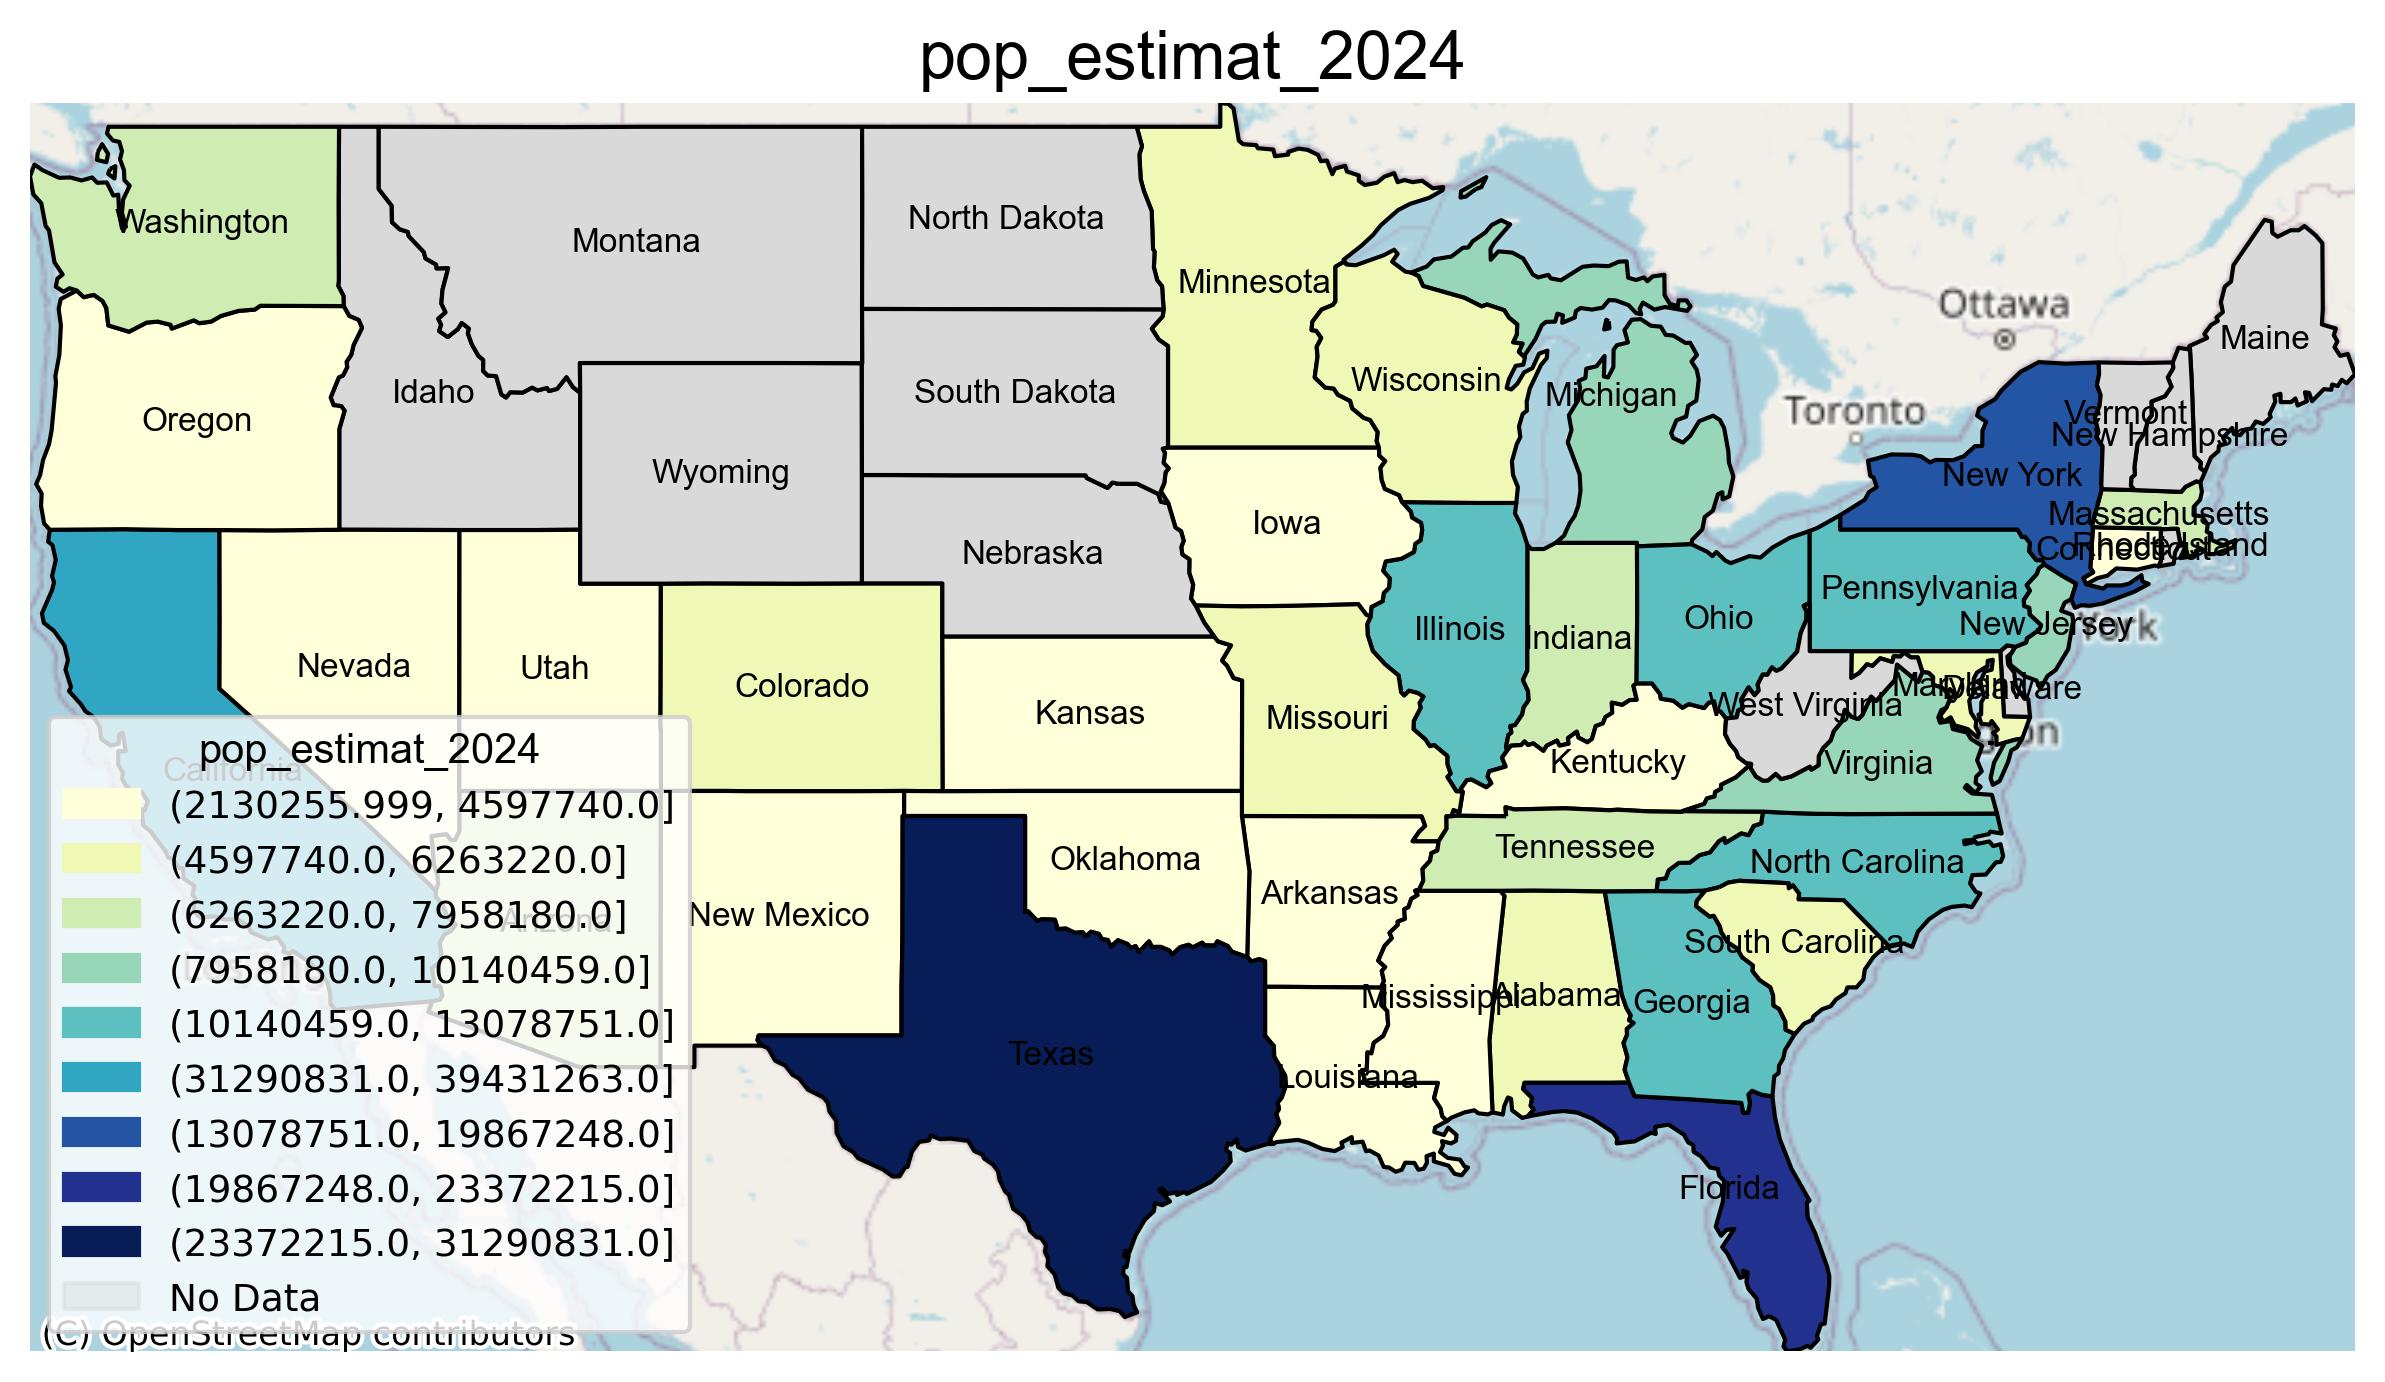
### 3. Custom Config Example
```python
var_config = {
"Attraction_Level": {
"type": "categorical",
"order": ["Strong", "Moderate+", "Moderate", "Moderate-", "Weak"],
"order_by": "good_to_bad",
"palette": ["#2166ac", "#67a9cf", "#d1e5f0", "#fddbc7", "#b2182b"]
},
"pop_estimat_2024": {
"type": "numeric",
"bins": 10,
"strategy": "natural_breaks",
"palette": "YlGnBu"
}
}
plot_batch_maps(
gdf=US_pop,
vars=["Attraction_Level", "pop_estimat_2024"],
var_config=var_config,
basemap=contextily.providers.OpenStreetMap.Mapnik,
label_col="name",
reverse_legend=False,
output_dir="."
)
```
**population attraction level by state:**
---
## 📜 License
MIT License
Raw data
{
"_id": null,
"home_page": null,
"name": "batch-map-plotter",
"maintainer": null,
"docs_url": null,
"requires_python": null,
"maintainer_email": null,
"keywords": "geopandas, matplotlib, thematic-maps, geospatial, choropleth, map-visualization, batch-plotting, cartography, data-visualization",
"author": null,
"author_email": "Luyi Zhao <tysxchina@163.com>",
"download_url": "https://files.pythonhosted.org/packages/b1/9f/591655d3bbfa7969c7768307a611934f0bab6e5802dd2fe9ed7dd1c7d6eb/batch_map_plotter-0.1.0.tar.gz",
"platform": null,
"description": "\r\n---\r\n\r\n# batch-map-plotter\r\n\r\n**batch-map-plotter** is a powerful and flexible Python tool designed for **batch plotting** of thematic maps, mainly using GeoPandas and Matplotlib.\r\n\r\nIt supports both **numeric** and **categorical** variables, **automatic binning**, **customized color maps**, **text labeling**, and **base map integration** \u2014 with full support for both **point** and **polygon geometries**. Ideal for data analysts, geospatial researchers, and anyone seeking a production-ready geographic visualization workflow.\r\n\r\n---\r\n\r\n\r\n\r\n---\r\n\r\n## \ud83d\ude80 Key Features Summary\r\n\r\n* **Batch plotting multiple variables:** Plot several numeric or categorical variables at once, saving time and effort.\r\n* **Flexible grouping:** Automatically split maps by categorical groups (e.g., regions), supporting both global and group-wise binning.\r\n* **Smart binning strategies:** Support for natural breaks, quantiles, equal intervals, with automatic bin edge calculation.\r\n* **Full color control:** Custom color palettes with optional reversing of colormap and legend order, alpha transparency adjustment.\r\n* **Support for mixed data types:** Automatic detection or manual setting of variable type (numeric, categorical, mixed).\r\n* **Labeling with overlap avoidance:** Place text labels with configurable minimum spacing to avoid clutter.\r\n* **Geometry type adaptable:** Handles both polygon and point GeoDataFrames.\r\n* **Basemap integration:** Add background tiles via contextily for richer geographic context.\r\n* **High quality output:** Configurable figure size, resolution, and file saving.\r\n* **Return updated GeoDataFrame:** Optionally get back the data with added binning columns for further analysis.\r\n\r\n---\r\n\r\n## \ud83d\udee0 Detailed Parameters and Options\r\n\r\n| Parameter | Type | Default | Description |\r\n| ------------------------ | --------------- | ------------------ | --------------------------------------------------------------------------------------------------- |\r\n| **gdf** | GeoDataFrame | \u2014 | Input GeoDataFrame containing geometry and attribute data. |\r\n| **vars** | list of str | \u2014 | List of variable names (columns in gdf) to plot maps for. |\r\n| **var\\_config** | dict | None | Dict specifying per-variable config: type (`'numeric'`/`'categorical'`), bins, palette, order, etc. |\r\n| **group\\_by** | str | None | Column name to group data for separate map outputs (e.g., region, category). |\r\n| **bin\\_by\\_group** | bool | True | Whether to bin numeric variables separately per group or use global binning across groups. |\r\n| **data\\_type** | str | `'mixed'` | Default variable type if not specified: `'numeric'`, `'categorical'`, or `'mixed'`. |\r\n| **geometry\\_type** | str | `'polygon'` | Geometry type of data, `'polygon'` or `'point'`. |\r\n| **point\\_size** | int | 30 | Marker size when plotting points. |\r\n| **basemap** | contextily tile | None | Basemap tile provider, e.g. `contextily.providers.CartoDB.Positron`. \u9ad8\u5fb7\u5e95\u56fe\uff1a`contextily.providers.Gaode.Normal ` OpenStreetMap/OSM: `contextily.providers.OpenStreetMap.Mapnik` |\r\n| **layer\\_alpha** | float (0\u20131) | 1.0 | Alpha transparency for the geometry fill layer. |\r\n| **bins** | int | 5 | Number of bins for numeric variable binning. |\r\n| **binning\\_strategy** | str | `'natural_breaks'` | Binning method: `'natural_breaks'`, `'quantiles'`, or `'equal_interval'`. |\r\n| **palette** | str or list | `'RdYlBu'` | Colormap name or list of colors for filling polygons or points. |\r\n| **reverse\\_colormap** | bool | False | Reverse the order of colors in the colormap. |\r\n| **reverse\\_legend** | bool | False | Reverse the order of items in the map legend. |\r\n| **alpha** | float (0\u20131) | 0.7 | Transparency of fill colors. |\r\n| **show\\_labels** | bool | True | Whether to draw text labels on the map. |\r\n| **label\\_col** | str | `'name'` | Column used for label text. |\r\n| **label\\_min\\_dist** | int | 3000 | Minimum spacing (in meters) between labels to avoid overlap. |\r\n| **label\\_fontsize** | int | 8 | Font size of the labels. |\r\n| **fontfamily** | str | `'Arial'` | Font family used for labels, title, and legend. \u4e2d\u6587\u4eff\u5b8b\uff1a `'FangSong'` |\r\n| **output\\_dir** | str | `'.'` | Directory path to save output map images. |\r\n| **dpi** | int | 300 | Resolution (dots per inch) for saved images. |\r\n| **figsize** | tuple(int,int) | (10, 10) | Size of the output figure in inches (width, height). |\r\n| **return\\_updated\\_gdf** | bool | False | Return the GeoDataFrame with added binning columns after plotting. |\r\n\r\n---\r\n\r\n## \ud83d\udd27 Function Overview\r\n\r\n```python\r\ndef plot_batch_maps(\r\n gdf,\r\n vars,\r\n\r\n # === Variable Configuration ===\r\n var_config=None,\r\n group_by=None,\r\n bin_by_group=True,\r\n\r\n # === Geometry Settings ===\r\n data_type='mixed',\r\n geometry_type='polygon',\r\n point_size=30,\r\n basemap=None,\r\n layer_alpha=0.5,\r\n\r\n # === Binning & Colors ===\r\n bins=5,\r\n binning_strategy='natural_breaks',\r\n palette='RdYlBu',\r\n reverse_colormap=False,\r\n reverse_legend=False,\r\n alpha=0.7,\r\n\r\n # === Labeling Options ===\r\n show_labels=True,\r\n label_col='name',\r\n label_min_dist=3000,\r\n label_fontsize=8,\r\n fontfamily='Arial',\r\n\r\n # === Output Settings ===\r\n output_dir='.',\r\n dpi=300,\r\n figsize=(10, 10),\r\n return_updated_gdf=False\r\n)\r\n```\r\n\r\n---\r\n\r\n## \ud83d\udce6 Installation\r\n\r\n```bash\r\npip install batch-map-plotter\r\n```\r\n\r\n---\r\n\r\n## \ud83c\udf0d Example Dataset\r\n\r\nWe use the official U.S. state population projections (2020\u20132024) combined with geographic boundaries to demonstrate plotting features. Sample file: `assets/US_population_plot.geojson`\r\n\r\n```markdown\r\n| | id | name | state | pop_estimat_2020 | pop_estimat_2021 | pop_estimat_2022 | pop_estimat_2023 | pop_estimat_2024 | Change, July 1, 2023 to July 1,2024 | Change, April 1, 2020 to July 1,2024 | region | Attraction_Level |\r\n|---:|:-----|:-----------|:-----------|-------------------:|-------------------:|-------------------:|-------------------:|-------------------:|--------------------------------------:|---------------------------------------:|:---------|:-------------------|\r\n| 0 | AL | Alabama | Alabama | 5033094 | 5049196 | 5076181 | 5117673 | 5157699 | 40026 | 132330 | South | Moderate |\r\n| 2 | AZ | Arizona | Arizona | 7187135 | 7274078 | 7377566 | 7473027 | 7582384 | 109357 | 424274 | West | Moderate+ |\r\n| 3 | AR | Arkansas | Arkansas | 3014546 | 3026870 | 3047704 | 3069463 | 3088354 | 18891 | 76801 | South | Moderate- |\r\n| 4 | CA | California | California | 39521958 | 39142565 | 39142414 | 39198693 | 39431263 | 232570 | -124411 | West | Weak |\r\n| 5 | CO | Colorado | Colorado | 5787129 | 5814036 | 5850935 | 5901339 | 5957493 | 56154 | 182169 | West | Moderate |\r\n```\r\n\r\n## \ud83e\uddea Usage Examples\r\n\r\n### 1. Basic: Plot multiple numeric variables\r\n\r\n```python\r\n\r\n#read file:\r\nimport geopandas as gpd\r\nfrom batch_map_plotter import plot_batch_maps\r\n\r\nUS_pop = gpd.read_file('assets/US_population_plot.geojson')\r\n\r\n\r\nplot_batch_maps(\r\n gdf=US_pop,\r\n vars=['pop_estimat_2020', 'pop_estimat_2021',\r\n 'pop_estimat_2022', 'pop_estimat_2023', 'pop_estimat_2024',\r\n 'Change, July 1, 2023 to July 1,2024',\r\n 'Change, April 1, 2020 to July 1,2024'],\r\n\r\n bins=5,\r\n binning_strategy='natural_breaks',\r\n palette='RdYlBu',\r\n\r\n show_labels=True,\r\n label_col='name',\r\n\r\n dpi=300,\r\n figsize=(10, 10),\r\n return_updated_gdf=False,\r\n\r\n output_dir=\".\"\r\n)\r\n```\r\n\r\n\r\n\r\n### 2. Grouped Maps with Basemap ( !! group-wise binning by default !! )\r\n\r\n```python\r\nimport contextily\r\n\r\nplot_batch_maps(\r\n gdf=US_pop,\r\n vars=[\"pop_estimat_2024\", 'Change, July 1, 2023 to July 1,2024'],\r\n group_by=\"region\",\r\n basemap=contextily.providers.CartoDB.Positron,\r\n output_dir=\".\"\r\n)\r\n```\r\n\r\n\r\n\r\n\r\n\r\n### 3. Custom Config Example\r\n\r\n```python\r\nvar_config = {\r\n \"Attraction_Level\": {\r\n \"type\": \"categorical\",\r\n \"order\": [\"Strong\", \"Moderate+\", \"Moderate\", \"Moderate-\", \"Weak\"],\r\n \"order_by\": \"good_to_bad\",\r\n \"palette\": [\"#2166ac\", \"#67a9cf\", \"#d1e5f0\", \"#fddbc7\", \"#b2182b\"]\r\n },\r\n \"pop_estimat_2024\": {\r\n \"type\": \"numeric\",\r\n \"bins\": 10,\r\n \"strategy\": \"natural_breaks\",\r\n \"palette\": \"YlGnBu\"\r\n }\r\n}\r\n\r\nplot_batch_maps(\r\n gdf=US_pop,\r\n vars=[\"Attraction_Level\", \"pop_estimat_2024\"],\r\n var_config=var_config,\r\n basemap=contextily.providers.OpenStreetMap.Mapnik,\r\n label_col=\"name\",\r\n reverse_legend=False,\r\n output_dir=\".\"\r\n)\r\n```\r\n\r\n\r\n **population attraction level by state:** \r\n\r\n\r\n\r\n\r\n\r\n\r\n\r\n---\r\n\r\n## \ud83d\udcdc License\r\n\r\nMIT License\r\n\r\n\r\n",
"bugtrack_url": null,
"license": "MIT",
"summary": "A flexible tool for batch plotting of thematic maps using GeoPandas and Matplotlib.",
"version": "0.1.0",
"project_urls": {
"Homepage": "https://github.com/Louisjzhao/batch-map-plotter"
},
"split_keywords": [
"geopandas",
" matplotlib",
" thematic-maps",
" geospatial",
" choropleth",
" map-visualization",
" batch-plotting",
" cartography",
" data-visualization"
],
"urls": [
{
"comment_text": null,
"digests": {
"blake2b_256": "c1c551679c04e4fa72bcb27dc96c350dfd2aa9dae5a45f436036115fe21987a9",
"md5": "2a7bb766e61b69264171c444bcfa451f",
"sha256": "e447486561d8ce34a68cb006c3872e735b0b7f3bdd0d1a86d50322f6f1af5fd1"
},
"downloads": -1,
"filename": "batch_map_plotter-0.1.0-py3-none-any.whl",
"has_sig": false,
"md5_digest": "2a7bb766e61b69264171c444bcfa451f",
"packagetype": "bdist_wheel",
"python_version": "py3",
"requires_python": null,
"size": 5791,
"upload_time": "2025-07-16T11:34:36",
"upload_time_iso_8601": "2025-07-16T11:34:36.337180Z",
"url": "https://files.pythonhosted.org/packages/c1/c5/51679c04e4fa72bcb27dc96c350dfd2aa9dae5a45f436036115fe21987a9/batch_map_plotter-0.1.0-py3-none-any.whl",
"yanked": false,
"yanked_reason": null
},
{
"comment_text": null,
"digests": {
"blake2b_256": "b19f591655d3bbfa7969c7768307a611934f0bab6e5802dd2fe9ed7dd1c7d6eb",
"md5": "35f4ecc0a80d40b78131c6510ab24014",
"sha256": "5be0da38d8bb2939daeeadbd349d66310ce1e7eaf588bdd3872d74c84094ba8c"
},
"downloads": -1,
"filename": "batch_map_plotter-0.1.0.tar.gz",
"has_sig": false,
"md5_digest": "35f4ecc0a80d40b78131c6510ab24014",
"packagetype": "sdist",
"python_version": "source",
"requires_python": null,
"size": 5934,
"upload_time": "2025-07-16T11:34:37",
"upload_time_iso_8601": "2025-07-16T11:34:37.566363Z",
"url": "https://files.pythonhosted.org/packages/b1/9f/591655d3bbfa7969c7768307a611934f0bab6e5802dd2fe9ed7dd1c7d6eb/batch_map_plotter-0.1.0.tar.gz",
"yanked": false,
"yanked_reason": null
}
],
"upload_time": "2025-07-16 11:34:37",
"github": true,
"gitlab": false,
"bitbucket": false,
"codeberg": false,
"github_user": "Louisjzhao",
"github_project": "batch-map-plotter",
"travis_ci": false,
"coveralls": false,
"github_actions": false,
"requirements": [
{
"name": "geopandas",
"specs": []
},
{
"name": "pandas",
"specs": []
},
{
"name": "matplotlib",
"specs": []
},
{
"name": "numpy",
"specs": []
},
{
"name": "shapely",
"specs": []
},
{
"name": "mapclassify",
"specs": []
},
{
"name": "contextily",
"specs": []
}
],
"lcname": "batch-map-plotter"
}

