# Welcome to leafmap
[](https://studiolab.sagemaker.aws/import/github/opengeos/leafmap/blob/master/examples/notebooks/00_key_features.ipynb)
[](https://colab.research.google.com/github/opengeos/leafmap/blob/master)
[](https://mybinder.org/v2/gh/opengeos/leafmap/HEAD)
[](https://pypi.python.org/pypi/leafmap)
[](https://pepy.tech/project/leafmap)
[](https://github.com/conda-forge/leafmap-feedstock)
[](https://anaconda.org/conda-forge/leafmap)
[](https://anaconda.org/conda-forge/leafmap)
[](https://leafmap.org)
[](https://results.pre-commit.ci/latest/github/opengeos/leafmap/master)
[](https://opensource.org/licenses/MIT)
[](https://youtube.com/@giswqs)
[](https://doi.org/10.21105/joss.03414)
[](https://github.com/opengeos/leafmap/blob/master/docs/assets/logo.png)
**A Python package for geospatial analysis and interactive mapping in a Jupyter environment.**
- GitHub repo: <https://github.com/opengeos/leafmap>
- Documentation: <https://leafmap.org>
- PyPI: <https://pypi.org/project/leafmap>
- Conda-forge: <https://anaconda.org/conda-forge/leafmap>
- Leafmap tutorials on YouTube: <https://youtube.com/@giswqs>
- Free software: [MIT license](https://opensource.org/licenses/MIT)
Join our Discord server 👇
[](https://discord.gg/UgZecTUq5P)
## Introduction
**Leafmap** is a Python package for interactive mapping and geospatial analysis with minimal coding in a Jupyter environment. It is a spin-off project of the [geemap](https://geemap.org) Python package, which was designed specifically to work with [Google Earth Engine](https://earthengine.google.com) (GEE). However, not everyone in the geospatial community has access to the GEE cloud computing platform. Leafmap is designed to fill this gap for non-GEE users. It is a free and open-source Python package that enables users to analyze and visualize geospatial data with minimal coding in a Jupyter environment, such as Google Colab, Jupyter Notebook, JupyterLab, and [marimo](https://github.com/marimo-team/marimo). Leafmap is built upon several open-source packages, such as [folium](https://github.com/python-visualization/folium) and [ipyleaflet](https://github.com/jupyter-widgets/ipyleaflet) (for creating interactive maps), [WhiteboxTools](https://github.com/jblindsay/whitebox-tools) and [whiteboxgui](https://github.com/opengeos/whiteboxgui) (for analyzing geospatial data), and [ipywidgets](https://github.com/jupyter-widgets/ipywidgets) (for designing interactive graphical user interface [GUI]). Leafmap has a toolset with various interactive tools that allow users to load vector and raster data onto the map without coding. In addition, users can use the powerful analytical backend (i.e., WhiteboxTools) to perform geospatial analysis directly within the leafmap user interface without writing a single line of code. The WhiteboxTools library currently contains **500+** tools for advanced geospatial analysis, such as [GIS Analysis](https://jblindsay.github.io/wbt_book/available_tools/gis_analysis.html), [Geomorphometric Analysis](https://jblindsay.github.io/wbt_book/available_tools/geomorphometric_analysis.html), [Hydrological Analysis](https://jblindsay.github.io/wbt_book/available_tools/hydrological_analysis.html), [LiDAR Data Analysis](https://jblindsay.github.io/wbt_book/available_tools/lidar_tools.html), [Mathematical and Statistical Analysis](https://jblindsay.github.io/wbt_book/available_tools/mathand_stats_tools.html), and [Stream Network Analysis](https://jblindsay.github.io/wbt_book/available_tools/stream_network_analysis.html).
## Statement of Need
There is a plethora of Python packages for geospatial analysis, such as [geopandas](https://geopandas.org) for vector data analysis and [xarray](https://docs.xarray.dev) for raster data analysis. As listed at [pyviz.org](https://pyviz.org), there are also many options for plotting data on a map in Python, ranging from libraries focused specifically on maps like [ipyleaflet](https://ipyleaflet.readthedocs.io) and [folium](https://python-visualization.github.io/folium) to general-purpose plotting tools that also support geospatial data types, such as [hvPlot](https://hvplot.pyviz.org), [bokeh](http://bokeh.org), and [plotly](https://plotly.com/python). While these tools provide powerful capabilities, displaying geospatial data from different file formats on an interactive map and performing basic analyses can be challenging, especially for users with limited coding skills. Furthermore, many tools lack bi-directional communication between the frontend (browser) and the backend (Python), limiting their interactivity and usability for exploring map data.
Leafmap addresses these challenges by leveraging the bidirectional communication provided by ipyleaflet, enabling users to load and visualize geospatial datasets with just one line of code. Leafmap also provides an interactive graphical user interface (GUI) for loading geospatial datasets without any coding. It is designed for anyone who wants to analyze and visualize geospatial data interactively in a Jupyter environment, making it particularly accessible for novice users with limited programming skills. Advanced programmers can also benefit from leafmap for geospatial data analysis and building interactive web applications.
## Usage
Launch the interactive notebook tutorial for the **leafmap** Python package with Google Colab, Binder, or Amazon Sagemaker Studio Lab now:
[](https://colab.research.google.com/github/opengeos/leafmap/blob/master)
[](https://mybinder.org/v2/gh/opengeos/leafmap/HEAD)
[](https://studiolab.sagemaker.aws/import/github/opengeos/leafmap/blob/master/examples/notebooks/00_key_features.ipynb)
Check out this excellent article on Medium - [Leafmap a new Python Package for Geospatial data science](https://link.medium.com/HRRKDcynYgb)
To learn more about leafmap, check out the leafmap documentation website - <https://leafmap.org>

## Key Features
Leafmap offers a wide range of features and capabilities that empower geospatial data scientists, researchers, and developers to unlock the potential of their data. Some of the key features include:
- **Creating an interactive map with just one line of code:** Leafmap makes it easy to create an interactive map by providing a simple API that allows you to load and visualize geospatial datasets with minimal coding.
- **Switching between different mapping backends:** Leafmap supports multiple mapping backends, including ipyleaflet, folium, kepler.gl, pydeck, and bokeh. You can switch between these backends to create maps with different visualization styles and capabilities.
- **Changing basemaps interactively:** Leafmap allows you to change basemaps interactively, providing a variety of options such as OpenStreetMap, Stamen Terrain, CartoDB Positron, and many more.
- **Adding XYZ, WMS, and vector tile services:** You can easily add XYZ, WMS, and vector tile services to your map, allowing you to overlay additional geospatial data from various sources.
- **Displaying vector data:** Leafmap supports various vector data formats, including Shapefile, GeoJSON, GeoPackage, and any vector format supported by GeoPandas. You can load and display vector data on the map, enabling you to visualize and analyze spatial features.
- **Displaying raster data:** Leafmap allows you to load and display raster data, such as GeoTIFFs, on the map. This feature is useful for visualizing satellite imagery, digital elevation models, and other gridded datasets.
- **Creating custom legends and colorbars:** Leafmap provides tools for customizing legends and colorbars on the map, allowing you to represent data values with different colors and corresponding labels.
- **Creating split-panel maps and linked maps:** With Leafmap, you can create split-panel maps to compare different datasets side by side. You can also create linked maps that synchronize interactions between multiple maps, providing a coordinated view of different spatial data.
- **Downloading and visualizing OpenStreetMap data:** Leafmap allows you to download and visualize OpenStreetMap data, providing access to detailed street maps, buildings, and other points of interest.
- **Creating and editing vector data interactively:** Leafmap includes tools for creating and editing vector data interactively on the map. You can draw points, lines, and polygons, and modify them as needed.
- **Searching for geospatial data:** Leafmap provides functionality for searching and accessing geospatial data from sources such as SpatialTemporal Asset Catalogs (STAC), Microsoft Planetary Computer, AWS Open Data Registry, and OpenAerialMap.
- **Inspecting pixel values interactively:** Leafmap allows you to interactively inspect pixel values in raster datasets, helping you analyze and understand the data at a more granular level.
- **Creating choropleth maps and heat maps:** Leafmap supports the creation of choropleth maps, where colors represent different data values for specific geographic areas. You can also create heat maps to visualize data density.
- **Displaying data from a PostGIS database:** Leafmap provides tools for connecting to a PostGIS database and displaying spatial data stored in the database on the map.
- **Creating time series animations:** Leafmap enables the creation of time series animations from both vector and raster data, allowing you to visualize temporal changes in your geospatial datasets.
- **Analyzing geospatial data with whitebox:** Leafmap integrates with WhiteboxTools and whiteboxgui, providing a suite of geospatial analyses, such as hydrological analysis, terrain analysis, and LiDAR processing.
- **Segmenting and classifying remote sensing imagery:** Leafmap integrates the segment-geospatial package, which provides tools for segmenting and classifying remote sensing imagery using deep learning algorithms.
- **Building interactive web apps:** Leafmap supports the development of interactive web applications using frameworks like Voila, Streamlit, and Solara. This allows you to share your geospatial analyses and visualizations with others in a user-friendly web interface.
These features and capabilities make leafmap a powerful tool for geospatial data exploration, analysis, and visualization. Whether you are a beginner or an experienced geospatial data scientist, leafmap provides an accessible and efficient way to work with geospatial data in Python.
## Citations
If you find **leafmap** useful in your research, please consider citing the following paper to support my work. Thank you for your support.
- Wu, Q. (2021). Leafmap: A Python package for interactive mapping and geospatial analysis with minimal coding in a Jupyter environment. _Journal of Open Source Software_, 6(63), 3414. <https://doi.org/10.21105/joss.03414>
## Demo
## YouTube Channel
I have created a [YouTube Channel](https://youtube.com/@giswqs) for sharing geospatial tutorials. You can subscribe to my channel for regular updates. Check out the following videos for 3D mapping with MapLibre and Leafmap.
[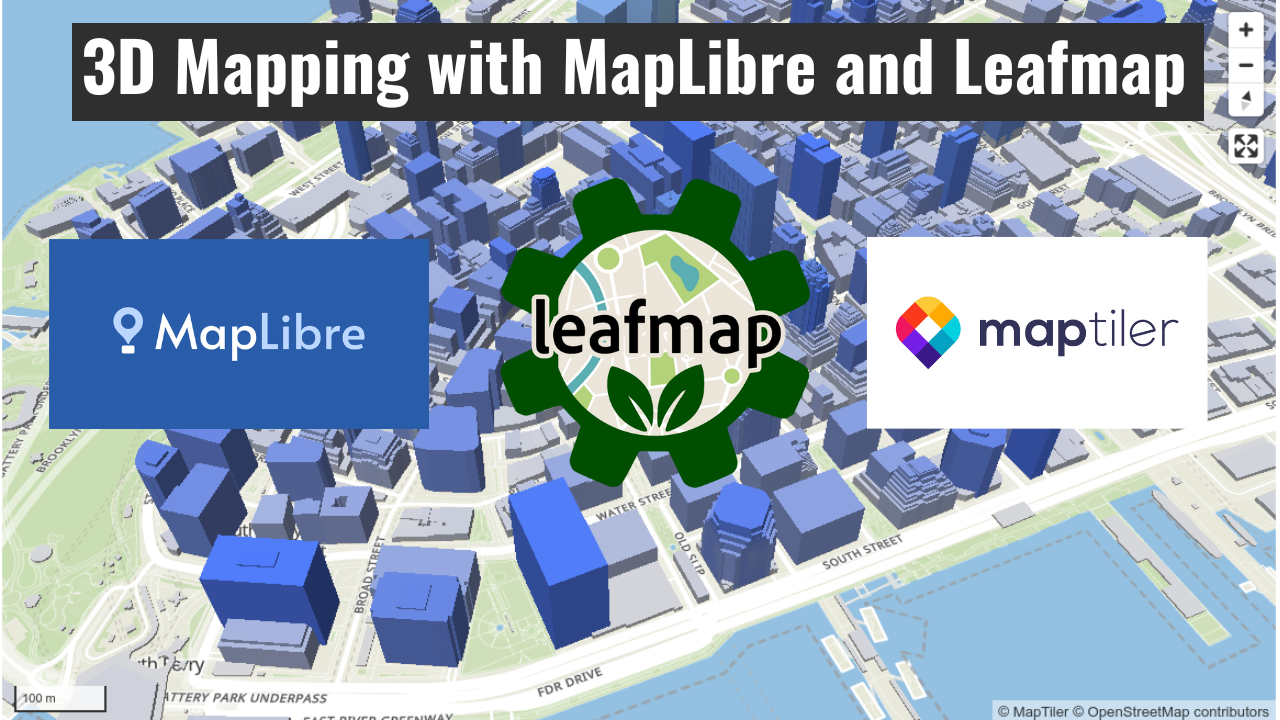](https://bit.ly/maplibre)
Raw data
{
"_id": null,
"home_page": null,
"name": "leafmap",
"maintainer": null,
"docs_url": null,
"requires_python": ">=3.9",
"maintainer_email": null,
"keywords": "leafmap",
"author": null,
"author_email": "Qiusheng Wu <giswqs@gmail.com>",
"download_url": "https://files.pythonhosted.org/packages/a2/ac/6bba7c5bbc5e46af21f2fd8a06de8bc0a29a52702dd8fa4270b5239b55ad/leafmap-0.57.1.tar.gz",
"platform": null,
"description": "# Welcome to leafmap\n\n[](https://studiolab.sagemaker.aws/import/github/opengeos/leafmap/blob/master/examples/notebooks/00_key_features.ipynb)\n[](https://colab.research.google.com/github/opengeos/leafmap/blob/master)\n[](https://mybinder.org/v2/gh/opengeos/leafmap/HEAD)\n[](https://pypi.python.org/pypi/leafmap)\n[](https://pepy.tech/project/leafmap)\n[](https://github.com/conda-forge/leafmap-feedstock)\n[](https://anaconda.org/conda-forge/leafmap)\n[](https://anaconda.org/conda-forge/leafmap)\n[](https://leafmap.org)\n[](https://results.pre-commit.ci/latest/github/opengeos/leafmap/master)\n[](https://opensource.org/licenses/MIT)\n[](https://youtube.com/@giswqs)\n[](https://doi.org/10.21105/joss.03414)\n\n[](https://github.com/opengeos/leafmap/blob/master/docs/assets/logo.png)\n\n**A Python package for geospatial analysis and interactive mapping in a Jupyter environment.**\n\n- GitHub repo: <https://github.com/opengeos/leafmap>\n- Documentation: <https://leafmap.org>\n- PyPI: <https://pypi.org/project/leafmap>\n- Conda-forge: <https://anaconda.org/conda-forge/leafmap>\n- Leafmap tutorials on YouTube: <https://youtube.com/@giswqs>\n- Free software: [MIT license](https://opensource.org/licenses/MIT)\n\nJoin our Discord server \ud83d\udc47\n\n[](https://discord.gg/UgZecTUq5P)\n\n## Introduction\n\n**Leafmap** is a Python package for interactive mapping and geospatial analysis with minimal coding in a Jupyter environment. It is a spin-off project of the [geemap](https://geemap.org) Python package, which was designed specifically to work with [Google Earth Engine](https://earthengine.google.com) (GEE). However, not everyone in the geospatial community has access to the GEE cloud computing platform. Leafmap is designed to fill this gap for non-GEE users. It is a free and open-source Python package that enables users to analyze and visualize geospatial data with minimal coding in a Jupyter environment, such as Google Colab, Jupyter Notebook, JupyterLab, and [marimo](https://github.com/marimo-team/marimo). Leafmap is built upon several open-source packages, such as [folium](https://github.com/python-visualization/folium) and [ipyleaflet](https://github.com/jupyter-widgets/ipyleaflet) (for creating interactive maps), [WhiteboxTools](https://github.com/jblindsay/whitebox-tools) and [whiteboxgui](https://github.com/opengeos/whiteboxgui) (for analyzing geospatial data), and [ipywidgets](https://github.com/jupyter-widgets/ipywidgets) (for designing interactive graphical user interface [GUI]). Leafmap has a toolset with various interactive tools that allow users to load vector and raster data onto the map without coding. In addition, users can use the powerful analytical backend (i.e., WhiteboxTools) to perform geospatial analysis directly within the leafmap user interface without writing a single line of code. The WhiteboxTools library currently contains **500+** tools for advanced geospatial analysis, such as [GIS Analysis](https://jblindsay.github.io/wbt_book/available_tools/gis_analysis.html), [Geomorphometric Analysis](https://jblindsay.github.io/wbt_book/available_tools/geomorphometric_analysis.html), [Hydrological Analysis](https://jblindsay.github.io/wbt_book/available_tools/hydrological_analysis.html), [LiDAR Data Analysis](https://jblindsay.github.io/wbt_book/available_tools/lidar_tools.html), [Mathematical and Statistical Analysis](https://jblindsay.github.io/wbt_book/available_tools/mathand_stats_tools.html), and [Stream Network Analysis](https://jblindsay.github.io/wbt_book/available_tools/stream_network_analysis.html).\n\n## Statement of Need\n\nThere is a plethora of Python packages for geospatial analysis, such as [geopandas](https://geopandas.org) for vector data analysis and [xarray](https://docs.xarray.dev) for raster data analysis. As listed at [pyviz.org](https://pyviz.org), there are also many options for plotting data on a map in Python, ranging from libraries focused specifically on maps like [ipyleaflet](https://ipyleaflet.readthedocs.io) and [folium](https://python-visualization.github.io/folium) to general-purpose plotting tools that also support geospatial data types, such as [hvPlot](https://hvplot.pyviz.org), [bokeh](http://bokeh.org), and [plotly](https://plotly.com/python). While these tools provide powerful capabilities, displaying geospatial data from different file formats on an interactive map and performing basic analyses can be challenging, especially for users with limited coding skills. Furthermore, many tools lack bi-directional communication between the frontend (browser) and the backend (Python), limiting their interactivity and usability for exploring map data.\n\nLeafmap addresses these challenges by leveraging the bidirectional communication provided by ipyleaflet, enabling users to load and visualize geospatial datasets with just one line of code. Leafmap also provides an interactive graphical user interface (GUI) for loading geospatial datasets without any coding. It is designed for anyone who wants to analyze and visualize geospatial data interactively in a Jupyter environment, making it particularly accessible for novice users with limited programming skills. Advanced programmers can also benefit from leafmap for geospatial data analysis and building interactive web applications.\n\n## Usage\n\nLaunch the interactive notebook tutorial for the **leafmap** Python package with Google Colab, Binder, or Amazon Sagemaker Studio Lab now:\n\n[](https://colab.research.google.com/github/opengeos/leafmap/blob/master)\n[](https://mybinder.org/v2/gh/opengeos/leafmap/HEAD)\n[](https://studiolab.sagemaker.aws/import/github/opengeos/leafmap/blob/master/examples/notebooks/00_key_features.ipynb)\n\nCheck out this excellent article on Medium - [Leafmap a new Python Package for Geospatial data science](https://link.medium.com/HRRKDcynYgb)\n\nTo learn more about leafmap, check out the leafmap documentation website - <https://leafmap.org>\n\n\n\n## Key Features\n\nLeafmap offers a wide range of features and capabilities that empower geospatial data scientists, researchers, and developers to unlock the potential of their data. Some of the key features include:\n\n- **Creating an interactive map with just one line of code:** Leafmap makes it easy to create an interactive map by providing a simple API that allows you to load and visualize geospatial datasets with minimal coding.\n\n- **Switching between different mapping backends:** Leafmap supports multiple mapping backends, including ipyleaflet, folium, kepler.gl, pydeck, and bokeh. You can switch between these backends to create maps with different visualization styles and capabilities.\n\n- **Changing basemaps interactively:** Leafmap allows you to change basemaps interactively, providing a variety of options such as OpenStreetMap, Stamen Terrain, CartoDB Positron, and many more.\n\n- **Adding XYZ, WMS, and vector tile services:** You can easily add XYZ, WMS, and vector tile services to your map, allowing you to overlay additional geospatial data from various sources.\n\n- **Displaying vector data:** Leafmap supports various vector data formats, including Shapefile, GeoJSON, GeoPackage, and any vector format supported by GeoPandas. You can load and display vector data on the map, enabling you to visualize and analyze spatial features.\n\n- **Displaying raster data:** Leafmap allows you to load and display raster data, such as GeoTIFFs, on the map. This feature is useful for visualizing satellite imagery, digital elevation models, and other gridded datasets.\n\n- **Creating custom legends and colorbars:** Leafmap provides tools for customizing legends and colorbars on the map, allowing you to represent data values with different colors and corresponding labels.\n\n- **Creating split-panel maps and linked maps:** With Leafmap, you can create split-panel maps to compare different datasets side by side. You can also create linked maps that synchronize interactions between multiple maps, providing a coordinated view of different spatial data.\n\n- **Downloading and visualizing OpenStreetMap data:** Leafmap allows you to download and visualize OpenStreetMap data, providing access to detailed street maps, buildings, and other points of interest.\n\n- **Creating and editing vector data interactively:** Leafmap includes tools for creating and editing vector data interactively on the map. You can draw points, lines, and polygons, and modify them as needed.\n\n- **Searching for geospatial data:** Leafmap provides functionality for searching and accessing geospatial data from sources such as SpatialTemporal Asset Catalogs (STAC), Microsoft Planetary Computer, AWS Open Data Registry, and OpenAerialMap.\n\n- **Inspecting pixel values interactively:** Leafmap allows you to interactively inspect pixel values in raster datasets, helping you analyze and understand the data at a more granular level.\n\n- **Creating choropleth maps and heat maps:** Leafmap supports the creation of choropleth maps, where colors represent different data values for specific geographic areas. You can also create heat maps to visualize data density.\n\n- **Displaying data from a PostGIS database:** Leafmap provides tools for connecting to a PostGIS database and displaying spatial data stored in the database on the map.\n\n- **Creating time series animations:** Leafmap enables the creation of time series animations from both vector and raster data, allowing you to visualize temporal changes in your geospatial datasets.\n\n- **Analyzing geospatial data with whitebox:** Leafmap integrates with WhiteboxTools and whiteboxgui, providing a suite of geospatial analyses, such as hydrological analysis, terrain analysis, and LiDAR processing.\n\n- **Segmenting and classifying remote sensing imagery:** Leafmap integrates the segment-geospatial package, which provides tools for segmenting and classifying remote sensing imagery using deep learning algorithms.\n\n- **Building interactive web apps:** Leafmap supports the development of interactive web applications using frameworks like Voila, Streamlit, and Solara. This allows you to share your geospatial analyses and visualizations with others in a user-friendly web interface.\n\nThese features and capabilities make leafmap a powerful tool for geospatial data exploration, analysis, and visualization. Whether you are a beginner or an experienced geospatial data scientist, leafmap provides an accessible and efficient way to work with geospatial data in Python.\n\n## Citations\n\nIf you find **leafmap** useful in your research, please consider citing the following paper to support my work. Thank you for your support.\n\n- Wu, Q. (2021). Leafmap: A Python package for interactive mapping and geospatial analysis with minimal coding in a Jupyter environment. _Journal of Open Source Software_, 6(63), 3414. <https://doi.org/10.21105/joss.03414>\n\n## Demo\n\n\n\n## YouTube Channel\n\nI have created a [YouTube Channel](https://youtube.com/@giswqs) for sharing geospatial tutorials. You can subscribe to my channel for regular updates. Check out the following videos for 3D mapping with MapLibre and Leafmap.\n\n[](https://bit.ly/maplibre)\n",
"bugtrack_url": null,
"license": "MIT license",
"summary": "A Python package for geospatial analysis and interactive mapping in a Jupyter environment.",
"version": "0.57.1",
"project_urls": {
"Homepage": "https://github.com/opengeos/leafmap"
},
"split_keywords": [
"leafmap"
],
"urls": [
{
"comment_text": null,
"digests": {
"blake2b_256": "d4b168c0e3156e811685a3f98d71a9cefd46a54b6d74f23809c3ec540e94d222",
"md5": "0dc90bd2bd08a64bde4e433a55f1d8f8",
"sha256": "406bb2f223381a3cada96a55ea05b915139a906e1bffb10e3f48584214f66617"
},
"downloads": -1,
"filename": "leafmap-0.57.1-py2.py3-none-any.whl",
"has_sig": false,
"md5_digest": "0dc90bd2bd08a64bde4e433a55f1d8f8",
"packagetype": "bdist_wheel",
"python_version": "py2.py3",
"requires_python": ">=3.9",
"size": 629408,
"upload_time": "2025-11-05T23:15:42",
"upload_time_iso_8601": "2025-11-05T23:15:42.676599Z",
"url": "https://files.pythonhosted.org/packages/d4/b1/68c0e3156e811685a3f98d71a9cefd46a54b6d74f23809c3ec540e94d222/leafmap-0.57.1-py2.py3-none-any.whl",
"yanked": false,
"yanked_reason": null
},
{
"comment_text": null,
"digests": {
"blake2b_256": "a2ac6bba7c5bbc5e46af21f2fd8a06de8bc0a29a52702dd8fa4270b5239b55ad",
"md5": "bc02a6d631839ae52c11e247bdbf9681",
"sha256": "a6344222a13244b85b1abd2a435cb906b5e79b704e24bd0062d423d076c59a0c"
},
"downloads": -1,
"filename": "leafmap-0.57.1.tar.gz",
"has_sig": false,
"md5_digest": "bc02a6d631839ae52c11e247bdbf9681",
"packagetype": "sdist",
"python_version": "source",
"requires_python": ">=3.9",
"size": 8125666,
"upload_time": "2025-11-05T23:15:45",
"upload_time_iso_8601": "2025-11-05T23:15:45.200148Z",
"url": "https://files.pythonhosted.org/packages/a2/ac/6bba7c5bbc5e46af21f2fd8a06de8bc0a29a52702dd8fa4270b5239b55ad/leafmap-0.57.1.tar.gz",
"yanked": false,
"yanked_reason": null
}
],
"upload_time": "2025-11-05 23:15:45",
"github": true,
"gitlab": false,
"bitbucket": false,
"codeberg": false,
"github_user": "opengeos",
"github_project": "leafmap",
"travis_ci": false,
"coveralls": false,
"github_actions": true,
"requirements": [
{
"name": "anywidget",
"specs": []
},
{
"name": "bqplot",
"specs": []
},
{
"name": "duckdb",
"specs": [
[
">=",
"1.4.1"
]
]
},
{
"name": "folium",
"specs": []
},
{
"name": "gdown",
"specs": []
},
{
"name": "geojson",
"specs": []
},
{
"name": "geopandas",
"specs": []
},
{
"name": "ipyevents",
"specs": []
},
{
"name": "ipyfilechooser",
"specs": []
},
{
"name": "ipyleaflet",
"specs": []
},
{
"name": "ipyvuetify",
"specs": []
},
{
"name": "ipywidgets",
"specs": []
},
{
"name": "maplibre",
"specs": []
},
{
"name": "matplotlib",
"specs": []
},
{
"name": "numpy",
"specs": []
},
{
"name": "pandas",
"specs": []
},
{
"name": "plotly",
"specs": []
},
{
"name": "pystac-client",
"specs": []
},
{
"name": "python-box",
"specs": []
},
{
"name": "scooby",
"specs": []
},
{
"name": "whiteboxgui",
"specs": []
},
{
"name": "xyzservices",
"specs": []
}
],
"lcname": "leafmap"
}

